Title: Assessment of Menstrual Health Status and Evolution through Mobile Apps for Fertility Awareness Authors and affiliations: Laura Symul1,2* ...
←
→
Page content transcription
If your browser does not render page correctly, please read the page content below
bioRxiv preprint first posted online Aug. 15, 2018; doi: http://dx.doi.org/10.1101/385054. The copyright holder for this preprint
 (which was not peer-reviewed) is the author/funder, who has granted bioRxiv a license to display the preprint in perpetuity.
                                It is made available under a CC-BY-ND 4.0 International license.

   Title:
   Assessment of Menstrual Health Status and Evolution through Mobile
   Apps for Fertility Awareness

   Authors and affiliations:
   Laura Symul1,2*, Katarzyna Wac3, Paula Hillard4, Marcel Salathé2

   1
    Department of Surgery, Stanford School of Medicine, Stanford University, 300 Pasteur Dr.,
   Stanford, California 94305-5317, USA.
   2
    Digital Epidemiology Lab, Global Health Institute, School of Life Sciences, École
   Polytechnique Fédérale de Lausanne (EPFL), Campus Biotech, Chemin des mines 9, CH-1202
   Geneva, Switzerland.
   3
    Quality of Life Technologies lab, Institute of Services Science, Center for Informatics,
   University of Geneva, CUI Battelle bat A, Route de Drize 7, 1227 Carouge, Switzerland.
   4
    Department of Obstetrics & Gynecology, Stanford School of Medicine, Stanford University,
   300 Pasteur Dr. HH333, Stanford, California 94305-5317, USA.
   *Correspondence to: lsymul@stanford.edu.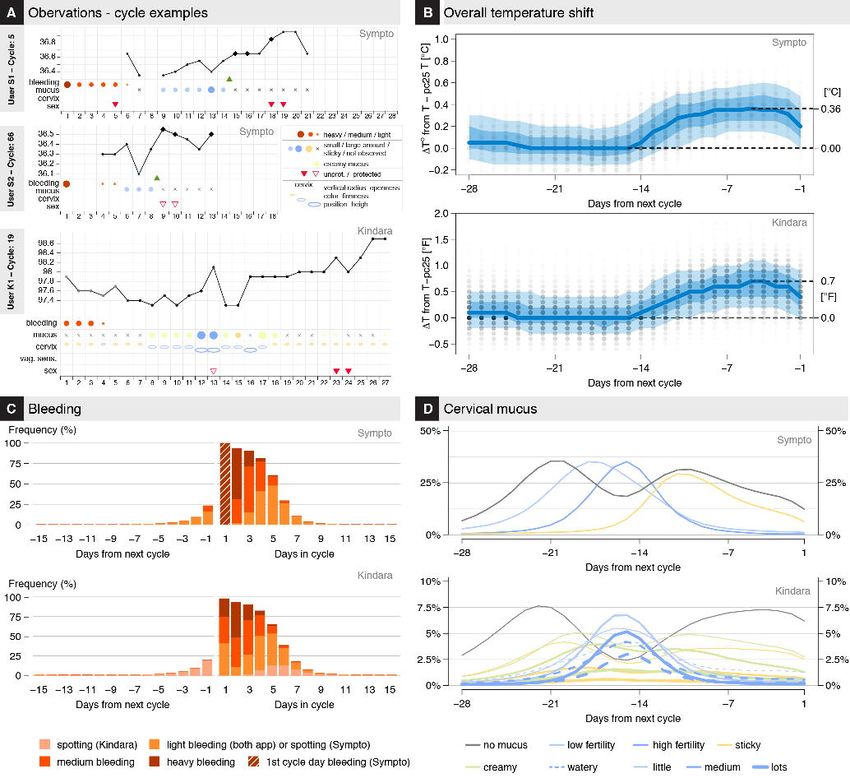
bioRxiv preprint first posted online Aug. 15, 2018; doi: http://dx.doi.org/10.1101/385054. The copyright holder for this preprint
 (which was not peer-reviewed) is the author/funder, who has granted bioRxiv a license to display the preprint in perpetuity.
                                It is made available under a CC-BY-ND 4.0 International license.

   Abstract
   For most women of reproductive age, assessing menstrual health and fertility usually involves

   regular visits to a gynecologist or another clinician. While these exams provide critical

   information on an individual’s reproductive health status, they typically rely on personal

   memory, and the results are rarely, if ever, assessed at the population level. In recent years,

   mobile apps for menstrual tracking have become very popular, allowing us to evaluate the

   accuracy, reliability and tracking frequency of millions of self-observations, thereby providing

   an unparalleled view, both in detail and scale, on menstrual health and its evolution. We acquired

   self-observation data from two mobile apps dedicated to the application of the sympto-thermal

   fertility awareness method, resulting in a dataset of more than 30 million days of observations

   from over 2.7 million cycles, where up to 40% of the cycles in which users were seeking

   pregnancy had recordings every single day. We used a statistical and modeling approach to

   describe the collected data and investigate ovulation timing. We found that only 24% of

   ovulations occur at days 14 to 15, that ~20% of luteal phases last for only 10 days or shorter, and

   that pre-menstrual light bleeding is associated with earlier temperature drop in the late luteal

   phase. The digital epidemiology approach presented here can help to lead to a better

   understanding of menstrual health and its connection to women’s health overall, which has

   historically been severely understudied.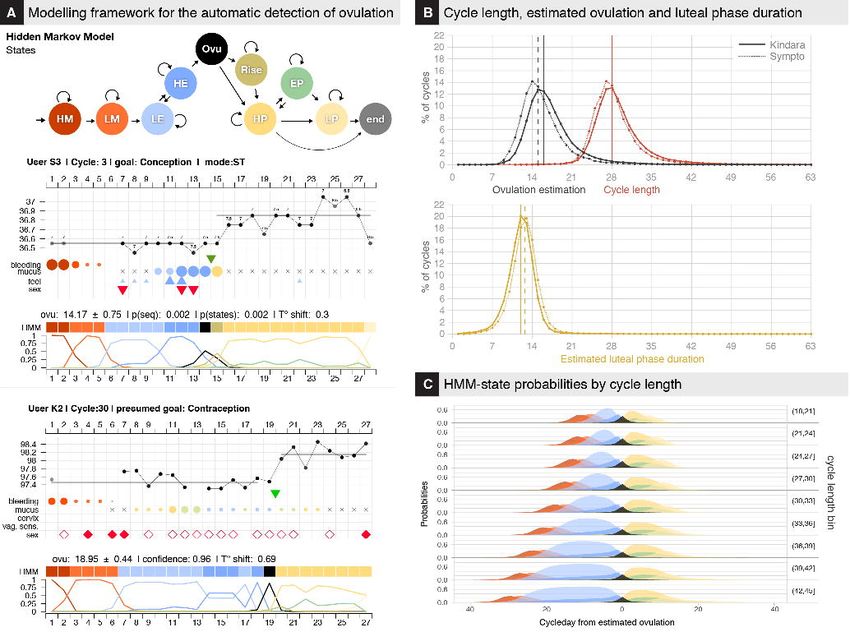
bioRxiv preprint first posted online Aug. 15, 2018; doi: http://dx.doi.org/10.1101/385054. The copyright holder for this preprint
 (which was not peer-reviewed) is the author/funder, who has granted bioRxiv a license to display the preprint in perpetuity.
                                It is made available under a CC-BY-ND 4.0 International license.

   Significance statement

   Over 200 million women track their menstrual cycles using mobile phone apps, but it is unclear

   if these digitally reported data can inform on menstrual health or fertility at the population level.

   Here we acquired and presented self-observation data of over 2.7 million cycles from two

   fertility awareness apps. We used a statistical and modeling approach to evaluate the accuracy,

   reliability and tracking frequency of millions of self-observations. As up to 40% of the cycles in

   which users were seeking pregnancy had recordings every single day, mobile self-tracking

   provides a high resolution and long-term view on individual women’s patterns, with a strong

   potential for improved clinical decision making.

   Keywords:

   Menstrual cycle; mobile phone apps; fertility awareness; digital epidemiology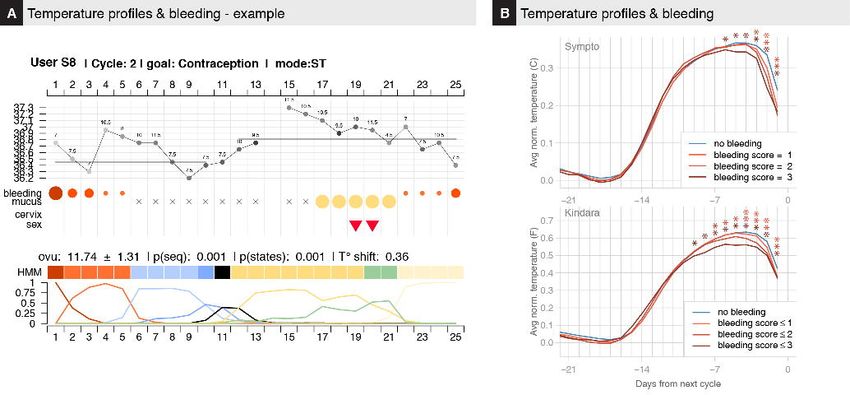
bioRxiv preprint first posted online Aug. 15, 2018; doi: http://dx.doi.org/10.1101/385054. The copyright holder for this preprint
 (which was not peer-reviewed) is the author/funder, who has granted bioRxiv a license to display the preprint in perpetuity.
                                It is made available under a CC-BY-ND 4.0 International license.

   Main Text:
   A broad diversity of fertility awareness methods (FAMs) has been developed in the past century

   (1, 2), primarily designed to help couples manage fertility and family planning. Modern methods

   developed in the last quarter of the 20th century take advantage of the precise description of

   menstrual variation of the basal body temperature (BBT) or waking temperature, cervical mucus

   quality and quantity, vaginal sensation, and cervical position (3–6). These methods have defined

   a set of rules that allows the identification of the fertile window around ovulation, so that couples

   can adapt their sexual behavior according to their reproductive objectives (7–9). The sympto-

   thermal method, which combines BBT and cervical mucus observations, is arguably amongst the

   most reliable FAM for family planning (1, 2, 4, 10). Recently, a number of mobile apps have

   been developed by private organizations to facilitate FAM tracking. Some of these apps provide

   their users with automatized interpretation with regard to the opening and closing of the fertility

   window (11). Over the past few years, an increasing number of women, estimated at over 200

   million (12), have started using these apps, contributing to the accumulation of menstrual-related

   data from a diverse population of users at different stage of life (Fig. 1A).

              We were interested in evaluating the potential of the collected data for the assessment of

   menstrual health, both at the individual level and at the population level, and to help enable

   better clinical-decision-making processes. We obtained two representative datasets from the apps

   Kindara (K) and Sympto (S) (11) (Fig. S1A,B, Table S1). Both apps offer similar FAM tracking

   options but differ in their design and user experience (Fig. S1AB, Table S2). Some of the key

   differences are (i) the automatic- (S) vs user- (K) interpretation of observations, (ii) the per-cycle

   (S) vs per-user (K) definition of fertility goals users wish to achieve, (iii) the criteria for the onset

   of a new cycle, i.e. fresh bleeding after ovulation (S) vs self-assessed or automatic (K), and (iv)

   the precision at which users can report their observations (SI).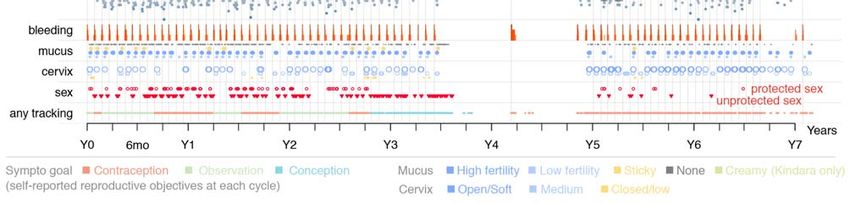
bioRxiv preprint first posted online Aug. 15, 2018; doi: http://dx.doi.org/10.1101/385054. The copyright holder for this preprint
 (which was not peer-reviewed) is the author/funder, who has granted bioRxiv a license to display the preprint in perpetuity.
                                It is made available under a CC-BY-ND 4.0 International license.

              We investigated the differences in typical use and tracking behavior of regular FAM

   users during their usual cycles, which we refer to as “standard cycles” (Methods). For an

   idealized ~28-day cycle, FAM-relevant body signs need to be recorded for 8-12 days of each

   cycle, i.e. a tracking frequency of ~ 43%. We found, however, that most regular users report their

   observations for over 16 days per cycle. For cycles in which users choose to record sexual

   intercourse (65% (S) – 75% (K) of standard cycles), tracking frequency is increased, with over

   40% of cycles being tracked every single day when seeking pregnancy (Fig. 1B, S1D),

   sometimes for long intervals (Fig. 1C).

              Confident that users regularly logged observations (Fig. 1B) during standard cycles, we

   sought to characterize general patterns in the observations and frequency of the different FAM

   body signs. As cycle durations vary by several days, as illustrated in Fig. 2A, and given that the

   duration of the luteal phase (after ovulation) has been shown to vary less than the follicular phase

   (before ovulation) (13, 14), we chose to show the ovulation-related observations (BBT, mucus,

   cervix, vaginal sensation) from the end of each cycle (Fig. 2B-D, S2). Consistently with previous

   observations on a cohort of much smaller size (15), we observed a clear shift of about

   0.36°C/0.7°F in BBT between the mid-follicular phase and the mid-luteal phase (Fig 2B, S2A).

   BBT showed a decrease at the end of the cycle, as light bleeding or spotting was reported (Fig.

   2BC).

              In an ovulatory cycle, it is well established that cervical mucus is produced in higher

   quantity and with a higher stretchiness in the days leading up to ovulation (5, 6, 9, 16), which

   seems to be observed by users tracking their cervical mucus (85-90% (S) and 40-45% (K) of

   cycles) (Fig. 2D).

              Previous studies have shown that the combination of BBT and cervical mucus variations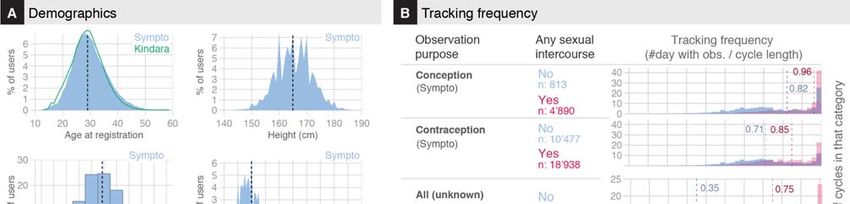
bioRxiv preprint first posted online Aug. 15, 2018; doi: http://dx.doi.org/10.1101/385054. The copyright holder for this preprint
 (which was not peer-reviewed) is the author/funder, who has granted bioRxiv a license to display the preprint in perpetuity.
                                It is made available under a CC-BY-ND 4.0 International license.

   were reliable, although not perfect, proxies for the detection of ovulation (8, 16–18). We

   therefore decided to define a mathematical framework (HMM) to derive an estimate of the most

   likely day of ovulation with reliability indicators to reflect the uncertainty of conflicting or

   unexpected observation patterns (Fig. 3A, S3-5, Methods).

              Based on these estimations, we could compare the distribution of cycle length to those of

   estimated day of ovulation and of luteal phase duration (Fig. 3B) for cycles with reliable

   ovulation estimation (109,161 cycles, Methods). We observed an asymmetrical distribution of

   cycle length around the typical 27 to 28 days, with a heavy tail on longer cycles. We found a

   similar asymmetrical distribution for follicular phase duration (or ovulation day), with a median

   value of 16 days, and 90% of ovulations occurring between day 10 and day 24. Only ~24% of

   ovulations occurred on days 14 to 15 of the cycle.

              Luteal phase duration also displayed an asymmetrical distribution, but with a skew for

   smaller values and presenting a smaller standard deviation (Fig. 2BC, S4B). Median values were

   12 (K) and 13 (S) days, which is in line with a previous study that used fertility monitors (19) but

   shorter than values reported in studies that used LH peak for timing of ovulation (14, 20). About

   35% of cycles have a luteal phase duration of 12 to 13 days, while ~20% of cycles had a luteal

   phase duration smaller than or equal to 10 days, which represents a higher proportion than

   reported in a previous epidemiological study (14). We also observed differences between the

   distributions obtained from the two different apps. These differences might be due to biases

   found in the user population, especially for users seeking pregnancy that could be at higher risk

   of sub-fertility if we assume they start tracking after they have already tried to get pregnant for

   several months (Fig S4C).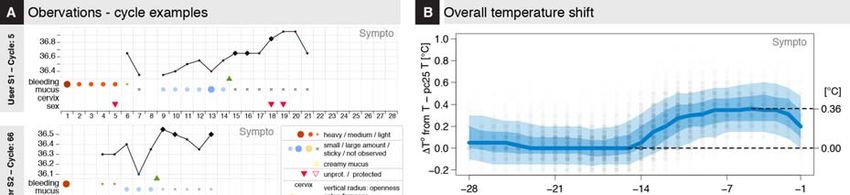
bioRxiv preprint first posted online Aug. 15, 2018; doi: http://dx.doi.org/10.1101/385054. The copyright holder for this preprint
 (which was not peer-reviewed) is the author/funder, who has granted bioRxiv a license to display the preprint in perpetuity.
                                It is made available under a CC-BY-ND 4.0 International license.

              Intrigued by the temporal profile of BBT in the late luteal phase (Fig. 2B), and because

   we observed many cases in which early temperature drops were concomitant with pre-menstrual

   bleeding such as illustrated in Fig. 4A, we further investigated the variations in the timing of the

   end-of-cycle temperature drop and of pre-menstrual bleeding. We defined 4 categories of cycles

   based on the intensity of pre-menstrual bleeding, including a “no bleeding reported” category.

   We found that the greater the pre-menstrual bleeding, the earlier the temperature drop and the

   lower the temperature in the mid/late-luteal phase (Fig. 4B, significantly different BBT

   distributions, t-test, p < 0.05). These observations are consistent with the findings that BBT is

   positively regulated by progesterone and negatively by estrogen (21). Decreasing BBT would

   thus reflect decreasing progesterone levels, which is critical for the timing of endometrial

   shedding (i.e., the menses). These observations could also provide information on how users

   should report the first day of their period and if light bleeding or spotting should be considered as

   part of their period, therefore shortening the luteal phase by another 1 or 2 days.

              This study’s goal was to explore the suitability of datasets collected through two mobile

   applications (Kindara and Sympto) for the assessment of menstrual health in general, both at the

   individual level and at the population level. The most obvious potential limitation of this study

   comes from the origin of the data: a self-selected possibly biased population, limited medical and

   general information on users, irregular observation patterns and little control on assessing the

   validity of the observations, in particular with regard to cervical mucus tracking. While the

   tracking frequency limitation can be alleviated through strict selection of users and cycles

   (Methods), all other limiting factors might have introduced biases in the present analysis.

   Prospective studies on selected cohorts with appropriate follow-up and information provided to

   users will provide higher quality data, which could then be used for comparison.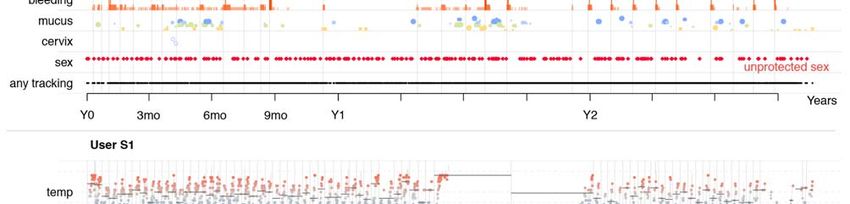
bioRxiv preprint first posted online Aug. 15, 2018; doi: http://dx.doi.org/10.1101/385054. The copyright holder for this preprint
 (which was not peer-reviewed) is the author/funder, who has granted bioRxiv a license to display the preprint in perpetuity.
                                It is made available under a CC-BY-ND 4.0 International license.

               Based on the current findings, we suggest that self-tracking of FAM-related body signs

   provides an affordable means to evaluate the status and evolution of menstrual health. These

   long term and yet very precise recordings support the idea that the menstrual cycle, like other

   biological rhythms, is a vital sign whose variations inform about overall health status (22, 23).

   The digital epidemiology approach (24), where patients collect data themselves through digital

   means, can in this context represent a powerful method to investigate menstrual health and its

   connection to women’s health at the population level (25) in a field that has historically been

   severely understudied (26). We believe that users of such applications probably already have an

   increased awareness of their cycles, and this study shows that these digitally self-tracked

   observations present an unprecedented opportunity to facilitate the dialog between patients and

   their clinicians, helping them to make informed decisions based on quantified indicators. The

   current and future development of evidence-based digital tools for menstrual health monitoring

   could positively impact women’s health, particularly in areas where access to healthcare is

   limited.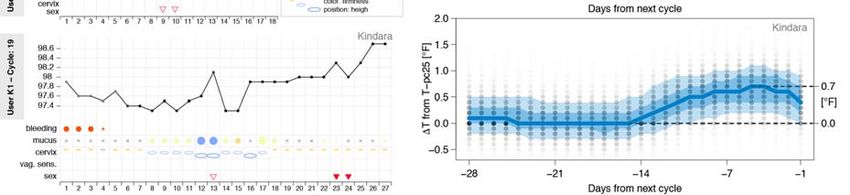
bioRxiv preprint first posted online Aug. 15, 2018; doi: http://dx.doi.org/10.1101/385054. The copyright holder for this preprint
 (which was not peer-reviewed) is the author/funder, who has granted bioRxiv a license to display the preprint in perpetuity.
                                It is made available under a CC-BY-ND 4.0 International license.

   Methods
   Extended Materials and Methods can be found in the Supplementary Information (SI).

   Data acquisition

   We obtained two de-identified datasets from the Symptotherm foundation (www.sympto.org)

   and Kindara (www.kindara.com) upon receiving ethical approval from the Canton Geneva

   ethical commission (CCER Genève, Switzerland), study number 2017-02108. Kindara provided

   a representative sample of their overall pool of users with at least 4 logged cycles while Sympto

   provided observations from their long-term users and users who provided their weight, height

   and menarche age.

   Selection criteria for users and cycles

   Standard cycles (Sympto: 39,896 cycles; Kindara: 719,182 cycles) denote usual cycles of regular

   users of the apps. Criteria summary:

   - (S&K) not the first cycle of a user nor an on-going cycle

   - (S&K) observation gaps were no longer than 15 days within a given cycle

   - (S&K) at least one FAM body sign (BBT or cervical mucus or cervix position) was recorded

   - (S&K) no mid-cycle period-like bleeding was detected when the cycle was longer than 40 days

   - (S) defined as ovulatory cycles by the STM algorithm of Sympto, i.e. in which the fertile

   window could be closed.

   - (K) at least 8 FAM observations were reported

   - (S) no breastfeeding was reported or peri-menopause was declared

   - (K) cycle length was at least 4 days longer than the total number of days in which bleeding was

   reported

   Cycles with reliable ovulation estimation (Sympto: 28,453 cycles; Kindara: 80,708)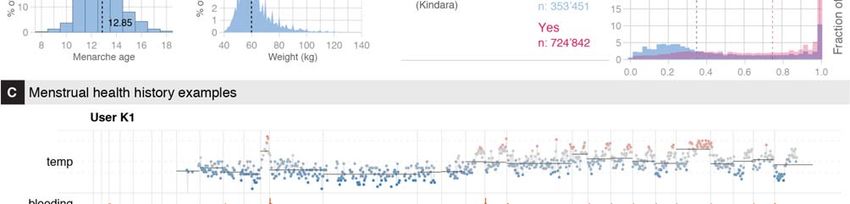
bioRxiv preprint first posted online Aug. 15, 2018; doi: http://dx.doi.org/10.1101/385054. The copyright holder for this preprint
 (which was not peer-reviewed) is the author/funder, who has granted bioRxiv a license to display the preprint in perpetuity.
                                It is made available under a CC-BY-ND 4.0 International license.

   Criteria summary:

   - standard cycles

   - detected temperature shift was at least 0.15C (S) or 0.27F (K) (SI).

   - the uncertainty on the ovulation estimation was lower than ±1.5 day (SI).

   - the confidence score, which is related to acceptable amount of missing data in the ovulatory

   period, was equal or higher than 75% (SI).

   Observations decoding and ovulation timing estimation with HMM

   The FAM body-signs are considered to reflect the hormonal changes orchestrating the menstrual

   cycles. We were interested in understanding which cycles were reported with observations that

   were consistent with previous literature description and for which it was thus possible to estimate

   timing of ovulation. Hidden Markov Models (HMM) are one of the most suitable mathematical

   frameworks due to its ability to uncover, from observations, latent phenomenon, which are here

   the cascade of hormonal events across the menstrual cycle. Briefly, we defined a 10-states

   HMM, in which each state is a particular phase of the menstrual cycle (Fig. 3A top, S3A, SI),

   and used decoding algorithms (Viterbi – Backward-Forward) to estimate the ovulation time, the

   uncertainty on this estimation, and a confidence score that accounts for missing observation and

   variation in temperature taking times.

   We then established a set of stringent criteria on the uncertainty of the ovulation estimation (≤

   ±1.5 days), the magnitude of the temperature shift (≥ 0.15 C) and the confidence score of the

   observations (≥ 0.75) to discriminate between cycles for which the estimations could be trusted

   (cycles with reliable ovulation estimation) and those where the observations did not allow for a

   reliable estimation of the ovulation day (Fig S4A, SI). These strict criteria lead to the exclusion
bioRxiv preprint first posted online Aug. 15, 2018; doi: http://dx.doi.org/10.1101/385054. The copyright holder for this preprint
(which was not peer-reviewed) is the author/funder, who has granted bioRxiv a license to display the preprint in perpetuity.
It is made available under a CC-BY-ND 4.0 International license.
of ~40% (Sympto) and ~ 89% (Kindara) of the standard cycles that were initially selected. In
total, 28,453 (Sympto) + 80,708 (Kindara) cycles with reliable ovulation estimation have been
used for the subsequent analyses (SI).
Model description
The Hidden Markov Model (HMM) we defined describes a discretization in 10 states of the
successive hormonal events throughout an ovulatory menstrual cycle. The HMM definition also
includes the probabilities of observing the different FAM reported body signs in each state
(emission probabilities) and the probabilities of switching from one state to another (transition
probabilities). Emission probabilities were chosen to reflect observations previously made in
studies that tested for ovulation with LH tests or ultrasounds (6, 8, 16), while transition
probabilities were chosen in a quasi-uniform manner (SI). We found that the ovulation
estimations were robust to changes in transition probabilities but not to variations in emission
probabilities (Fig S5, SI), indicating that this simple framework is suitable to detect ovulations in
cycles of any length, and potentially including pregnancies, relying primarily on users’
observations.
Once the model was defined, we used the Viterbi and the Backward-Forward algorithms (27) to
calculate the most probable state sequence for each cycle (SI) and thus to have an estimation of
ovulation timing, i.e. the most likely day of the cycle in which the HMM is in the state
“ovulation”. We also computed the uncertainty of the estimation, i.e. the standard deviation of
the distribution of probabilities for the state ‘ovulation’, which can be interpreted as the
confidence interval in days for the time of ovulation estimation (SI). We also defined abioRxiv preprint first posted online Aug. 15, 2018; doi: http://dx.doi.org/10.1101/385054. The copyright holder for this preprint
(which was not peer-reviewed) is the author/funder, who has granted bioRxiv a license to display the preprint in perpetuity.
It is made available under a CC-BY-ND 4.0 International license.
confidence score that accounts for missing observations and variation in temperature taking time
in a window of ~5 days around the estimated ovulation day (SI).
HMM states
We defined 10 states as a discretization of the hormonal evolution across the cycle (further
details in SI)
HM: onset of the menses and the heavy/medium flow of fresh blood.
LM: days of light bleeding or spotting that conclude menstruations.
LE: Low Estrogen.
HE: High estrogen (HE
Ovu: Ovulation
Rise: Temperature rise associated with rise in progesterone production.
HP: High Progesterone
EP: Estrogen Peak in luteal phase.
LP: Low Progesterone.
End: Artificial state for the end of each cycle.bioRxiv preprint first posted online Aug. 15, 2018; doi: http://dx.doi.org/10.1101/385054. The copyright holder for this preprint
(which was not peer-reviewed) is the author/funder, who has granted bioRxiv a license to display the preprint in perpetuity.
It is made available under a CC-BY-ND 4.0 International license.
References:
1. Lamprecht V, Trussell J (1997) Natural family planning effectiveness: Evaluating
published reports. Adv Contracept 13(2–3):155–165.
2. Peragallo Urrutia R, et al. (2018) Effectiveness of Fertility Awareness–Based Methods for
Pregnancy Prevention. Obstet Gynecol 00(00):1.
3. Marshall J (1976) Cervical Mucus and Basal Body Temperature Method of Regulating
Births. Field Trial. Lancet 308(7980):282–283.
4. Moghissi KS (1982) Prediction and detection of ovulation. 224–33.
5. Moghissi KS (1966) Cyclic changes of cervical mucus in normal and progestin-treated
women. Fertil Steril 17(5):663–675.
6. Billings EL, Brown JB, Billings JJ, Burger HG (1972) Symptoms and Hormonal Changes
Accompanying Ovulation. Lancet 299(7745):282–284.
7. Wilcox AJ (2000) The timing of the “fertile window” in the menstrual cycle: day specific
estimates from a prospective study. BMJ 321(7271):1259–1262.
8. Frank-Herrmann P, Gnoth C, Baur S, Strowitzki T, Freundl G (2005) Determination of the
fertile window: Reproductive competence of women - European cycle databases. Gynecol
Endocrinol 20(6):305–312.
9. Bigelow JL, et al. (2004) Mucus observations in the fertile window: A better predictor of
conception than timing of intercourse. Hum Reprod 19(4):889–892.
10. Frank-Herrmann P, et al. (2007) The effectiveness of a fertility awareness based method
to avoid pregnancy in relation to a couple’s sexual behaviour during the fertile time: A
prospective longitudinal study. Hum Reprod 22(5):1310–1319.
11. Duane M, Contreras A, Jensen ET, White A (2016) The Performance of Fertility
Awareness-based Method Apps Marketed to Avoid Pregnancy. J Am Board Fam MedbioRxiv preprint first posted online Aug. 15, 2018; doi: http://dx.doi.org/10.1101/385054. The copyright holder for this preprint
(which was not peer-reviewed) is the author/funder, who has granted bioRxiv a license to display the preprint in perpetuity.
It is made available under a CC-BY-ND 4.0 International license.
29(4):508–11.
12. Dreaper J (2016) Women warned about booming market in period tracker apps - BBC
News. BBC. Available at: http://www.bbc.com/news/health-37013217 [Accessed January
7, 2018].
13. Lenton EA, Landgren BM, Sexton L, Harper R (1984) Normal variation in the length of
the follicular phase of the menstrual cycle: effect of chronological age. Br J Obstet
Gynaecol 91(7):681–4.
14. Lenton EA, Landgren BM, Sexton L (1984) Normal variation in the length of the luteal
phase of the menstrual cycle: identification of the short luteal phase. Br J Obstet Gynaecol
91(7):685–9.
15. Moghissi KS (1976) Accuracy of Basal Body Temperature for Ovulation Detection. Fertil
Steril 27(12):1415–1421.
16. Moghissi KS, Syner FN, Evans TN (1972) A composite picture of the menstrual cycle.
Am J Obstet Gynecol 114(3):405–18.
17. Moghissi KS (1976) Accuracy of Basal Body Temperature for Ovulation
Detection**Presented at the Thirty-Second Annual Meeting of The American Fertility
Society, April 5 to 9, 1976, Las Vegas, Nev. Fertil Steril 27(12):1415–1421.
18. Templeton AA, Penney GC, Lees MM (1982) Relation between the luteinizing hormone
peak, the nadir of the basal body temperature and the cervical mucus score. BJOG An Int J
Obstet Gynaecol 89(12):985–988.
19. Fehring RJ, Schneider M, Raviele K (2006) Variability in the Phases of the Menstrual
Cycle. J Obstet Gynecol Neonatal Nurs 35(3):376–384.
20. Johannisson E, Landgren B-M, Rohr HP, Diczfalusy E (1987) Endometrial morphologybioRxiv preprint first posted online Aug. 15, 2018; doi: http://dx.doi.org/10.1101/385054. The copyright holder for this preprint
(which was not peer-reviewed) is the author/funder, who has granted bioRxiv a license to display the preprint in perpetuity.
It is made available under a CC-BY-ND 4.0 International license.
and peripheral hormone levels in women with regular menstrual cycles**Supported by the
World Health Organization (WHO) Special Programme of Research in Human
Reproduction and by Swiss National Research Foundation grant 3.912-0.82.††. Fertil
Steril 48(3):401–408.
21. Charkoudian N, Stachenfeld N (2016) Sex hormone effects on autonomic mechanisms of
thermoregulation in humans. Auton Neurosci Basic Clin 196:75–80.
22. American Academy Of Pediatrics and American College of Obstretricians and
Gynecologists (2016) Menstruation in Girls and Adolescents: Using the Menstrual Cycle
as a Vital Sign. Am Acad Pediatr 137(3):e20154480–e20154480.
23. Alvergne A, Högqvist Tabor V (2018) Is female health cyclical? Evolutionary
perspectives on menstruation. Trends Ecol Evol 33(6):In Press.
24. Salathé M, et al. (2012) Digital epidemiology. PLoS Comput Biol 8(7):1–5.
25. Harlow SD, Ephross SA (1995) Epidemiology of Menstruation and Its Relevance to
Women ’ s Health. Public Health 17(2).
26. Grayson M (2017) Women’s health. Nature 550(7674):S1.
27. Rabiner LR (1989) A tutorial on hidden Markov models and selected applications in
speech recognition. Proc IEEE 77(2):257–286.bioRxiv preprint first posted online Aug. 15, 2018; doi: http://dx.doi.org/10.1101/385054. The copyright holder for this preprint
(which was not peer-reviewed) is the author/funder, who has granted bioRxiv a license to display the preprint in perpetuity.
It is made available under a CC-BY-ND 4.0 International license.
Acknowledgments:
We are deeply grateful to all Kindara and Sympto users whose data have been used for this study
and to the Symptotherm foundation and Kindara company. In particular, we thank Dr. H.
Wettstein, C. Bourgeois, V. Salonna, T. Newcomer, T. Baras, C. Allémann, P. Ducoeurjoly and
F. Goddyn for sharing their experience, references and for fruitful discussions. We thank C.
Droin and G. Lazzari for discussion on the mathematical modeling.
Funding:
L.S. is supported by a Postdoc Mobility grant (P2ELP3_178315) from the Swiss National
Science Foundation (www.snf.ch).
Author contributions:
L.S. initiated and conceived the study, analyzed the data and designed the figures, L.S., K.W.,
P.H. and M.S. wrote the manuscript. All authors discussed the results and implications and
commented on the manuscript at all stages.
Competing interests:
L.S., K.W. and M.S. have no competing interest. P.H. discloses that she is a consultant and
medical advisor to Clue by Biowink.
Data and materials availability:
While the privacy policies and terms of usage of the two apps allow the sharing of their de-
identified users’ data with third parties for research purposes, they do not allow public sharing ofbioRxiv preprint first posted online Aug. 15, 2018; doi: http://dx.doi.org/10.1101/385054. The copyright holder for this preprint
(which was not peer-reviewed) is the author/funder, who has granted bioRxiv a license to display the preprint in perpetuity.
It is made available under a CC-BY-ND 4.0 International license.
the raw datasets. Aggregated values necessary for the production of the figures are available at
https://github.com/lasy/menstrual_health_FAM1.
1
This repository is currently private and will be made public at publication.
The datasets have been submitted as a compressed zip file together with this
manuscript.bioRxiv preprint first posted online Aug. 15, 2018; doi: http://dx.doi.org/10.1101/385054. The copyright holder for this preprint
(which was not peer-reviewed) is the author/funder, who has granted bioRxiv a license to display the preprint in perpetuity.
It is made available under a CC-BY-ND 4.0 International license.
Figures and figure legends
Figure 1: Demographics and tracking behavior of users
(A) Users’ age at registration (top-left), reported height (top-right), weight (bottom-right) and menarche age of
users.
(B) Cycle-specific tracking frequencies (top: Sympto, bottom: Kindara). 39,896 (Sympto) + 719,182 (Kindara)
standard cycles were used (Methods). Dashed lines indicate median values.
(C) Menstrual history of two long term Kindara (top) and Sympto (bottom) users. Time is shown in years as relativebioRxiv preprint first posted online Aug. 15, 2018; doi: http://dx.doi.org/10.1101/385054. The copyright holder for this preprint
(which was not peer-reviewed) is the author/funder, who has granted bioRxiv a license to display the preprint in perpetuity.
It is made available under a CC-BY-ND 4.0 International license.
to the first observation of each user. Top user is seeking to achieve pregnancy and show a long anovulatory episode
during which her overall temperature profile is lower. She returns to more regular, ovulatory cycles in her last year
of tracking, as indicated by the bleeding frequency and the temperature profiles. The bottom user has used the app to
avoid pregnancy and observe her cycle for almost 3 years, before trying to conceive, which she likely achieves after
9 cycles (her reported reproductive objective switches from “contraception” to “conception” – line “any tracking” at
the bottom). 9 months later, the user reports bleeding, which likely indicates post-partum bleeding (lochia). After
another 9 months, probably as she stops breastfeeding, she logs menstrual observations and returns to using the app
to avoid pregnancy.bioRxiv preprint first posted online Aug. 15, 2018; doi: http://dx.doi.org/10.1101/385054. The copyright holder for this preprint
(which was not peer-reviewed) is the author/funder, who has granted bioRxiv a license to display the preprint in perpetuity.
It is made available under a CC-BY-ND 4.0 International license.
Figure 2: User observations overview
(A) Examples of observations: the 5th tracked cycle (top) and 66th cycle (middle) cycle of two
different Sympto users. Observations of the 19th cycle (bottom) of a Kindara user.
(B) ΔBBT (variation from the 25% percentile of temperature in this cycle) values are shown on
each day of the cycle, from the end of the cycle. Opacity of the dots reflects the number of
observations. The median value: thick blue line. 10, 25, 75 and 90 percentiles of ΔBBT:bioRxiv preprint first posted online Aug. 15, 2018; doi: http://dx.doi.org/10.1101/385054. The copyright holder for this preprint
(which was not peer-reviewed) is the author/funder, who has granted bioRxiv a license to display the preprint in perpetuity.
It is made available under a CC-BY-ND 4.0 International license.
translucent blue bands.
(C) Frequency of bleeding observations, for the end (left) and beginning (right) of cycles. The
Sympto app only starts a new cycle on the first recording of heavy bleeding (score 3/3, dark red)
after a post-ovulatory infertile phase, thus all cycles present heavy bleeding at the start of the
cycle (hashed dark red bar).
(D) Frequency of cervical mucus observations from the end of cycles (top: S, bottom: K).
(Kindara) Little quantity of watery mucus (dashed line) and little or medium quantity of egg-
white like mucus (solid line) are considered as ‘low fertility’ mucus (light blue) while large
quantities of egg-white like and medium or large quantities of watery mucus are considered as
‘high fertility’ mucus (dark blue) (B-D) 39,896 (S) + 719,182 (K) standard cycles were used
(Methods)bioRxiv preprint first posted online Aug. 15, 2018; doi: http://dx.doi.org/10.1101/385054. The copyright holder for this preprint
(which was not peer-reviewed) is the author/funder, who has granted bioRxiv a license to display the preprint in perpetuity.
It is made available under a CC-BY-ND 4.0 International license.
Figure 3: Modeling framework for the estimation of ovulation and menstrual states
(A) Modeling framework for the estimation of ovulation timing. (Top) Schematics of the 10-states HMM which
discretizes the menstrual hormonal events (HM: Heavy Menses, LM: Light Menses, LE: Low Estrogen, HE: high
Estrogen, Ovu: Ovulation, Rise: progesterone/BTT Rise, HP: High Progesterone, EP: Estrogen Peak in luteal phase,
LP: Low Progesterone). Arrows indicate possible state-transition; arrow thickness is not representative of actual
transition probabilities (Methods). (Bottom) Examples of menstrual state estimation for the 2rd and 3rd cycle of 2
users. (Top of each chart) Original user observations as in Fig. 2A. (Middle of each chart) Colored squares HMM-
labeled line) represent the most likely sequence of HMM states given the observations (Methods). (Bottom of each
chart) Normalized probabilities of each state on each day of the cycle (Methods).
(B) (Top) Cycle length and estimated ovulation day. (Bottom) Luteal phase duration, computed as the number ofbioRxiv preprint first posted online Aug. 15, 2018; doi: http://dx.doi.org/10.1101/385054. The copyright holder for this preprint
(which was not peer-reviewed) is the author/funder, who has granted bioRxiv a license to display the preprint in perpetuity.
It is made available under a CC-BY-ND 4.0 International license.
days between the ovulation day (excluded) and the1st day of the next cycle (excluded). Vertical lines indicate
median values. 80,708 (K) + 24,119 (S) cycles with reliable ovulation estimation were used (Methods).
(C) Average estimated state probabilities by cycle-day counting from estimated ovulation aggregated by total cycle
length (in bins of 3 units) for all cycles with reliable ovulation estimation.bioRxiv preprint first posted online Aug. 15, 2018; doi: http://dx.doi.org/10.1101/385054. The copyright holder for this preprint
(which was not peer-reviewed) is the author/funder, who has granted bioRxiv a license to display the preprint in perpetuity.
It is made available under a CC-BY-ND 4.0 International license.
Figure 4: Temperature profiles and bleeding at the end of cycle
(A) 2nd cycle of a user with an estimated ovulation on day 11, exhibiting a slow temperature decrease throughout
the luteal phase (top) and corresponding HMM most likely states and probabilities (bottom).
(B) Average normalized temperature profiles for cycles in which no (blue), light (light red), medium (medium red)
or heavier (dark red) bleeding was observed at the end of cycles. Bleeding score is computed as the sum of reported
bleeding within the last 10 days of the cycle (spotting = 0.5 in Kindara). Temperature is normalized by the 25%
lowest percentile of that cycle (as in Fig 2B). Stars indicate significant differences in distributions between the ‘no
bleeding’ group and the bleeding groups (t-test, p < 0.05, bleeding group colors).You can also read