Improving Multi-GNSS Solutions with 3D Building Model and Tree Information
←
→
Page content transcription
If your browser does not render page correctly, please read the page content below
Improving Multi-GNSS Solutions with 3D Building Model
 and Tree Information

 Anat SCHAPER, Qianwen LIN, Kim Sarah JANECKI, Dennis MUSSGNUG, Max
 HEIKEN, Vimal CHAWDA, Lucy ICKING, Johannes KRÖGER, Steffen SCHÖN,
 Germany

 Key words: Multi-GNSS, Urban Positioning, 3DMA, Tree Information, Ray Tracing, NLOS,
 Weighting Model, Signal Disturbance

 SUMMARY

 Positioning using multiple Global Navigation Satellite Systems (GNSS) offers a significant
 advantage, especially in dense urban areas. In particular in these areas, the combination of
 individual GNSS significantly increases the number of visible satellites and thus the GNSS
 availability for positioning.
 However, signal interruptions, disturbances, and multipath effects due to buildings and trees
 still have an influence on positioning. To characterise this influence, we use a ray tracing
 algorithm to classify the observations into Line-of-Sight and Non-Line-of-Sight signals. For
 this purpose, a 3D building model of the city of Hanover and Open-Street-Map tree coordinates,
 the latter being supplemented by own measurements, are used.
 In this paper, we focus on a multi-GNSS single point positioning algorithm that incorporates
 the environmental information. We perform adapted weighting models and compare the
 performance of these weightings with already established weighting schemes (considering
 satellite elevation, signal strength or unity weighting). In this way, we verify the effectiveness
 of these extended models. We show that incorporating environmental factors in the weighting
 models gives an improvement of up to 60% in terms of the 95% quantile of the 3D deviations
 to the ground truth. In fact, comparable accuracies to carrier-to-noise density dependent
 weighting can be achieved.

Improving Multi-GNSS Solutions with 3D Building Model and Tree Information (11028)
Anat Schaper, Qianwen Lin, Kim Sarah Janecki, Dennis Mußgnug, Max Heiken (Vimal Chawda, Lucy Icking,
Johannes Kröger and Steffen Schön (Germany)
FIG e-Working Week 2021
Smart Surveyors for Land and Water Management - Challenges in a New Reality
Virtually in the Netherlands, 21–25 June 2021
Improving Multi-GNSS Solutions with 3D Building Model
 and Tree Information

 Anat SCHAPER, Qianwen LIN, Kim Sarah JANECKI, Dennis MUSSGNUG, Max
 HEIKEN, Vimal CHAWDA, Lucy ICKING, Johannes KRÖGER, Steffen SCHÖN,
 Germany

 1. INTRODUCTION

 The need of high-accuracy absolute positioning is important for applications like connected
 mobility and autonomous driving. The level of GNSS positioning performance highly depends
 on the antenna vicinity. In particular, the urban environment presents challenges such as high
 buildings which lead to Non-Line-of-Sight (NLOS) signals, diffraction, and multipath effects
 to common GNSS receivers (Drevelle & Bonnifait, 2011; Icking, et al., 2020). As a result,
 positioning in densely built-up areas, such as inner cities, is much more difficult than in open
 space. Multiple Global Navigation Satellite Systems (multi-GNSS) have already improved the
 availability of satellite signals, resulting in better satellite configurations (expressed in terms of
 Dilution of Precision, DOP) and thus in a higher positioning precision and accuracy (cf. Figure
 1). This important progress provides an opportunity to further explore the influences of urban
 environments.

 Various approaches are proposed to distinguish between direct Line-of-Sight (LOS) and NLOS
 signals. Kubo, et al. (2020) suggest a multipath detection using the signal strength in terms of
 the carrier-to-noise-density ratio (C/N0). If the C/N0 of a specific satellite signal is below a
 threshold, the satellite is not used for positioning for a pre-defined period of time. However,
 even if combining different GNSS, the number of direct LOS satellite rays may still be quite
 low in urban canyons (cf. Figure 2). Thus, instead of totally excluding observations from NLOS
 signals, these observations should also contribute to positioning solutions. One approach is to
 apply weights to NLOS signals, resulting into a reduction of influence on the positioning
 solution due to an expected lower reliability. Several stochastic models related to the observed
 C/N0 values and satellites elevations are already developed, e.g. SIGMA-ε model (Hartinger &
 Brunner, 1999), SIGMA-Δ model (Brunner, et al., 1999) and C/N0-Elevation model (Tay &
 Marais, 2013). However, these weighting schemes do not react dynamically on the
 environmental situation and depend on the antenna-receiver combination.

 Furthermore, the importance of 3D-map-aided (3DMA) approaches increases because of the
 possibility to enhance positioning results in urban canyons. A popular method is the Shadow
 Matching algorithm (Groves, 2011), in which the measured satellite visibility is compared with
 a predicted visibility using a building model. Therefore, the cross-street positioning accuracy
 in narrow streets can improve to metre-level, which is one order of magnitude better compared
 to conventional positioning methods. However, trees are not considered in the conventional
 Shadow Matching.

Improving Multi-GNSS Solutions with 3D Building Model and Tree Information (11028)
Anat Schaper, Qianwen Lin, Kim Sarah Janecki, Dennis Mußgnug, Max Heiken (Vimal Chawda, Lucy Icking,
Johannes Kröger and Steffen Schön (Germany)
FIG e-Working Week 2021
Smart Surveyors for Land and Water Management - Challenges in a New Reality
Virtually in the Netherlands, 21–25 June 2021
The main focus of this paper is to explore the possible influences of environmental information,
 a newly developed weighting scheme, on a multi-GNSS Single Point Positioning (SPP)
 algorithm for dense urban areas. For this purpose, 3DMA analyses are performed by utilising a
 building model and tree coordinates as environmental information.

 The paper is structured as follows: The data basis of this research is described in Section 2. In
 Section 3, the ray tracing implementation to distinguish between NLOS and LOS signals is
 presented with corresponding statistical analysis following. Section 4 focuses on the
 development of weighting schemes with useful environmental information for an SPP
 algorithm. The performance of these weighting models is further compared with some already
 established weighting schemes. Based on the previous research, conclusions are drawn in
 Section 5.

 Figure 1: Improved geometric dilution of precision Figure 2: Improved satellite visibility when using
 (GDOP) when using multi-GNSS. NLOS + LOS.

 2. DATA BASIS

 A kinematic experiment in an urban area was carried out to serve as GNSS data basis. To model
 the environment, a city model consisting of buildings and additional tree information is used
 and described in the following.

 2.1. Kinematic Experiment

 The used data was collected by a kinematic measurement in August 2020 in the Nordstadt, a
 district in the north of Hanover, starting nearby the Leibniz University Hanover. This district is
 well-known for its densely built-up area with small streets. The route led through narrow to
 medium width streets (approx. 5 to 18 metres) with four to five-story rows of houses on at least
 one side of the road. Especially the eastern part of the trajectory is characterised by extremely
 narrow streets and buildings with heights between 20 and 25 metres. For some parts of the
 trajectory, a dense tree-planting next to the road is present. The trajectory is driven 23 times
 whereby each round takes about seven minutes.

Improving Multi-GNSS Solutions with 3D Building Model and Tree Information (11028)
Anat Schaper, Qianwen Lin, Kim Sarah Janecki, Dennis Mußgnug, Max Heiken (Vimal Chawda, Lucy Icking,
Johannes Kröger and Steffen Schön (Germany)
FIG e-Working Week 2021
Smart Surveyors for Land and Water Management - Challenges in a New Reality
Virtually in the Netherlands, 21–25 June 2021

For the measurements, a Javad Omega receiver and a Septentrio PolaRx5e receiver were used,
 both connected to the same GNSS rover antenna (Javad GrAnt G5T) mounted on the rooftop
 of the van. Each receiver was recording GPS, GLONASS and Galileo code, phase, and Doppler
 observations as well as C/N0 with a sampling rate of 1 Hz. Additionally, a GNSS reference
 station on the rooftop of the Geodetic Institute Hanover is installed for the computation of a
 reference trajectory. Hereby, the post-processing software TerraPos 2.5.3 (Kjørsvik & Brøste,
 2009) is used.

 The resulting reference trajectory has a precision (95th percentile) of 6 and 8 cm in horizontal
 and vertical position, respectively. For a more descriptive representation, the global coordinates
 of the reference trajectory are transformed into a local topocentric coordinate system. The
 topocentre is approximately localised in the centre of the trajectory to minimise the effect of
 the Earth's curvature.

 Figure 3: IfE measurement van during the kinematic experiment. The antenna in use is circled in red.

 2.2. 3D City Model Extraction

 Building Model The 3D building model of the measurement area is provided by the geo-
 information department of Hanover (Landeshauptstadt Hannover, FB Planen und
 Stadtentwicklung - Bereich Geoinformation, 2020). Level of detail (LoD) 2 for the building
 model is used with a building height uncertainty of maximum ± 1 m and a position uncertainty
 in centimetre to decimetre range. In this model, the eaves and ridges are generalised in a
 standardised roof shape. The dataset consists of coordinates of the building corners, which are
 given in Universal Transverse Mercator (UTM) system and transformed into the local
 coordinate system.

 Tree Information Vegetation and non-static objects are not given in the building model as well
 as small constructions and areas in the allotments (Icking, 2019). However, the influence by
 tall trees with dense crowns cannot be neglected for checking the visibility of satellite rays.
 Therefore, sporadic tree information from Open Street Map (OSM) is included into the city
 model for the exploration of trees' influences. The coordinates of all given trees within a certain
 area are inserted into the local coordinate system. Since not all trees are mapped in OSM,
 supplementary real-time kinematic (RTK) measurements were included. Trees with roughly
 similar heights which are close to each other or not accessible are modelled as polyhedrons.

Improving Multi-GNSS Solutions with 3D Building Model and Tree Information (11028)
Anat Schaper, Qianwen Lin, Kim Sarah Janecki, Dennis Mußgnug, Max Heiken (Vimal Chawda, Lucy Icking,
Johannes Kröger and Steffen Schön (Germany)
FIG e-Working Week 2021
Smart Surveyors for Land and Water Management - Challenges in a New Reality
Virtually in the Netherlands, 21–25 June 2021
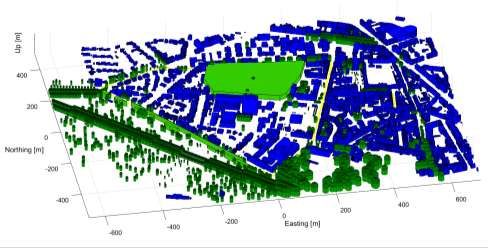
The city model data is gathered and shown in Figure 4. The tree points (dark green) are
 modelled with different radii and heights, and tree polyhedrons are given in light green. The
 buildings, consisting of wall and roof polygons are shown in blue. The yellow line indicates the
 measurement trajectory.

 Figure 4: Combined 3D city model, consisting of buildings (blue) and trees (green)
 with measurement trajectory (yellow).

 3. RAY-TRACER IMPLEMENTATION

 When tracking the rays from the satellites to the antenna, the visible rays are either LOS or
 NLOS, disturbed by the environmental surroundings of the antenna. Especially in urban areas,
 a large amount of NLOS rays can be detected due to the presence of dense and tall rows of
 buildings, trees, or other large obstacles, making the use of observations based on only LOS
 rays at some epochs impossible (cf. Figure 2). Moreover, these environmental factors have a
 non-negligible influence on GNSS positioning. For this purpose, this section examines which
 obstacles (i.e. buildings and trees) interfere with the rays in urban areas and to what extent.
 The main procedure of this implementation is divided into two general flows (cf. Figure 5).
 Firstly, the available rays composed of the positions of satellites and antenna are examined. It
 is checked whether they intersect with buildings. Secondly, possible intersections between rays
 and trees are computed.

 3.1. Building Intersection Test

 In order to determine whether a ray intersects a building, the ray is tested for an intersection
 with any of a building's polygon. Thus, the one-ray-one-polygon check must be executed for
 all rays and buildings.

 Step 1: Polygons Search Radius For each trajectory point, a searching circle is set up to only
 test intersections between visible rays of the selected trajectory point and polygons inside the
 circle. The searching radius r is a free parameter, aiming to pick out all polygons that have the
 possibility to intersect with the visible rays of this trajectory point. An example is shown in

Improving Multi-GNSS Solutions with 3D Building Model and Tree Information (11028)
Anat Schaper, Qianwen Lin, Kim Sarah Janecki, Dennis Mußgnug, Max Heiken (Vimal Chawda, Lucy Icking,
Johannes Kröger and Steffen Schön (Germany)
FIG e-Working Week 2021
Smart Surveyors for Land and Water Management - Challenges in a New Reality
Virtually in the Netherlands, 21–25 June 2021
Figure 6(a). A polygon is considered within the search radius if the 2D Euclidean distance
 between any point of the polygon and the selected trajectory point is smaller than the threshold
 r. For this paper, the environment dependent parameter r is chosen as 200 m. Besides, tall
 buildings with building heights larger than 30 m are included, which guarantees that the
 theoretical visibility of the satellite signals is not obstructed by extremely tall buildings.

 Figure 5: Process of Ray Tracer implementation.

 Step 2: Ray-Box Intersection This test aims to check whether the intersection point between a
 ray and a plane in which a polygon is located is inside the box. Our algorithm is similar to the
 algorithm proposed in Williams, et al. (2005) except that the boundaries of the box are not axis-
 aligned, but are defined by the minimum and maximum values of the topocentric coordinates
 of a polygon. Those polygons which do not intersect with the selected ray are eliminated in
 return. However, it is possible for a ray to intersect the box but to not actually intersect the
 polygon, like the green ray in Figure 6(b). Thus, for those polygons which are not eliminated,
 a Ray-Triangle intersection test is applied.

 Step 3: Ray-Triangle Intersection is an algorithm developed by Möller & Trumbore (1997).
 Based on this algorithm, the ray is considered as NLOS if any triangle of the polygon intersects
 with it, otherwise it is considered as LOS. The flowchart in Figure 7 shows the concrete process,
 checking whether a ray and a polygon intersect by three judgements.

 Step 4: Height Buffer It is necessary to consider the height accuracy (±1 m) of the building
 models under LoD2 after executing all ray-building intersections. Two new datasets, based on
 the original building data, are generated with the new datasets each shifted 0.5 meters in height.

Improving Multi-GNSS Solutions with 3D Building Model and Tree Information (11028)
Anat Schaper, Qianwen Lin, Kim Sarah Janecki, Dennis Mußgnug, Max Heiken (Vimal Chawda, Lucy Icking,
Johannes Kröger and Steffen Schön (Germany)
FIG e-Working Week 2021
Smart Surveyors for Land and Water Management - Challenges in a New Reality
Virtually in the Netherlands, 21–25 June 2021
(a) Polygon search radius for one trajectory point. (b) Example: Ray-Box intersection.
 Figure 6: Parts of Ray-Building intersection test.

 3.2. Tree Intersection Test

 For testing the intersections between rays and trees in the measurement area, a tree model is
 considered, which is a simple representation of a single tree. We call this model cylinder-dome
 model. Trunks are described by cylinders using measured heights and radii r, while crowns are
 represented by domes with the same r as the trunks. The mathematical idea behind the
 intersection is to estimate the minimum distance d between two skew lines. It is assumed that
 most of the intersections happen between the ray and somewhere inside the tree radius.
 Different cases for intersections (cf. Figure 8):
 1. The height of P is lower than the cylindrical height.
 2. The height of P is higher than the cylindrical height, but the satellite ray's distance from
 the dome's centre is smaller than the dome radius.
 3. d is shorter than r and P is underground, but the antenna is inside the cylinder.

 Figure 7: Process of Ray-Box Intersection.

 The results from building intersection and tree intersection are then combined, resulting in five
 categories: LOS, NLOS building, NLOS tree, NLOS building & tree and close call. Close calls
 result from different outcomes of the building intersection test after the application of the height
 buffer.

Improving Multi-GNSS Solutions with 3D Building Model and Tree Information (11028)
Anat Schaper, Qianwen Lin, Kim Sarah Janecki, Dennis Mußgnug, Max Heiken (Vimal Chawda, Lucy Icking,
Johannes Kröger and Steffen Schön (Germany)
FIG e-Working Week 2021
Smart Surveyors for Land and Water Management - Challenges in a New Reality
Virtually in the Netherlands, 21–25 June 2021
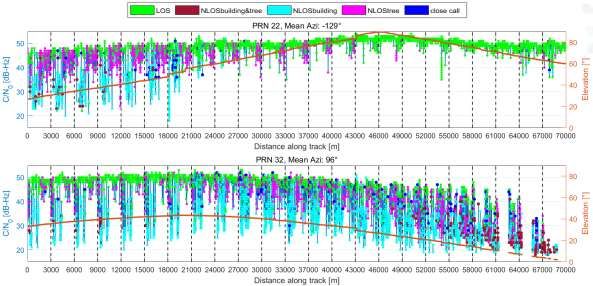
Figure 8: Graphical representation of the three intersection cases.

 3.3. Statistical Analysis of Ray Tracing Results

 Figure 9 shows the relationship between satellite elevations, signal strengths and the amount of
 LOS/NLOS rays. It contains the number of GPS, GLONASS and Galileo L1 code observations
 from the Septentrio receiver.

 Figure 9(a) includes all LOS and NLOS observations while Figure 9(b) shows only LOS
 observations, detected by the previously described ray tracer algorithm. It is clear that the vast
 majority of LOS observations has a consistently high C/N0 value across all elevation angles. In
 Figure 9(c) it can be seen that the C/N0 of observations obstructed by one or more trees exhibit
 an elevation dependence. Most of these tree NLOS observations are found at elevations < 45°.
 In Figure 9(d), the number of observations obstructed by at least one building is shown. The
 histogram shows that such observations exhibit a low signal-to-noise ratio independent from
 the elevation angle. Furthermore, disruptive buildings seem to appear most frequently at
 elevations less than 20°.

 The three different levels of signal strength seen in Figure 9(a) to (c) starting from approx. 55°
 elevation indicate the different nominal levels from different GNSS and satellite generations
 (Steigenberger & Montenbruck, 2017).

 In order to determine the influence of the LOS or NLOS rays on the signal behaviour, the GPS
 C/A signals of the Septentrio receiver are examined more closely. Therefore, PRN 22 with
 relatively high elevation angles (> 60°) and PRN 32 with relatively low elevation angles (< 40°)
 are selected, depicted in Figure 10. The figures describe the relation between the ray tracing
 results, the C/N0 values and the satellite elevation for 23 rounds driven.

 The LOS rays (green dots) always represent a strong signal strength (approx. > 40 dB-Hz) and
 are elevation dependent. NLOS rays describing a weak signal strength occur at low elevation
 angles. The lower the elevation angle, the more complicated situations arise, as shown by the
 first seven rounds for PRN 22 and all rounds of PRN 32. For PRN 32, especially in the second
 half of the measurement, the influence of trees on the signal strength increases, as it does for
 the close call rays. The signal strength reduced by trees is not so great compared to the signal
 interfered with buildings. Furthermore, drops in the C/N0 seem to appear at the same locations

Improving Multi-GNSS Solutions with 3D Building Model and Tree Information (11028)
Anat Schaper, Qianwen Lin, Kim Sarah Janecki, Dennis Mußgnug, Max Heiken (Vimal Chawda, Lucy Icking,
Johannes Kröger and Steffen Schön (Germany)
FIG e-Working Week 2021
Smart Surveyors for Land and Water Management - Challenges in a New Reality
Virtually in the Netherlands, 21–25 June 2021
when the elevation angle is low. This environmental dependent effect is analysed in detail in
 the following with two selected rounds and satellites.

 (a) All observations. (b) LOS only.

 (c) Tree NLOS only. (d) Building NLOS only.
 Figure 9: Relationship between number of observations, satellite elevations and signal strengths.

 Figure 10: Signal strength analysis of individual satellites.
 (a) Top: PRN 22. (b) Bottom: PRN 32.

Improving Multi-GNSS Solutions with 3D Building Model and Tree Information (11028)
Anat Schaper, Qianwen Lin, Kim Sarah Janecki, Dennis Mußgnug, Max Heiken (Vimal Chawda, Lucy Icking,
Johannes Kröger and Steffen Schön (Germany)
FIG e-Working Week 2021
Smart Surveyors for Land and Water Management - Challenges in a New Reality
Virtually in the Netherlands, 21–25 June 2021
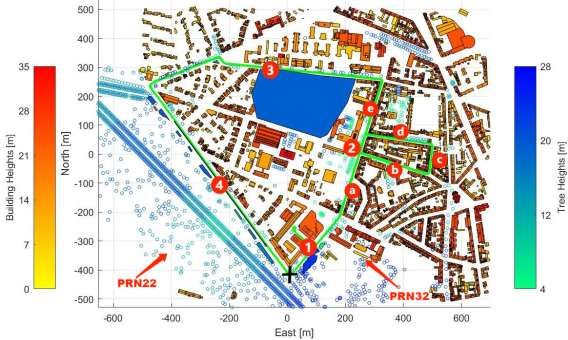
Figure 11(a) and (b) show the ray tracing results for PRN 22 and PRN 32 for round 7 and round
 1, respectively. Their mean azimuth angles are roughly perpendicular, as shown in Figure 12.
 The two satellites maintain stable elevations for both rounds, which indicates the variations of
 signal strength during those short time periods are less dependent on elevations, but more on
 the surroundings. The single round is split into four regions which are separated by black lines
 in both graphs in Figure 11 and described by four sections (1) to (4) in Figure 12. The trajectory
 follows an anti-clockwise direction from the start point, marked by a black cross.

 The condition of the rays is affected by the relation between the driving direction and the
 azimuth angles of satellites. For example, along the driving direction, the signal of PRN 22
 roughly follows the driving direction (cf. Figure 12), leading to a large amount of LOS rays in
 the first region (cf. Figure 11(a)). Whereas for PRN 32, the signal is transmitted from southeast
 which is interrupted by a large building and some single tall trees in the first region. Therefore,
 plenty of magenta dots representing NLOS due to trees appear in the graph of PRN 32 (cf.
 Figure 11(b)).

 Since there are much more dense tall buildings and trees in the second region, this region is
 subdivided into five short paths (a) to (e) following the driving direction in Figure 12, and
 distinguished by dashed lines in Figure 11. The changes of PRN 32 for these five segments are
 the most obvious, with NLOS building rays (cyan dots) in the first, third and last segment, and
 LOS rays (green dots) in the second and fourth segment.

 This can be explained by the relation between the driving direction and azimuth angle of the
 satellite, too. One difference for PRN 22 is that there are close call rays (blue dots) mixed with
 NLOS building rays (cyan dots) from segment (b) to (d). This is because the satellite locates at
 relatively high elevations which are close to the roofs of buildings, generating more
 uncertainties for the visibility of rays.

 Figure 11: Signal strength analysis of specific rounds.
 (a) Top: round 7 for PRN 22. (b) Bottom: round 1 for PRN 32.

Improving Multi-GNSS Solutions with 3D Building Model and Tree Information (11028)
Anat Schaper, Qianwen Lin, Kim Sarah Janecki, Dennis Mußgnug, Max Heiken (Vimal Chawda, Lucy Icking,
Johannes Kröger and Steffen Schön (Germany)
FIG e-Working Week 2021
Smart Surveyors for Land and Water Management - Challenges in a New Reality
Virtually in the Netherlands, 21–25 June 2021
4. ADAPTED SPP WEIGHTING SCHEME

 4.1. Single Point Positioning Algorithm (SPP)

 SPP can be considered as the classical way of absolute GNSS positioning (Seeber, 2008). The
 L1 pseudo-range code observations to GNSS satellites with known positions are combined in a
 least squares sense to obtain the 3D receiver coordinates as well as the receiver clock error of
 each epoch independently. Due to the different receiver hardware biases per system
 (intersystem bias), separate receiver clock errors are estimated for GPS, GLONASS and Galileo
 observations. Since no error source cancels out due to the observation strategy in SPP, it is
 necessary to reduce the error influences on the observations prior to the adjustment. For this
 research, the OMC (observed minus computed) observations are used. There, the atmospheric
 and relativistic effects are already accounted and greatly reduced by correction models.

 4.2. Common Weighting Schemes

 In the non-linear Gauß-Markov adjustment, the influence of individual observations on the
 resulting parameters can be controlled by applying weights. The naive approach is to apply the
 same unit weight to every observation. This is conducted as a baseline solution.
 Another simple weighting scheme is the elevation dependent weighting:
 = 1⁄ 2 = sin( )2 (1)
 It is assumed that signals from satellites at low elevations pass a longer way through the
 atmosphere, making the atmospheric effects larger, harder to model and thus being more prone
 to errors.

 Figure 12: 2D rendered buildings and trees.

Improving Multi-GNSS Solutions with 3D Building Model and Tree Information (11028)
Anat Schaper, Qianwen Lin, Kim Sarah Janecki, Dennis Mußgnug, Max Heiken (Vimal Chawda, Lucy Icking,
Johannes Kröger and Steffen Schön (Germany)
FIG e-Working Week 2021
Smart Surveyors for Land and Water Management - Challenges in a New Reality
Virtually in the Netherlands, 21–25 June 2021
A third method for observation weighting is a weighting scheme depending on the signal-to-
 noise ratio C/N0 (Wieser & Brunner, 2000), aiming to reduce signal disturbances based on the
 observation quality itself:
 / 0
 ∼ 10 10 (2)

 4.3. Extension of Common Weighting Schemes by the Environmental Factor

 Our approach is to use the environmental information regarding LOS and NLOS in the
 weighting of the observations. Observations that are NLOS are expected to be perturbed in
 some way, lowering their expected reliability. Thus, they should have a reduced influence on
 the positioning solution. Three disjoint categories of NLOS observations will be distinguished:

 1. Observations intersecting at least one building (and potentially trees, too).
 2. Observations intersecting one or more individual trees.
 3. Observations intersecting only a tree polyhedron.

 Tree polyhedrons are considered separately, since we expect a larger number of false positives
 in that category. Each of these categories will be assigned a weight, which is multiplied with
 the base weight. The environmental factor for LOS rays is 1.

 To find the appropriate 3-tuple of weights for NLOS signals, a Monte Carlo simulation is
 performed targeting to reduce the coordinate differences to the reference trajectory. The SPP of
 the whole trajectory is calculated using 1000 different combinations of weights each ranging
 from 10-2.5 to 100.5. The 99th percentile of the deviations is used as metric for the performance
 of the 3-tuple. The best parameter combinations are listed in Table 1.

 First, the environmental weighting is attempted without the help of a base weighting scheme.
 The optimal weight for building NLOS observations appears to be p = 0.02. The optimal
 weights for tree and tree polyhedron observations are 0.2 and 0.8, respectively.

 Second, the environmental weights are multiplied with the previously described elevation
 dependent weighting. This means that building NLOS observations are already down weighted
 since buildings generally occur at low elevations. Thus, the environmental weighting will not
 be as low. The optimal weight for building NLOS observations p = 0.065 is higher compared
 to the extended unity weighting scheme. The tree and tree polyhedron weights are indecisive.
 Weights of 0.8 and 0.9 respectively seem to be appropriate.

 Third, when using the C/N0 dependent weighting as base weighting scheme, the Monte Carlo
 search leads to an ideal weight for building NLOS observations of exactly 1. Thus, no additional
 improvement can be achieved by using environmental information. Again, the tree and tree
 polyhedron weights are indecisive. Weights close to 1 seem to be ideal.

Improving Multi-GNSS Solutions with 3D Building Model and Tree Information (11028)
Anat Schaper, Qianwen Lin, Kim Sarah Janecki, Dennis Mußgnug, Max Heiken (Vimal Chawda, Lucy Icking,
Johannes Kröger and Steffen Schön (Germany)
FIG e-Working Week 2021
Smart Surveyors for Land and Water Management - Challenges in a New Reality
Virtually in the Netherlands, 21–25 June 2021
Table 1: Environmental parameters for building NLOS, tree NLOS and tree polyhedron NLOS.
 Unit Elevation C/N0
 Building NLOS 0.02 0.065 1
 Tree NLOS 0.2 0.8 ~1
 Tree polyhedron NLOS 0.8 0.9 ~1

 4.4. Weighting Scheme Comparison

 In general, it is clear for all weighting models that the positioning results in the densely built-
 up eastern part of the trajectory are significantly worse than along the alley in the southwest
 (section (4) in Figure 12) with buildings on only one side of the road. For the weighting models
 without the environmental factors, there are considerable improvements in precision in the
 eastern part (section (2) in Figure 12) for the C/N0 dependent weighting compared to the unit
 weighting model. Principally, there are fewer epochs with large deviations > 10 m from the
 reference trajectory. Figure 13 shows the cumulative distribution of the deviations.

 For the unit and elevation dependent weighting scheme, it becomes clear that the environmental
 weighting provides an advantage with regard to the deviation. For the unit weighting as well as
 for the elevation dependent weighting, a reduced deviation from the reference trajectory by
 55.3% and 58.7% in the 95% quantile, respectively, can be observed when extending the
 conventional weighting schemes with environmental factors. Especially in the densely built-up
 eastern part (section (2) in Figure 12), the deviations are smaller. However, the wider alleys
 (e.g. in the south, section (4) in Figure 12) also benefit from the environment dependent
 weighting. Additionally, it can be seen that the C/N0 dependent weighting (Figure 13, yellow
 curve) shows the smallest deviations from the reference trajectory for all quantile values.

 In summary, it can be stated that it makes sense to use a weighting model with additional
 environmental factors in order to improve the accuracy of the positioning solution. In general,
 the advantage of using a weighting model considering environmental factors is that the different
 nominal levels of the C/N0 do not have to be considered. Thus, the environmental weighting is
 applicable to every GNSS and receiver and is able to react dynamically on the environmental
 situation.

 Figure 13: Cumulative distribution of the 3D Euclidean distances between reference trajectory and
 SPP solution using different weighting schemes.

Improving Multi-GNSS Solutions with 3D Building Model and Tree Information (11028)
Anat Schaper, Qianwen Lin, Kim Sarah Janecki, Dennis Mußgnug, Max Heiken (Vimal Chawda, Lucy Icking,
Johannes Kröger and Steffen Schön (Germany)
FIG e-Working Week 2021
Smart Surveyors for Land and Water Management - Challenges in a New Reality
Virtually in the Netherlands, 21–25 June 2021
5. CONCLUSION

 We presented adapted weighting models applied to a multi-GNSS single point positioning
 algorithm incorporating environmental information. To this end, a kinematic experiment was
 conducted in a densely built-up area, characterised by narrow streets and dense tree-planting
 close to the roads. Already established 3D-map-aided analyses are extended by using tree
 coordinates as additional information.

 A ray tracing algorithm is firstly used to judge whether visible GNSS rays are LOS or blocked
 by large obstacles (here: buildings and trees) in the urban area, with results depending on
 multiple factors. The higher the satellite elevations are, the more LOS rays are present. In return,
 the lower the elevations are, the more complicated situations exist with numerous different
 kinds of NLOS rays. Furthermore, LOS rays are more likely to appear when the azimuth angles
 of satellites roughly coincide with the driving direction. Otherwise, the signals are mostly
 obstructed by surrounding buildings and trees. This can be considered as a highly location
 dependent and therefore repeatable factor, relying on the heights and densities of surrounding
 large obstacles. Moreover, the ray tracing results will affect the signal strength in return. The
 signals related to LOS rays always possess the strongest strength, with next in order NLOS trees
 only, NLOS buildings only and NLOS common. The influence of trees is much more subtle
 and might be more noticeable when investigating positioning using carrier phase measurements.
 Overall, the statistical analysis of this environmental information is an effective approach to
 support the development of weighting schemes for positioning calculations.

 The achievable improvement using environmental information for an SPP solution depends on
 the prior available information that can be used for weighting. While a large improvement can
 be achieved compared to unit weighting or elevation dependent weighting, a more sophisticated
 weighting like the signal strength dependent weighting scheme already models these influences
 sufficiently and cannot be outperformed by the extended methods considering the environment.
 Additionally, the environmental information is essentially binary (per category), while the
 signal-to-noise ratio is continuous, hinting at the reason of its better performance.
 In summary, comparable accuracies to carrier-to-noise density dependent weighting can be
 achieved when extending the weighting schemes using environmental information. For the unit
 and elevation dependent weighting, an enhancement of nearly 60% for the quantile of 95% can
 be observed.

 REFERENCES

 Brunner, F. K., Hartinger, H. & Troyer, L., 1999. GPS Signal Diffraction Modelling: The
 Stochastic SIGMA-Δ Model. Journal of Geodesy, Volume 73, pp. 259-267.
 Drevelle, V. & Bonnifait, P., 2011. Global Positioning in Urban Areas with 3-D Maps. Baden-
 Baden, Germany, IEEE Intelligent Vehicles Symposium (IV 2011), pp. 764-769.
 Groves, P. D., 2011. Shadow Matching: A New GNSS Positioning Technique for Urban
 Canyons. The Journal of Navigation, Volume 64, pp. 417-430.

Improving Multi-GNSS Solutions with 3D Building Model and Tree Information (11028)
Anat Schaper, Qianwen Lin, Kim Sarah Janecki, Dennis Mußgnug, Max Heiken (Vimal Chawda, Lucy Icking,
Johannes Kröger and Steffen Schön (Germany)
FIG e-Working Week 2021
Smart Surveyors for Land and Water Management - Challenges in a New Reality
Virtually in the Netherlands, 21–25 June 2021
Hartinger, H. & Brunner, F. K., 1999. Variances of GPS Phase Observations: The Sigma-ε
 Model. GPS Solutions, Volume 2, pp. 35-43.
 Icking, L., 2019. Evaluating the Urban Trench Model for Improved GNSS Positioning in Urban
 Areas. Master Thesis. Leibniz Universität Hannover, Institut für Erdmessung.
 Icking, L., Kersten, T. & Schön, S., 2020. Evaluating The Urban Trench Model For Improving
 GNSS Positioning in Urban Areas. IEEE/ION Position, Location and Navigation Symposium
 (PLANS), pp. 631-638.
 Kjørsvik, N. & Brøste, E., 2009. Using TerraPOS for efficient and accurate marine positioning.
 TerraTec AS, Lysaker.
 Kubo, N., Kobayashi, K. & Furukawa, R., 2020. GNSS Multipath Detection Using Continuous
 Time-Series C/N0. Sensors, Volume 14.
 Landeshauptstadt Hannover, FB Planen und Stadtentwicklung - Bereich Geoinformation, 2020.
 Hannover: Produktinformation Digitales 3D-Stadtmodell.
 Möller, T. & Trumbore, B., 1997. Fast, Minimum Storage Ray-Triangle Intersection. Journal
 of graphic tools, Volume 2.1, pp. 21-28.
 Seeber, G., 2008. Satellite Geodesy. 2. ed. Berlin, New York: De Gruyter.
 Steigenberger, P. & Montenbruck, O., 2017. Galileo Status: Orbits, Clocks, and Positioning.
 GPS Solutions, Volume 21, pp. 319-331.
 Tay, S. & Marais, J., 2013. Weighting Models for GPS Pseudorange Observations for Land
 Transportation in Urban Canyons. 6th European Workshop on GNSS Signals and Signal
 Processing, Munich.
 Wieser, A. & Brunner, F. K., 2000. An extended weight model for GPS phase observations.
 Earth, Planets and Space, Volume 52, pp. 777-782.
 Williams, A., Steve, B., Morley, R. & Shirley, P., 2005. An Efficient and Robust Ray-Box
 Intersection Algorithm. Journal of Graphics Tools, Volume 10, pp. 49-54.

 CONTACTS

 Prof. Dr.-Ing. Steffen Schön
 Institut für Erdmessung
 Schneiderberg 50
 30167 Hannover
 GERMANY
 Tel. +49511 762 3397
 Email: schoen@ife.uni-hannover.de
 Web site: www.ife.uni-hannover.de

Improving Multi-GNSS Solutions with 3D Building Model and Tree Information (11028)
Anat Schaper, Qianwen Lin, Kim Sarah Janecki, Dennis Mußgnug, Max Heiken (Vimal Chawda, Lucy Icking,
Johannes Kröger and Steffen Schön (Germany)
FIG e-Working Week 2021
Smart Surveyors for Land and Water Management - Challenges in a New Reality
Virtually in the Netherlands, 21–25 June 2021
You can also read