The signatures of tectonics and glacial isostatic adjustment revealed by the strain rate in Europe
←
→
Page content transcription
If your browser does not render page correctly, please read the page content below
Geophys. J. Int. (2004) 157, 865–870                                                                             doi: 10.1111/j.1365-246X.2004.02275.x

FA S T T R A C K PA P E R

The signatures of tectonics and glacial isostatic adjustment revealed
by the strain rate in Europe

Anna Maria Marotta and Roberto Sabadini
Geophysics Section, Department of Earth Sciences, University of Milan, L. Cicognara, 7 I-20129 Milan, Italy. E-mail: anna.maria.marotta@unimi.it

Accepted 2004 February 25. Received 2003 December 1; in original form 2003 July 2

                                        SUMMARY
                                        Tectonics and glacial isostatic adjustment (GIA) are simultaneously taken into account in
                                        order to quantitatively define their role in crustal deformation in Europe. A spherical finite-
                                        element model, based on the thin viscous shell approach and suitable for predicting tectonic
                                        deformation, and a spherical stratified viscoelastic Earth model, based on the normal mode
                                        approach to quantifying the effects of GIA, are used to predict intraplate deformation in
                                        Europe. Model predictions are compared with the geodetic strain rate obtained from ITRF2000
                                        velocity solutions. Our results confirm that both geophysical processes influence intraplate
                                        deformation in Europe, with tectonics playing the leading role south of Potsdam and GIA
                                        being the only mechanism north of Onsala. Both geophysical processes affect the deformation

                                                                                                                                                          GJI Tectonics and geodynamics
                                        at intermediate latitudes, where the contributions to the deformation coming from tectonics
                                        and GIA are of the same magnitude and the combined tectonic plus GIA model succeeds in
                                        reproducing the eigendirections of the local predominantly SSW–NNE directed compression.
                                        The stiffening in the East European Platform is crucial for shielding the northeastern regions
                                        from the compressional effects of Africa–Eurasia convergence and to allow SE–NW directed
                                        extension in Fennoscandia driven by GIA.
                                        Key words: glacial isostatic adjustment, strain rate, tectonics.

                                                                               already been made by Marotta & Sabadini (2002). However, that
1 I N T RO D U C T I O N
                                                                               study had some limitations, such as a limited extension of the study
Africa–Eurasia convergence and GIA are major geophysical pro-                  domain which did not include Fennoscandia, where the effect of
cesses in Europe: their signatures can now be revealed by means of             GIA is expected to be the largest; furthermore, it was a 1-D analysis
geodetic deformation patterns obtained from the ITRF2000 network               since the predicted and the observed crustal deformation were com-
covering the whole of Europe. Since ITRF2000 velocity solutions                pared along baselines connecting pairs of geodetic sites; finally, the
hold both tectonic and GIA information, a comparison between the               two mechanisms were still analysed separately. The present study
strain rates from geophysical modelling and the geodetic observa-              differs from this previous analysis in several aspects. First of all, it
tions from ITRF2000 permits us to discriminate among different                 uses a 2-D approach within a wider region, by analysing the defor-
tectonic hypotheses and, in particular, to reveal how plates interact          mation within triangular regions bounded by the lines connecting
in a wide region from northern Europe to the Mediterranean and                 three geodetic sites. The quantitative comparison of the predicted
from the Iberian Peninsula to the Aegean Sea and Anatolia. In re-              crustal deformation obtained by the combined tectonic plus GIA
cent years several authors have focused on the effects on intraplate           model and geodetic data will be discussed.
deformation of GIA at high latitudes (e.g. Milne et al. 2001) and
of tectonics in central and southern Europe (e.g. Golke & Coblentz
                                                                               2 TECTONIC MODEL
1996; Marotta et al. 2001) but solely speculative hypotheses about
the concurrent role of both mechanisms on the strain field have been           We adopt an incompressible, viscous model to investigate tectonic
proposed. The published literature thus lacks any quantitative study           deformation in Europe driven by Africa–Eurasia convergence and
in which the effects of both mechanisms are compared, to support               mid-Atlantic ridge opening (Fig. 1). The deformation field is com-
the reliability of these hypotheses. This study aims to make a sig-            puted using the numerical approach described in detail in Marotta
nificant contribution in this direction, since for the first time crustal      et al. (2001), adapted to take into account the sphericity of the
deformation in Europe is predicted by taking into account the cu-              Earth. The lithosphere is modelled as a stratified viscous shell with
mulative effects of tectonics and GIA. A first attempt at this has             a constant total thickness overlying an inviscid asthenosphere. The


C   2004 RAS                                                                                                                                       865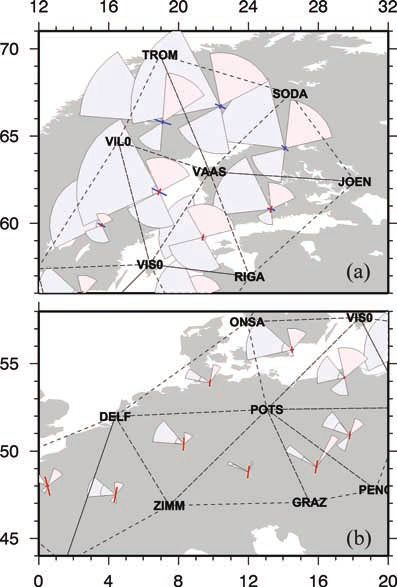
866      A. M. Marotta and R. Sabadini

Figure 1. Finite-element grid and boundary conditions for the area under study. The grid distinguishes three major blocks, or subdomains: the European, East
European Platform and Mediterranean. The thick yellow arrows at the left and top sides of the domain represent ridge push forces. The counter-clockwise
rotation of the African Plate with respect to the European Plate, adopted from NUVEL-1A, and the geodetically determined velocities along the Aegean Trench
McClusky et al. (2000) is reflected by the red arrows at bottom left. The southern border between the model domain and the Arabian region is held fixed (red
triangles), while the right (eastern) boundary of the model is assumed to be shear stress free (red dots).

western and the northern borders of the model domain coincide with               where u θ and u φ are the components of the velocity along the co-
the location of the mid-Atlantic ridge, while the southern border co-            latitude θ and longitude φ, respectively. µ̄ denotes the vertically
incides with the Africa–Eurasia plate contact. The eastern border of             averaged viscosity of the lithosphere, S and L are the crustal and
the model domain lies along the 45◦ E meridian, inside the intracra-             lithosphere thickness respectively while ρ c and ρ m denote their uni-
tonic East European Platform, where the level of stress from the                 form densities of 2800 and 3200 kg m−3 , respectively. g denotes
applied boundary velocity is expected to be small. The domain is                 the acceleration due to gravity while R represents the mean Earth
discretized using planar triangular elements which are sufficiently              radius. The radial velocity u r is eliminated from these equations by
small in size (2◦ × 2◦ being the maximum extension in the west-                  invoking incompressibility and by assuming that the radial strain
ern oceanic portion of the domain) to justify treating the surface               rate ∂u r /∂r vanishes. Under these assumptions, u r can be expressed
of each individual grid element as flat. The governing equations                 as

(eqs (2) in Marotta et al. 2001), take the following form in spherical                    1 ∂u θ        1 ∂u φ
coordinates and a stationary regime:                                             ur = −            +             + u θ cot gθ .                     (3)
                                                                                          2 ∂θ        sin θ ∂φ

 ∂          ∂u θ              1 ∂            1 ∂u θ      ∂u φ
      2µ̄         + ur +               µ̄             +                             Thus, the thin shell model is a reliable predictor of the horizon-
∂θ           ∂θ             sin θ ∂φ       sin θ ∂φ       ∂θ
                                                                           tal components of the velocity field u θ , u φ only. The major forces
                             ∂u θ      1 ∂u φ
   − u φ cot gθ     + 2µ̄         −             − u θ cot gθ cot gθ              acting on the system are the horizontal tectonic push from Africa–
                             ∂θ      sin θ ∂φ                                    Eurasia convergence and mid-Atlantic spreading, and the horizontal
                       2
       gρc R         ρc ∂ S                                                      stresses controlled by the horizontal variations in crustal thickness.
   =            1−                                                 (1)
                                                                                 As a consequence of the latter assumption, the model is a reliable
        2L          ρm ∂θ
                                                                                 predictor of horizontal components of strain rate only. Once the

 ∂          1 ∂u θ       ∂u φ                                                    crustal thickness S and the boundary conditions are specified, the
     µ̄               +       − u φ cot gθ                                       numerical integration of eqs (1) and (2) yields the stationary 2-D
∂θ        sin θ ∂φ        ∂θ
                                                                             tectonic velocity field. A distinct viscosity can be applied to each
        1 ∂               1 ∂u φ
   +             2µ̄              + u θ cot gθ + u r                             element of the model grid and this permits incorporation of lateral
     sin θ ∂φ           sin θ ∂φ
                                                                             variations in lithospheric strength. With respect to this aspect, we
             ∂u φ       1 ∂u θ                                                   consider three types of tectonic model in which the European litho-
   + 2µ̄          +              − u φ cot gθ cot gθ
              ∂θ      sin θ ∂φ                                                   sphere is treated as the reference domain where a viscosity of 1025

      gρc R          ρc      1 ∂ S2                                              Pa s is prescribed (Fig. 1). In the Mediterranean domain, extending
   =           1−                                                      (2)
        2L          ρm sin θ ∂φ                                                  from the Tyrrhenian Sea to the eastern limit of the Pannonian Basin


                                                                                                                           C   2004 RAS, GJI, 157, 865–870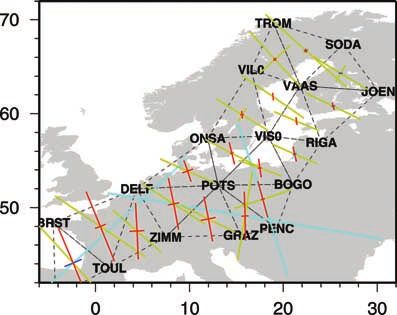
Tectonics and GIA in Europe            867

Table 1. Tectonic models considered in the analysis.                       corresponding ones obtained from the ITRF2000 velocity solutions.
Model         Rheological heterogeneities            Ridge boundary        Particular care is devoted to defining the final set of triangular do-
                                                   conditions (mm yr−1 )   mains where the analysis is applied. Although several criteria could
                                                                           be followed for choosing the triangulation, we adopt a combina-
1             No rheological heterogeneities               5.0
                                                                           tion of geometric and reliability criteria. We first select the subset
2             No rheological heterogeneities               0.0
3             Stiff East European Platform                 5.0
                                                                           of sites uniformly distributed through the study area in which the
4             Stiff East European Platform                 0.0             velocity is known with the lowest variance, and then we adopt the
                                                                           triangulation which is most representative of homogeneous tectonic
                                                                           units. Within each triangular domain the strain-rate eigenvalues ˙1
                                                                           and ˙2 with the azimuth for the component ˙2 , both for data and
through the Adriatic Plate, the viscosity has been reduced by one          model predictions, are computed following the procedure described
order of magnitude with respect to the reference viscosity, to simu-       in Devoti et al. (2002). Table 2 lists the values of strain-rate eigen-
late the softening of the basin. The viscosity of the East European        values and of the azimuth, with the corresponding errors, computed
Platform, which encompasses most of the Caledonian Deformation             for ITRF2000 velocity solutions. The ITRF2000 solutions indicate
Front, is increased by two orders of magnitude to reproduce the stiff      a general pattern of SE–NW directed extension and SW–NE di-
Baltic Shield. The velocity boundary conditions are considered as          rected compression, both at low and high latitude. However, in the
fixed relative to the Eurasia Plate: the Africa–Eurasia continental        Fennoscandia region the ratio between extension and compression
convergence of the order of 1 cm yr−1 (southern boundary of the            is significantly higher then in Central Europe. Another feature that
model domain to about 20◦ N) is prescribed by NUVEL-1A (red ar-            is worth highlighting is the large uncertainties in strain-rate predic-
rows, Fig. 1). With respect to a fixed Eurasia, we must consider the       tions at high latitudes, both in magnitude and in direction, making
ridge push forces along the North Atlantic Ridge. In our simulations,      the SW–NE compression meaningless. Since the tectonic and GIA
the ridge push forces are parametrized in terms of velocity bound-         models, taken separately, show the tendency to underestimate the ob-
ary conditions applied along the ridge (thick yellow arrows), thus         served strain rates, direct comparison between data and prediction
simulating the line forces acting along the plate boundary, as shown       is carried out only in Fig. 5 (see later), where the combined effects
in Richardson et al. (1979), ranging from 1012 N m−1 for a velocity        of the best performing tectonic and GIA models are considered.
of about 1 mm yr−1 , to 1013 N m−1 for 5 mm yr−1 , this last value            Fig. 2 shows the results of tectonic models 1 and 2. Except for
representing an upper bound for ridge push forces (Richardson &            POTS–PENC–BOGO and POTS–GRAZ–PENC where extension
Reding 1991). These velocities, which are used to parametrize the          dominates (cyan bars), model 1 predicts SE–NW compression (yel-
ridge push forces, are not constant along the ridge but are scaled with    low bars) due to the combined effects of Africa–Eurasia conver-
respect to the spreading rates deduced from NUVEL-1A. Along the            gence and Atlantic Ridge spreading. The dominant extension in
Aegean Trench the velocity boundary conditions are obtained from           the triangle POTS–GRAZ–PENC has already been noted along the
McClusky et al. (2000) and reflect trench subduction forces. The           baseline POTS–PENC in Marotta & Sabadini (2002), where it has
eastern boundary of the model domain is fixed, in agreement with           been attributed to the lateral extrusion induced by the Alpine Front.
the hypothesis that we are considering Eurasia as fixed; since we are      The striking result of model 1 is that the modelled compression
not interested in the deformation occurring east of the considered         is at right angles with respect to the observed one. The two trian-
ITRF2000 network, we assume that east of longitude 50◦ the study           gles quoted above are the only ones in which we obtain complete
domain is closed; in order to avoid too large an effect from artificial    agreement, in terms of extensional eigendirections and eigenvalues,
stress accumulation due to the closed eastern boundary we have im-         between modelling results and observations. Another major prob-
posed a condition of freedom from shear stress, as indicated by the        lem with model 1 is that north of VIS0 the ITRF2000 data indicate
red dots along the right boundary of the model. The conditions along       extension, while the model predicts a dominant compression. This
our eastern boundary account for a possible decoupling between the         inconsistency suggests that the effects of ridge push are too large
western and eastern parts of the Eurasia Plate (Molnar et al. 1973)        and this reduction could reduce the misfit. This hypothesis has been
and imply that we are assuming that all the intraplate deformation of      tested by considering the end-member model 2, in which no ridge
Eurasia due to Africa–Eurasia convergence and Atlantic Ridge push          push is considered. This extreme case implicitly assumes that the
takes place within the studied domain. The contact between the East        deformation due to ridge push takes place in that part of the domain
European Platform and the Arabian Plate is held fixed, as indicated        between the ridge and the study area. As expected, in model 2 the
by the red triangles in the southeast part of Fig. 1. NUVEL-1A indi-       previous disagreement between data and prediction is significantly
cates a northward-directed velocity on this boundary. However, as          reduced, with compression becoming negligible at high latitudes
discussed by Jimenez-Munt & Sabadini (2002), the local stiffness of        (red bars) and subject to a clockwise rotation in central Europe. The
the lithosphere and the existence of a transcurrent fault at the north-    introduction of rheological heterogeneities in the tectonic model is
ern boundary of the Arabian Plate produce little long-wavelength           crucial in our search for the best fit model (Fig. 3). When a velocity
deformation to the north, where the ITRF2000 sites are located. The        boundary condition of 5.0 mm yr−1 is prescribed along the Atlantic
variation in crustal thickness used in the analysis has been obtained      Ridge, we note a substantial modification in the strain-rate patterns
by linear interpolation onto the adopted grid of the model CRUST           north of the line connecting DELF to BOGO, where compression
2.0 (Bassin et al. 2000; http://mahi.ucsd.edu/Gabi/rem.html).              is reduced with respect to Fig. 2 (yellow bars) and SSW–NNE ex-
Table 1 summarizes the characteristics of the tectonic models.             tension appears. The reduction of compression in the stiff Baltic
                                                                           Shield and south of it is easily understood in terms of the reduced
                                                                           flow within the high-viscosity region, which acts as a barrier that
3 R E S U LT S A N D D I S C U S S I O N
                                                                           annihilates the propagation of the velocity driven by Africa–Eurasia
In this section we discuss the results of our analysis in terms of         convergence and Atlantic Ridge push within the Baltic Shield. When
strain-rate eigenvalues and eigendirections, computed for a set of         zero-velocity boundary conditions are assumed along the western
triangular domains covering the study area and compared with the           boundary (model 4), the ridge push effects disappear everywhere,


C   2004 RAS, GJI, 157, 865–870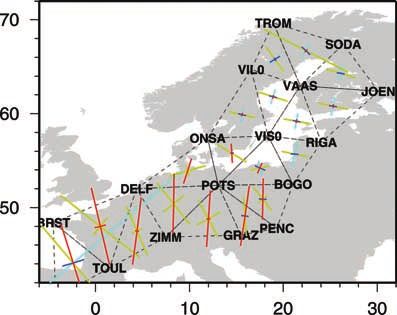
868      A. M. Marotta and R. Sabadini

              Table 2. Observed strain rates as deduced from ITRF2000 GPS data.
              Triangle                                   Eigenvalue                     Eigenvalue                           Azimuth
                                                              ˙1                             ˙2                               of ˙2
                                                      (nanostrain yr−1 )             (nanostrain yr−1 )                       (deg)
              TOUL–ZIMM–DELF                            +3.20 ± 1.38                  −2.66 ± 1.46                        +56.22 ± 9.40
              MADR–TOUL–BRST                            +7.55 ± 0.52                  −1.50 ± 1.43                        +11.80 ± 4.53
              POTS–DELF–ZIMM                            +7.76 ± 0.77                  −0.17 ± 0.89                        +26.49 ± 5.69
              POTS–ZIMM–GRAZ                            −0.29 ± 0.96                  −3.00 ± 2.83                        −44.26 ± 32.70
              POTS–GRAZ–PENC                            +4.19 ± 1.48                  −2.49 ± 2.21                        +27.91 ± 8.53
              POTS–PENC–BOGO                            +4.42 ± 3.83                  −2.48 ± 2.01                        +28.30 ± 17.55
              POTS–BOGO–VIS0                            +5.77 ± 2.07                  −4.96 ± 5.87                        +32.49 ± 16.58
              POTS–VIS0–ONSA                            +5.26 ± 1.54                  −0.25 ± 2.42                        +35.85 ± 12.95
              POTS–ONSA–DELF                            +3.91 ± 1.87                  −1.36 ± 1.49                        +19.31 ± 14.96
              VIS0–BOGO–RIGA                            +6.43 ± 2.91                  −1.69 ± 2.62                        +14.82 ± 25.53
              TOUL–DELF–BRST                            +3.98 ± 1.90                  −2.48 ± 3.80                        +25.12 ± 19.47
              VIS0–RIGA–VAAS                           +10.26 ± 0.79                  +0.19 ± 0.62                        +19.02 ± 3.52
              RIGA–JOEN–VAAS                            +6.62 ± 2.51                  +0.68 ± 2.75                        +20.75 ± 20.21
              VAAS–JOEN–SODA                            +5.25 ± 3.00                  −1.62 ± 2.28                        +18.12 ± 16.69
              VAAS–TROM–VIL0                            +6.58 ± 5.79                  −0.22 ± 1.63                        +33.99 ± 25.91
              VAAS–SODA–TROM                            +8.34 ± 6.03                  −1.61 ± 1.96                        +41.64 ± 17.69
              ONSA–VIS0–VIL0                            +9.98 ± 0.86                  −0.71 ± 0.83                        +25.63 ± 3.11
              VIS0–VAAS–VIL0                            +9.41 ± 0.84                  −2.30 ± 0.89                        +30.85 ± 2.48

Figure 2. Directions of the strain-rate eigenvectors predicted by tectonic   Figure 3. Directions of the strain-rate eigenvectors predicted by tectonic
models 1 (cyan extension; yellow compression) and 2 (blue extension; red     models 3 (cyan extension; yellow compression) and 4 (blue extension; red
compression).                                                                compression).

leaving space for the Africa indenter and to an increase in com-             thick lithosphere of 1025 Pa s is considered, as in the tectonic model.
pression with respect to Fig. 2 (red bars). A significant rotation of        GIA21 predicts SE–NW extension in Fennoscandia (blue bars), in
the compressive eigendirections from NNW to NNE occurs south                 agreement with the geodetic data, and negligible SE–NW compres-
of Potsdam, in agreement with ITRF2000 data. Due to the stiffen-             sion in the south (red bars). A peculiar situation is visible south of
ing of the Baltic Shield, the compressive effects of Africa–Eurasia          VIS0 and north of POTS, where GIA21 predicts a SSE–NNW com-
push almost disappear north of VIS0, supporting the hypothesis that          pression comparable in magnitude to that induced by the tectonic
another geophysical process must be invoked to explain the large             model characterized by the stiff Baltic Shield, with no ridge push:
SE–NW extension. Previous works (Milne et al. 2001; Marotta &                Figs 3 and 4 thus suggest that both tectonics and GIA contribute
Sabadini 2002) have shown that GIA is the dominant mechanism                 to the compression in the range of latitudes of 52◦ and 58◦ , in the
in Fennoscandia. In the following figures, the impact of GIA is              region between Fennoscandia and central continental Europe. We
shown on the strain-rate tensor rather than on the velocity field at         should note, however, that extension in Fennoscandia is generally
geodetic sites or baselines connecting pairs of sites, as in Milne           underestimated by GIA21. The extension in the north and the small
et al. (2001), Marotta & Sabadini (2002). The GIA models are the             compression at latitudes between 52◦ and 58◦ are due to the out-
same as in Marotta & Sabadini (2002). Models shown in Fig. 4                 ward motion from the centre of deglaciation and small northerly
are characterized by an upper mantle viscosity of 0.5 × 10²¹ Pa              oriented velocities due to GIA in continental Europe, as visible in
s and a lower mantle viscosity of 1021 Pa s (blue and red bars),             the velocity pattern for the uniform viscosity model in Fig. 3 of
GIA21, or 1022 Pa s (cyan and yellow bars), GIA22. A 120 km                  Marotta & Sabadini (2002). An increase in the extension north of


                                                                                                                      C   2004 RAS, GJI, 157, 865–870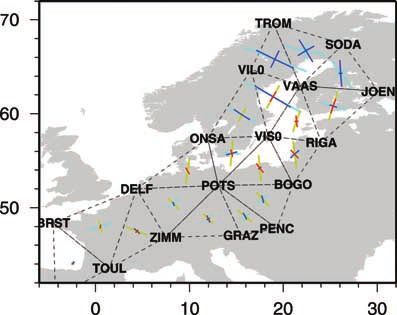
Tectonics and GIA in Europe 869
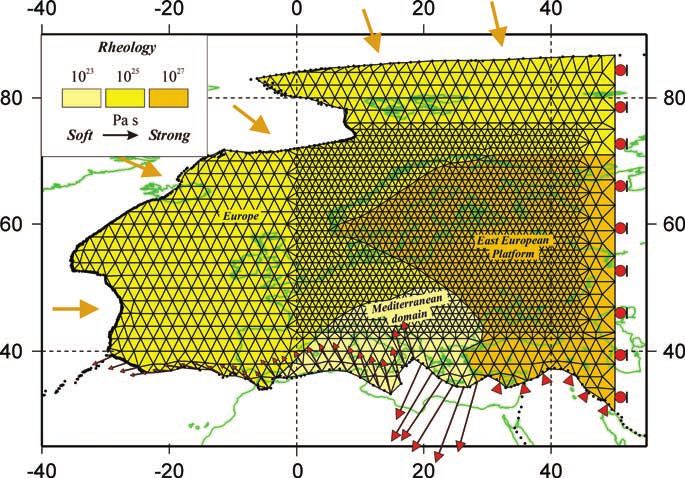
Figure 4. Directions of the strain-rate eigenvectors (bars) predicted by GIA
models (blue extension and red compression refer to an upper mantle vis-
cosity of 0.5 × 10²¹ Pa s and a lower mantle viscosity of 1021 Pa s (GIA21);
cyan extension and yellow compression refer to an upper mantle viscosity
of 0.5 × 10²¹ Pa s and a lower mantle viscosity of 1022 Pa s (GIA22)).
latitude 60◦ is obtained by means of GIA22. The extension is now
increased in all the triangles (cyan bars), and, north of VIS0, the fit
with the geodetic strain rate is improved, within the uncertainties.
South of the line connecting ONSA and VIS0, and north of POTS,
we note that compression (yellow bars) is increased with respect to
GIA21. South of POTS, the contribution of this GIA model to both
compression and extension is no longer negligible, as for GIA21,
but compression points in the SE–NW direction, in contrast with
observation. When comparison of Fig. 4 is made with Fig. 3, we
note that the tectonic model with the stiff Baltic Shield influences Figure 5. Strain-rate eigenvalues and eigenvectors (bars) predicted by the
the compression south of ONSA–VIS0, with largest contributions combination of the tectonic model 3 plus GIA22 (a) and by the tectonic
south of DELF–POTS–BOGO, while GIA contributes to the com- model 3 plus GIA21 (b) (blue extension; red compression), compared with
pression in the central European region between ONSA–VIS0 and observed strain rates, based on ITRF2000 velocity solutions (Table 2) (light
DELF–POTS–BOGO and to the extension north of ONSA–VIS0: blue and light red circular sectors for extension compression, respectively).
these figures thus confirm that tectonics dominates the strain-rate
pattern south of POTS, while GIA is the dominant mechanism north As far as the amplitude is concerned, model predictions have the
of VIS0 in Fennoscandia and that both tectonics and GIA contribute tendency to reproduce the lower bounds of the observed strain rates,
to the deformation in the European continental region between the in particular for high latitudes, which may be due to several reasons.
latitudes of POTS and VIS0. That this is the case is shown in Fig. 5 For high latitudes it could be due to the usage of a viscosity profile
in which the combined effects of the best performing tectonic model derived from time-dependent gravity studies (Sabadini et al. 2002)
3 and GIA models are portrayed, with Figs 5(a) and (b) referring or to the incompressibility of the model. For intermediate latitudes
to the northern and southern domains. Model predictions denoted (Fig. 5b) a possible cause could be our use of NUVEL-1A, model
by the bars are superimposed to the strain rates of Table 2, repre- that although being the necessary reference for our tectonic mod-
sented with their errors in the magnitude and azimuth, with light elling turns out to be inadequate, to the level of a few millimetres per
blue denoting extension and light red compression. It should be year, to describe the current relative plate motion (Altamini et al.
noted that the data are portrayed for only one side of the admissible 2002). We have verified, in fact, that a 50 per cent increase in the rel-
area of variability of the magnitude: this leaves room for depicting ative Eurasia–Africa convergence produces an increase of approxi-
the already highlighted possible change from compression into ex- mately the same amount in the predicted compressive strain rates in
tension, or vice versa, caused by some errors being larger in absolute Fig. 5(b).
value than the corresponding datum. Model results reproduce well
the general pattern of NW extension in Fig. 5(a), while in Fig. 5(b)
4 C O N C LU S I O N S
only the NE compression is reproduced. It should also be noted that
the agreement in the azimuth is obtained by combining the tectonic We have analysed the combined effects induced by tectonics and
model 3 with GIA22 for high latitudes (Fig. 5a) and with GIA21 for GIA on the deformation in continental Europe. Our results indicate
intermediate latitudes (Fig. 5b), which may support the existence that Africa–Eurasia convergence plays the dominant role in the part
of lateral variations in mantle viscosity with a stiffer mantle under- of Europe extending from the Alps up to about latitude 52◦ N, cor-
neath the Baltic Shield, coherently with the lateral heterogeneities responding to the latitude of Potsdam (POTS); this tectonic mech-
built in the tectonic model not accounted for in the GIA models. anism has no effect north of about latitude58◦ N, corresponding to
C 2004 RAS, GJI, 157, 865–870870 A. M. Marotta and R. Sabadini
the latitude of Onsala (ONSA), in Fennoscandia. GIA is the only Bassin, C., Laske, G. & Masters, G., 2000. The current limits of resolution
mechanism which has a signature north of Onsala. The strain rate in for surface wave tomography in North America, EOS, Trans. Am. geophys.
central Europe, between Onsala and Potsdam, is clearly affected by Un., 81, 897.
both mechanisms. Our analysis thus reinforces the conclusions of Devoti, R. et al., 2002. Geophysical interpretation of geodetic deformation
previous studies based on baseline rate of changes (Marotta & Saba- in the central Mediterranean area, Tectonophysics, 246, 151–167.
Golke, M. & Coblentz, D., 1996. Origins of the European regional stress
dini 2002; Marotta et al. 2004), that deformation in Europe is the re-
field, Tectonophysics, 266, 11–24.
sult of a complex interplay between forces induced by tectonics and ITRF2000 http://lareg.ensg.ign.fr/ITRF/ITRF2000
GIA. Lateral variations in lithospheric strength in the East European Jimenez-Munt, I. & Sabadini, R., 2002. The block-like behavior of Anatolia
Platform play a crucial role in separating the two domains where tec- envisaged in the modelled and geodetic strain, Geophys. Res. Lett., 29,
tonics and GIA have their major influence, south of Potsdam and 39/1–39/4.
north of Onsala respectively. The combination of the tectonic model, Marotta, A.M. & Sabadini, R., 2002. Tectonic versus glacial deformation in
characterized by a stiff East European Platform and Atlantic Ridge Europe, Geophys. Res. Lett., 29, 73/1–73/4.
push effects completely absorbed within the western oceanic portion Marotta, A.M., Bayer, U., Scheck, M. & Thybo, H., 2001. The stress field
of the model domain, and the GIA models turns out to be the best per- below the NE German basin: effects induced by the Alpine collision,
forming one, once its predictions are compared with geodetic strain Geophys. J. Int., 144, F8–F12.
Marotta, A.M., Mitrovica, J.X., Sabadini, R. & Milne, G., 2004. Combined
rates. This best performing model reproduces the observed compres-
effects of tectonics and glacial isostatic adjustment on intra-plate defor-
sion south of Onsala and the dominant SE–NW extension north of mation in central and northern Europe: applications to geodetic baseline
Onsala. analysis, J. geophys. Res. 109, 2002JB002337.
McClusky, S. et al., 2000. Global Positioning System constraints on plate
kinematics and dynamics in the eastern Mediterranean and Causasus, J.
AC K N OW L E D G M E N T S geophys. Res., 105, 5695–5719.
Milne, G.A., Davis, J.L., Mitrovica, J., Scherneck, H.G., Johansson, J.M.,
This work was funded by the Italian Ministry of Universities and
Vermeer, M. & Kouvula, H., 2001. Space geodetic constrains on glacial
Research (M.I.U.R.) under the project ‘A multidisciplinary moni-
isostatic adjustment in Fennoscandia, Science, 291, 2381–2385.
toring and multiscale study of the active deformation in the northern Molnar, P., Fitch, T.J. & Wu, F.T., 1973. Fault plane solutions of shallow
sector of the Adria Plate’ (COFIN 2002). All figures were created earthquakes and contemporary tectonics in Asia, Earth planet. Sci. Lett.,
using the GMT plotting software (Wessel & Smith 2001). The au- 19, 101–112.
thors thank Bruno Crippa for support during the data processing and Richardson, R.M. & Reding, L., 1991. North American plate dynamics, J.
the reviewers Bert Vermeersen and Detlef Wolf for their comments geophys Res., 96, 12 201–12 223.
and suggestions. Richardson, R.M., Solomon, S.C. & Sleep, N.H., 1979. Tectonic stress in
the plates, Rev. Geophys., 17, 981–1019.
Sabadini, R., Di Donato, G., Vermeersen, L.L.A., Devoti, R., Luceri, V.
REFERENCES & Bianco, G., 2002. Ice mass loss in Antarctica and stiff lower mantle
viscosity inferred from the long wavelength time dependent gravity field,
Altamini, Z., Sillard, P. & Boucher, C., 2002. ITRF2000: a new release of the Geophys. Res. Lett., 29, 11/1–11/4.
International Terrestrial Reference Frame for Earth science applications, Wessel, P. & Smith, W.M.F., 2001. New improved version of Generic Map-
J. geophys. Res., 107, 2001JB000561. ping Tools released, EOS, Trans. Am. geophys. Un., 79, 579.
C 2004 RAS, GJI, 157, 865–870You can also read