Indications of an unexpected signal associated with the GW170817 binary neutron star inspiral
←
→
Page content transcription
If your browser does not render page correctly, please read the page content below
Indications of an unexpected signal associated with the GW170817
                                                                  binary neutron star inspiral∗
                                                 E. Fischbacha , V. E. Barnesa , N. Cinkob,a , J. Heima , H. B. Kaplanc,a , D. E. Kraused,a ,
                                                    J. R. Leemana , S. A. Mathewse , M. J. Mueterthiesa , D. Nefff,a , M. Pattermanna
                                                       a
                                                         Department of Physics and Astronomy, Purdue University, West Lafayette, IN 47907, USA
                                                                 b
                                                                   Department of Physics, University of California, Berkeley, CA 94720, USA
                                                              c
                                                                Department of Physics, University of Maryland, College Park, MD, 20742, USA
                                                                    d
                                                                      Physics Department, Wabash College, Crawfordsville, IN 47933, USA
arXiv:1801.03585v4 [astro-ph.HE] 21 Jun 2018

                                                          e
                                                            US Naval Research Laboratory, Material Science Division, Washington, DC 20375, USA
                                                      f
                                                        Department of Physics and Astronomy, University of California, Los Angeles, CA 90024, USA

                                               Abstract
                                               We report experimental evidence at the 2.5σ level for an unexpected signal associated with
                                               the GW170817 binary neutron star inspiral. This evidence derives from a laboratory exper-
                                               iment simultaneously measuring the β-decay rates of Si-32 and Cl-36 in a common detector.
                                               Whereas the Si-32 and Cl-36 decay rates show no statistical correlation before or after the
                                               inspiral, they are highly correlated (∼ 95%) in the 5 hour time interval immediately fol-
                                               lowing the inspiral. If we interpret this correlation as arising from the influence of particles
                                               emitted during the inspiral, then we can estimate the mass mx of these particles from the
                                               time delay between the gravity-wave signal and a peak in the β-decay data. We find for
                                               particles of energy 10 MeV, mx . 16 eV which includes the neutrino mass region mν . 2 eV.
                                               The latter is based on existing limits for the masses mi of the three known neutrino flavors.
                                               Additionally, we find that the correlation is even stronger if we include data in the 80 minute
                                               period before the arrival of the gravity wave signal. Given the large number of radionuclides
                                               whose decays are being monitored at any given time, we conjecture that other groups may
                                               also be in a position to search for statistically suggestive fluctuations of radionuclide decay
                                               rates associated with the GW170817 inspiral, and possibly with other future inspirals.
                                               Keywords: Neutron stars, radioactivity, neutrinos

                                               1. Introduction
                                                   The recent detection by the Advanced LIGO and Advanced Virgo detectors of a gravita-
                                               tional wave signal from a binary neutron (NS-NS) star inspiral [1, 2], GW170817 was quickly
                                               followed by an optical detection of the remnants of the inspiral as well. The gravitational

                                                 ∗
                                                     Journal Reference: Astroparticle Physics 103 (2018) 16
                                                     Email address: ephraim@purdue.edu (E. Fischbach)
wave signal was received at 12:41:04 UTC on 17 August 2017, and the source of the inspiral
was localized to a luminosity distance of 1.30 × 10⁸ ly = 1.23 × 1026 cm from Earth. A
subsequent search for high-energy neutrinos associated with the inspiral by the antares,
IceCube, and Pierre Auger observatories did not detect any neutrinos [3].
Here we report a possible indication of an additional signal associated with the NS-NS
inspiral obtained from an experiment at Purdue University that was underway at the time
of the inspiral. The experiment was aimed at obtaining an improved half-life for Si-32
(T1/2 ∼ 172 yr), using an upgraded apparatus originally designed and built by a group
at Brookhaven National Laboratory [4, 5], and subsequently donated to our group. The
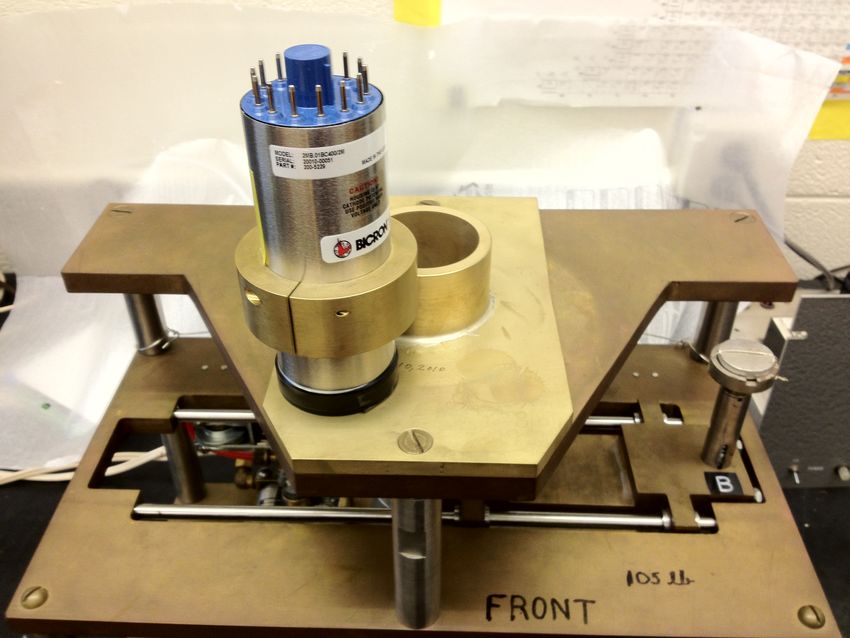
special feature of this apparatus, shown in Fig. 1, is that it allowed the decay rate of Si-32
to be continually compared to that of Cl-36 (T1/2 ∼ 301, 000 yr) which acted as an internal
calibration standard. As noted in [4], Si-32 decays via β − emission 100% of the time to
the ground state (g.s.) of P-32 emitting an electron with energy Q(β − ) = 225 keV. P-32
(T1/2 = 14.28 d) decays in turn 100% of the time via β − emission to the g.s. of S-32 with
Q(β − ) = 1709 keV. Cl-36 (T1/2 ∼ 301, 000 yr) decays via β − emission to the g.s. of Ar-36
98.1% of the time with Q(β − ) = 709 keV, and via electron capture (e.c.) to the g.s. of
S-36 1.9% with Q(e.c.) = 1144 keV. Since the 225 keV Q(β − ) for Si-32 decay is too low an
energy to be detected reliably, the Si-32 decay rate is determined from the subsequent decay
of P-32 which is presumed to be in equilibrium with Si-32. Any short-term perturbations of
the “Si-32” decay rate would actually be perturbations of the P-32 decay rate.
The Si-32 and Cl-36 samples were separately positioned on top of two pedestals affixed
to two precision micrometers, one of which (B) is shown in Fig. 1. The micrometers were
rigidly fixed to a carriage which moved back and forth to position each sample under the
detector(shown) in 30 minute intervals. Given the long half-life of Cl-36, its measured rate
should have been effectively constant over the 4-year duration of the original experiment
(4/301, 000 ' 1.3 × 10⁻⁵ ) [4]. Hence any short-term or long-term deviations from a constant
Cl-36 count rate could be attributed to drifts in the apparatus, which would then apply to the
Si-32 count rate as well. By comparing the Si-32 and Cl-36 count rates over time, specifically
by computing their ratio Si-32/Cl-36, the correct Si-32 half-life could be determined.
The BNL experiment was the first to report an unexpected annual oscillation in the
decay rates of their samples, superimposed on their respective exponential decay curves
[4]. Data acquired during approximately the same period at the Physikalische Technische
Bundesanstalt (PTB) in Germany exhibited a similar annual variation in their decay data for
Ra-226 [6]. Subsequently a number of other decay experiments and analyses have reported
similar results [7–19]. Of particular significance in the present context is evidence of changes
in nuclear decay rates associated with solar storms [10, 20]. Although there is at present
no known mechanism to account for these correlations, various considerations suggest that
they may be attributed to solar or relic neutrinos, or to similar dark matter candidates. If
we assume this to be the case, then it is natural to ask whether a signal from the GW170817
inspiral might also show up in our system.
237
Figure 1: The BNL apparatus for measuring the decay rates of Si-32 and Cl-36. Shown is pedestal B on
Figureis 4.1.
which the Si-32 sample Detector
placed, mountplastic
the Bicron fabricated to accommodate
scintillation detector, the
andnew detector
the collar to keep the detector
on the original BNL sample changer. The detector slides down
rigidly in place. In the configuration shown, the Cl-36 sample (hidden) would be directly into theunder the detector.
top plate
The samples are driven alongof the
the track
samplerails
changer,
in the and the collar
foreground byattached to the
a pneumatic detector
system which places each in
holds itSee
turn under the detector. at the
textdesired height.
for further details.
2. Experimental Details
As we Finally, 47.7 mg of SiOwe
now demonstrate, 2 powder
have was cemented
applied in a brass
a variant of source
the BNL holder and bonded
technique to compare
the short-term behaviorsconducting
with electrically of the Si-32 cementandto Cl-36 count foil
an aluminum rates so before, during,
as to prevent and after the
possible
inspiral event. We
surface then show
charging of the that in the 5-hour period immediately following the arrival of
source.
the inspiral signal, the Si-32 and Cl-36 signals become highly correlated, which we interpret
The sample changer alternates between the long-lived 36 Cl and 32 Si every 30 min-
as evidence for an external influence affecting the respective decays. Our modified BNL
utes for isthe
detection system duration
shown of each
in Fig. 1. run
We (200 cycles, the
upgraded book-ended
originalby background
BNL apparatusmeasure-
by introducing
a collar (shown)
ments).designed to secureof our
This interweaving 36
Cldetector
32
to the sample
and Si observations changer.
is designed The data
to minimize theacquisition
system (DAQ)e↵ect consisted
of systematicsof ain2-inch
the DAQ Bicron
system.plastic scintillation
Temperature, pressuredetector
and %RH(shown)
are mon-coupled to
an Ortec 276 base and preamplifier. The remainder of the system consisted of a spectroscopy
itored by a NIST traceable data logger (TR-73U by T&D Corp.) inside the drum
amplifier, and a multi-channel analyzer (MCA) connected to a PC running Maestro 32 and
and capable
custom LabView of ±0.3The
software. C, ±5%RH,
upgraded and ±1.5 hPa
sample accuracy.
changer wasThe readings
placed in a have been 55 gallon
modified
steel drumshown
whichto acted as Faraday
be repeatable to the shield, andthe
tenths digit, waslimit
kept at aresolution
of the controlled pressure
of the device. with dry
nitrogen. This
Basedarrangement
on the pressurealso allowed
reading, us to minimize
the software determinesvariations
the desiredinstate
relative humidity. The
of a valve
temperature in the room was controlled by a water-cooled air conditioner set to 21◦ C. The
entire system was then completely encased in a styrofoam box with 2-inch thick walls to
suppress temperature variations. The temperature inside the box itself was further controlled
by a Technology, Inc. model AC-073 heating/cooling unit set to 22.0◦ C. Electrical power
to the system was supplied by a constant voltage transformer to mitigate any effects from
fluctuating line voltage. This system allowed the voltage output to be held constant at 117 V
for an input voltage in the range 109–125 V. Further details can be found in [21]. Since the
3Figure 2: Si-32 and Cl-36 count rates during August 2017. The scales on the respective vertical axes are
arbitrary, and do not affect the determination of correlations between the decay rates. The shaded gray
region encompasses 7 pairs of Si-32/Cl-36 counts which our analysis suggests are highly correlated, and the
dark vertical line at 12:41 UTC on 17 August 2017 denotes the GW170817 gravity wave’s time of arrival.
Si-32 and Cl-36 counts are acquired by the BNL system in successive 30 minute runs, the
data acquired from one sample should be statistically uncorrelated to the data acquired from
the other. Hence, in the absence of evidence for a malfunction in the detection system, any
indication of a correlation can be attributed to either a statistical fluctuation (see below),
or to evidence of an external influence common to both the Si-32 and Cl-36 samples. In
what follows we verify that the fluctuations in the decays of the Si-32 and Cl-36 are in
fact statistically uncorrelated, as expected, with three significant exceptions, one of which
happens during the period immediately preceding and following the inspiral. To facilitate
the various statistical tests that we have carried out, the Si-32 data have been correlated
with the Cl-36 data points which are 30 minutes later in time. As we have noted above, we
expect that the Si-32 and Cl-36 decay fluctuations should be uncorrelated, precisely because
they are not acquired by our detection system at the same time. Matching the Si-32 data
to the Cl-36 data points 30 minutes earlier in time does not produce a high correlation (see
Table 1). This asymmetry might be due to the start of the main signal having arrived when
the Si-32 source was being counted and the Cl-36 was not under observation.
3. Experimental Results
In Fig. 2 the dark vertical line denotes the time 12:41 UTC on 17 August 2017 when
the LIGO/Virgo detectors observed a gravity-wave signal from a NS-NS inspiral. We define
the “post-inspiral region” to be the subsequent 5 hour portion of the shaded in gray region
containing the 5 Si-32 and 5 Cl-36 sets of 30 minute counts. To test for the statistical
significance of the peak centered in this region we have carried out a Pearson correlation
test on the 5 sets of Cl-36 and Si-32 points in the post-inspiral region. We find the Pearson
4Figure 3: The local average and cumulative root-mean-square (RMS) fluctuations of the 2017 Cl-36 decay
data for the period 1 January through 11 October. Each of the 6,438 points represented in the figure is
the 101 point rolling RMS average deviation from the mean, including that point and the 50 earlier and
later points. The horizontal
√ dashed line denotes the average number of counts for the entire data set, where
N = 400, 864 and N = 632. Also shown are both the individual RMS values, whose average is 649, and
the cumulative RMS values as a function of time. See text for further details.
correlation coefficient to be 0.950, corresponding to a (one-sided) false-alarm probability
of 6.7 × 10⁻³ for positive correlations, as shown in Table 1. In contrast, the same test
applied to the similarly shifted data set for the entire month of August 2017 (excluding the
post-inspiral region) gives a Pearson correlation coefficient of −4.2 × 10⁻³ . This result is,
of course,√what would be expected for two uncorrelated data sets experiencing independent
random N fluctuations.
To confirm the preceding estimate of the statistical significance of the correlation high-
lighted in Fig. 2, we have carried out an analogous search for other highly positively-
correlated fluctuations in calendar 2017 from 1 January to 11 October having a statistical
significance ≥ 0.949. As noted above, each day typically produces 24 Si-32 and 24 Cl-36
runs each of 30 minutes in duration. Hence the 284 day period should produce 6,816 Si-
32/Cl-36 pairs of data to which we can apply an analysis identical to what we carried out
for data acquired during the August 17 post-inspiral region. After excluding periods during
which our apparatus was offline, we found 6,440 other regions to which we could apply the
same analysis used in the post-inspiral region. Of these, 34 had correlation coefficients ≥
+0.949, corresponding to false-alarm probabilities of ≤ 6.7 × 10⁻³ . The agreement between
this value, and the estimate for the 17 August 2017 5-hour post-inspiral region supports our
estimate of the statistical significance of the post-inspiral correlation.
As a further check on the stability of our detection system we verify that the root-mean-
square (RMS)
√ fluctuations of the Cl-36 data outside the inspiral region are in accord with the
usual “ N rule” for statistically uncorrelated data. The average number of Cl-36 counts N
in a 30 minute interval for the period 1 January through 11 October is N = 400, 864 (again
5excluding the gray region in Fig. 2). We first calculate the rolling RMS deviation
v
u i+50
u X (Nj − N )2
σi = t
j=i−50
101
and then the average hσi i over the data set√(see Fig. 3). As seen from the figure, hσi i = 649,
to be compared with the expected value N = 632 assuming only statistical fluctuations.
An RMS test to the Si-32 data requires comparing counts to a fitted curve rather than to
a simple average, due to the shorter half life. For the Si-32 data we find an RMS of 455
counts, quite close to the square root of√the number of counts (N = 199, 000), which is 446.
The close agreement between hσi i and N suggests that the fluctuations in both the Cl-36
and Si-32 decay rates outside the inspiral region are in fact statistical and not systematic.
4. Experimental Implications
If we interpret the features in the Si-32/Cl-36 data as arising from a flux of particles of
mass mx associated with the NS-NS inspiral, then we can estimate mx from the difference
in the arrival times of these features and the gravity wave signal. Let (tg + δt) denote the
time-of flight of the particles of mass mx , where tg = 1.30 × 10⁸ yr is the time-of-flight of
the gravitational wave presumed to be traveling at the speed of light [22]. From Fig. 2
we estimate that δt ranges from 1.5 hours down to possibly very few minutes. Note that
the data points are plotted at the completion times of each half-hour of data. Note also
that one must make assumptions about the duration and timing of the emission of particles
relative to the final chirp as the neutron stars coalesce. Using relativistic kinematics we find
Ex = mx (1 − vx2 )−1/2 (with c = 1) and hence
(mx /Ex )2 = 1 − vx2 ' 2δt/tg . (1)
Combining Eq. (1) with tg and the preceding value of δt = 1.5 hours we find
mx /Ex < 16 × 10−7 . (2)
If we were to further assume that Ex , the energy of the emitted neutrinos, or neutrino-like
particles “neutrellos” [23], is Ex ' 10 MeV, we then find from Eq. (2),
mx < 16 eV. (3)
We note from Eq. (1) that the ∼ 5 hour spread in the arrival times of whatever particles
might be responsible for the observed features may be attributable in part to a spread in
the energies Ex in Eq. (1). This energy spread could arise in part from the scattering of the
emitted particles leaving the binary. Furthermore, if these particles are in fact neutrinos,
or neutrino-like ”neutrellos” [23], then the expected flavor oscillations could also somewhat
broaden the spread of arrival times compared to that of the gravity signal.
6The result for mx in Eq. (3) is larger than the limits inferred in several scenarios for
the presumed neutrino mass eigenstates m1 , m2 , and m3 . These are derived from neutrino
oscillation data combined with limits on the mass of ν̄ e from tritium β-decay, m(ν̄ e ) . 2 eV
[24]:
Normal Hierarchy: m1
m2 < m3 : m2 ' 0.0087 eV; m3 ' 0.05 eV, (4)
Inverted Hierarchy: m3
m1 < m2 : m1,2 ' 0.049 eV, (5)
Quasi-degenerate: m1 ' m2 ' m3 & 0.1 eV. (6)
Even the largest result Eq. (6), which is compatible with the limit mν ≥ 0.4 eV derived
from the stability of neutron stars and white dwarfs [25], would lead to a neutrino mass
limit smaller than that obtained for mx in Eq. (3). However, if we were to assume that
Ex ' 1 MeV in Eq. (2), which is the characteristic neutrino energy in neutron β-decay, we
would find mx ' (1.6 ± 0.3) eV, which could be compatible with existing neutrino data in
models involving sterile neutrinos. Additionally, taking into account the earliest part of the
signal further reduces the mass estimate, as could inclusion of the quoted uncertainties in
tg [1]. For other neutrino mass limits refer to [26–28].
The high end of the mass estimates does not favor known neutrinos as the agents. A
further issue is a comparison of the estimated fluence of neutrinos reaching the Earth from
the NS-NS inspiral versus the known fluence of solar neutrinos reaching the Earth during
the 5-hour event region shown in Fig. 2. We note from [2] that the characteristics of
neutrinos emitted from the NS-NS inspiral are expected to be similar to those arising from
core collapse in a supernova for which estimates are available. We assume, as representative
numbers, a neutrino luminosity L = (1–3) × 1053 erg/s lasting for ∼10 s. If the typical
emitted neutrino energy is ∼ 10 MeV, then the number N of emitted neutrinos is N ' (6–
18) × 1058 . The resulting fluence FNS at the Earth at a distance d = 1.23 × 1026 cm is
then FNS ' (3–10) × 105 ν/cm2 . By way of comparison, the total fluence F of neutrinos
from the Sun during the 5-hour inspiral region shown in Fig. 2 would be approximately
F = (65 × 109 ν/cm2 · s)(1.8 × 10⁴ s) ' 1 × 10¹⁵ ν/cm2 , and hence FNS
F .
The preceding analysis has focused on the 5 hour period following the arrival time of the
gravity wave, on the assumption that no signal from the inspiral could exceed the speed of
the gravity wave and hence precede it. However, a close examination of Fig. 2 reveals that
the two additional pairs of points taken just before the gravity wave arrived, are also highly
correlated. We have carried out an analysis of the full 7 hour region including the early
data points, defined by the full gray shaded region in Fig. 2, following the same steps as
described previously for the 5-hour post-inspiral region. We find for the 7-hour shaded region
a Pearson correlation coefficient of 0.954, compared to 0.950 for the 5-hour post inspiral
region, as listed in Table 1. This corresponds to a false-alarm probability of 4.3 × 10⁻⁴ . By
way of comparison, the 7-hour Pearson correlation coefficient for the entire month of August
2017 implies a false alarm probability of −4.2 × 10⁻³ . We have also determined that for the
period 1 January–11 October there are a total of 6,438 possible 7-hour pairs (again excluding
times when our system was offline). Of these only 3 gave Pearson coefficients ≥ +0.954,
corresponding to false alarm probabilities of ≤ 4.3 × 10⁻⁴ . In addition to the inspiral event
7on 17 August, there were high correlation periods for the shifted 7-hour data on 25 May and
on 15 June, which could be attributed to expected random fluctuations of the data.
5. Conclusions
To summarize, the design of the BNL detection system ensures that the Si-32 and Cl-
36 decays should be completely uncorrelated absent any external driving signal. However,
what we have shown is that our system detected a correlation on 17 August 2017 of decay
rates, with an upward fluctuation which peaked at 93 minutes following the arrival of the
gravity wave detected by LIGO. There were no observed correlations between this feature
and any fluctuations in temperature, pressure, humidity or line voltage recorded in our
system. The five-hour correlation false-alarm probability of the inspiral event was 6.5×10⁻³ ,
as determined from statistical tests we carried out for the period 1 January–11 October
2017. Combining our data with the distance to the inspiral binary as determined by the
LIGO/Virgo analysis allows us to infer that our signal may be attributable to the arrival of
particles of mass possibly considerably less than ∼ (10–20) eV, which could be compatible
with neutrino mass limits determined from current laboratory experiments and astrophysical
arguments. Our results may also be compatible with a scenario in which part of the energy
of the inspiral is emitted in the form of some new particles. However, the “Si/Cl event”
confronts us with other puzzles: In the first place, the fluence of neutrinos, or hypothetical
neutrino-like “neutrellos” [23], appears to be too small to account for the observed data,
at least in the framework of existing models of supernova formation or binary neutron star
inspirals. Additionally, the extra correlation seen by including the pre-merger data points,
while increasing the apparent significance of the 7-hour correlation to the 3.3σ level, may
of course be just a statistical fluctuation. There is no presently known process where large
fluxes of energy might emerge many minutes before the final NS merger. However, we note
that data acquired at the Mont Blanc Underground Neutrino Observatory (UNO) may have
also detected a precursor signal associated with the SN1987A event [29, 30]. Finally, the
improbability of even the 5-hour correlation’s coinciding with the arrival of the gravity wave
leads us to note that there may exist many other experiments studying radioactive decays
which could have detected a similar signal, and we encourage other groups to examine their
data. This may make it possible to acquire additional supporting data from future NS-NS
inspirals.
Acknowledgements
The authors are deeply indebted to David Alburger and Garman Harbottle for generously
donating their unique apparatus to the Purdue group, along with their Si-32 and Cl-36
samples. We are also indebted to our many colleagues for helpful communications and
insights, including Maxim Barkov, George Bashinzhagyan, Rob de Meijer, Don Eckhardt,
Dimitrios Giannios, Mark Haugan, Andrew Longman, Maxim Lyutikov, Jonathan Nistor,
Alexander Parkhomov, Jeff Scargle, Gideon Steinitz, and Peter Sturrock.
8Intervals of 5 Cl-Si Pair Measurements (right-shifted)
Region of Interest Pearson Coefficient r
NS-NS Inspiral 0.94993
2017 Calendar to 11 Oct 0.02526
2017 w/o Inspiral 0.02516
Intervals of 5 Cl-Si Pair Measurements (left-shifted)
Region of Interest Pearson Coefficient r
NS-NS Inspiral 0.28341
2017 Calendar to 11 Oct 0.03733
2017 w/o Inspiral 0.03729
Intervals of 7 Cl-Si Pair Measurements (right-shifted)
Region of Interest Pearson Coefficient r
NS-NS Inspiral 0.95383
2017 Calendar to 11 Oct 0.02526
2017 w/o Inspiral 0.02502
Intervals of 7 Cl-Si Pair Measurements (left-shifted)
Region of Interest Pearson Coefficient r
NS-NS Inspiral 0.05919
2017 Calendar to 11 Oct 0.03733
2017 w/o Inspiral 0.03729
Table 1: Pearson correlation coefficients r relating the Si-32 and Cl-36 data sets for time intervals during
the period 1 January – 11 October 2017. The 5-hour region is the period to the right of the vertical black
line in the shaded area of Figure 2 denoting the arrival of the NS-NS inspiral gravity wave. The designation
(right-shifted) refers to the Si-32 data which have been shifted to the right (later) by 30 minutes, so as to
align with the Cl-36 data. The 7-hour region encompasses the entire shaded area in Fig. 2. See text for
further details.
References
[1] B. P. Abbott, et al., GW170817: Observation of Gravitational Waves from a Binary Neutron Star
Inspiral, Phys. Rev. Lett. 119 (2017) 161101.
[2] B. P. Abbott, et al., Multi-messenger Observations of a Binary Neutron Star Merger, ApJL 848 (2017)
L12.
[3] A. Albert, et al., Search for High-energy Neutrinos from Binary Neutron Star Merger GW170817 with
ANTARES, IceCube, and the Pierre Auger Observatory, ApJL 850 (2017) L35.
[4] D. E. Alburger, G. Harbottle, & E. F. Norton, Half-life of 32 Si, Earth Planet. Sci. Lett. 78 (1986) 168.
[5] G. Harbottle, C. Koehler, & R. Withnell, A Differential Counter for the Determination of Small Dif-
ferences in Decay Rates, Rev. Sci. Instr. 44 (1973) 55.
[6] H. Siegert, H. Schrader, & U. Schötzig, Half-life measurements of Europium radionuclides and the
long-term stability of detectors, Appl. Radiat. Isot. 49 (1998) 1397–1401.
[7] E. D. Falkenberg, Radioactive Decay Caused by Neutrinos?, Apeiron 8(2) (2001) 32–45.
[8] E. Fischbach, J. B. Buncher, J. T. Gruenwald, J.H. Jenkins, D.E. Krause, J.J. Mattes, J.R. Newport
9Time-dependent nuclear decay parameters: new evidence for new forces?, Space Sci. Rev. 145 (2009)
285–335.
[9] D. Javorsek II, et al., Power spectrum analyses of nuclear decay rates, Astropart. Phys. 34 (2010)
173–178.
[10] J. H. Jenkins, E. Fischbach, Perturbation of nuclear decay rates during the solar flare of 2006 December
13, Astropart. Phys. 31 (2009) 407–411.
[11] J. H. Jenkins, E. Fischbach, J. B. Buncher, J. T. Gruenwald, D. E. Krause, J. J. Mattes, Evidence of
correlations between nuclear decay rates and Earth-Sun distance, Astropart. Phys. 32 (2009) 42–46.
[12] J. H. Jenkins, D. W. Mundy, E. Fischbach, Analysis of environmental influences in nuclear half-life
measurements exhibiting time-dependent decay rates, Nucl. Inst. Meth. Phys. Res. A 620 (2010) 332–
342.
[13] E. B. Norman, E. Browne, H. A. Shugart, T. H. Joshi, R. B. Firestone, Evidence against correlations
between nuclear decay rates and Earth-Sun distance, Astropart. Phys. 31 (2009) 135–137.
[14] D. O’Keefe, B. L. Morreale, R. H. Lee, J.B. Buncher, J.H. Jenkins, E. Fischbach, T. Gruenwald, D.
Javorsek, P.A. Sturrock, Spectral content of 22 Na/44 Ti decay data: implications for a solar influence,
Astrophys. Space Sci. 344 (2013) 297–303.
[15] A. G. Parkhomov, Deviations from beta radioactivity exponential drop, J. Mod. Phys. 2 (2011) 1310–
1317.
[16] P. A. Sturrock, L. Bertello, E. Fischbach, D. Javorsek II, J. H. Jenkins, A. Kosovichev, A. G. Parkho-
mov, An analysis of apparent r-mode oscillations in solar activity, the solar diameter, the solar neutrino
flux, and nuclear decay rates, with implications concerning the Sun’s internal structure and rotation,
and neutrino processes, Astropart. Phys. 42 (2013) 62–69.
[17] P. A. Sturrock, E. Fischbach, D. Javorsek II, J. H. Jenkins, R. H. Lee, J. Nistor, J. D. Scargle, Compara-
tive study of beta-decay data for eight nuclides measured at the Physikalisch-Technische Bundesanstalt,
Astropart. Phys. 59 (2014) 47–58.
[18] P. A. Sturrock, E. Fischbach, & J. D. Scargle, Comparative Analyses of Brookhaven National Labo-
ratory Nuclear Decay Measurements and Super-Kamiokande Solar Neutrino Measurements: Neutrinos
and Neutrino-Induced Beta-Decays as Probes of the Deep Solar Interior, Solar Phys. 291 (2016) 3467–
3484.
[19] P. A. Sturrock, G. Steinitz, E. Fischbach, A. Parkhomov, J. D. Scargle, Analysis of beta-decay data
acquired at the Physikalisch-Technische Bundesanstalt: Evidence of a solar influence, Astrophys. J. 84
(2016) 8–14.
[20] T. Mohsinally, et al., Evidence for correlations between fluctuations in 54 Mn decay rates and solar
storms, Astropart. Phys. 75 (2016) 29–37.
[21] J. Heim, Ph.D dissertation, Purdue University (2015).
[22] B. P. Abbott, et al., Gravitational Waves and Gamma-Rays from a Binary Neutron Star Merger:
GW170817 and GRB 170817A, ApJL 848 (2017) L13.
[23] E. Fischbach, J. H. Jenkins, P. A. Sturrock, Evidence for time-varying nuclear decay rates: experimental
results and their implications for new physics, XLVIth Rencontres de Moriond and G. Phys. Colloquium
(2011) p. 397–402.
[24] K. A. Olive, et al., Review of Particle Physics, Chin. Phys. C, 38(9): 090001 (2014) p. 235
[25] E. Fischbach, Long-Range Forces and Neutrino Mass, Ann. Phys. (NY) 247 (1996) 213–291.
[26] E. Giusarma, M. Gerbino, O. Mena, S. Vagnozzi, S. Ho, K. Freese, Improvement of cosmological
neutrino mass bounds, Phys. Rev. D 94 (2016) 083522.
[27] S. Vagnozzi, E. Giusarma, O. Mena, K. Freese, M. Gerbinio, S. Ho, M. Lattanzi, Unveiling ν secrets
with cosmological data: Neutrino masses and mass hierarchy, Phys. Rev. D 96 (2017) 123503
[28] S. M. Bilenky, S. Pascoli, S. T. Petcov, Majorana neutrinos, neutrino mass spectrum, CP violation,
and neutrinoless double β decay: The three-neutrino mixing case, Phys. Rev. D 64 (2001) 053010
[29] M. Aglietta, et al., On the neutrino burst from SN 1987a detected in the Mt. Blanc LSD experiment,
Nucl. Phys. B (Proc. Suppl.) 3 (1988) 453–462.
[30] R. Ehrlich, The Mont Blanc neutrinos from SN 1987A: Could they have been m2 = −0.38 keV2
10tachyons?, Astropart. Phys. 99 (2018) 21–29.
11You can also read