Evaluating Presidential Support in the Brazilian House of Representatives Through a Network-Based Approach
←
→
Page content transcription
If your browser does not render page correctly, please read the page content below
Evaluating Presidential Support in the Brazilian
                                             House of Representatives Through a
                                                   Network-Based Approach

                                                                Tiago Colliri1[0000−0001−9233−4662]

                                                    Dept. of Computer Science, University of Sao Paulo, Brazil
                                                                   tcolliri@alumni.usp.br
arXiv:2109.03638v1 [cs.SI] 8 Sep 2021

                                              Abstract. Conflicts between the executive and legislative powers are a
                                              common, and even expected, characteristic of presidential systems, with
                                              some governments being more successful in the activity of obtaining sup-
                                              port from the Congress than others. In the case of Brazil, specifically,
                                              this factor is considered crucial in the so called “coalition governments”,
                                              with direct positive or negative consequences for the president, in terms
                                              of government performance during his (her) term. In this work, we in-
                                              vestigate this problem by testing and comparing two different methods
                                              for evaluating the government support in the Brazilian House of Repre-
                                              sentatives. The first method is a more traditional one, being based on
                                              roll-call voting data, and measures the presidential support at the leg-
                                              islators level. The second method uses a network-based approach, and
                                              performs the same type of analysis but at the parties level. The obtained
                                              results, when applying both methods on legislative data comprising the
                                              period from 1998 until 2019, indicate that both methods are valid, with
                                              common features being found not only between the results provided by
                                              the two of them, but also when comparing their results with those ob-
                                              tained by previous and relevant studies in this field, by using the same
                                              type of data but different methodologies.

                                              Keywords: Complex networks · Centrality measures · Clustering · Leg-
                                              islative voting · Bills co-sponsorship · Presidential support · Political
                                              parties.

                                        1   Introduction
                                        In presidential systems, the executive and legislative branches of the federal gov-
                                        ernment are independent, with the relationship between the two powers being
                                        characterized by periods of more conflict or cooperation. This inter-branch fric-
                                        tion has been gaining more attention from researchers in recent years, by using
                                        more complex models, in which executive-legislative relations are conceived not
                                        necessarily as the interaction between two branches of the government, but as
                                        the relationship between the government, political parties and groups of legis-
                                        lators [9]. Complex networks, on the other hand, haven been proven suitable
                                        tools for capturing and characterizing relationship among data, both physically,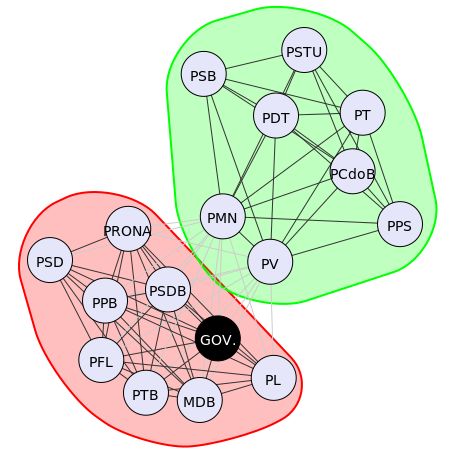
2       Tiago Colliri

topologically and functionally [28,10,27]. Therefore, not surprisingly, there is an
increasingly number of studies using a network-based approach to investigate
the relations between the executive and legislative powers. In the Brazilian pres-
idential system, more specifically, building stable coalitions is critical for the
elected president to support him (her) on his (her) legislative agenda, in what
is currently officially known as “coalition governments” among academics, and
failing in this activity will bring negative consequences, in terms of government
performance.

    There are currently several works based on networks built from data regard-
ing bills co-sponsorship, with focus on different aspects of the legislative activ-
ities, such as: partisanship versus cooperation and collaboration among parties
and lawmakers [1,22,16,20,17,2,32], the formation of interest groups or caucus in
the congressmen networks [15,31], evaluating government strength or support in
the Congress [13,25,29,33], the representation of minority interests in the par-
liament [14], the relationship between fundraising campaigns and congressmen
voting behavior [5], and even for corruption prediction purposes [11]. In another
study [19], which is more directly related to this one, the authors investigated
the collaboration and partisanship evolution in the Brazilian House of Repre-
sentatives, by using minimum spanning tree networks built from roll-call voting
data, comprising the period from 2003 until 2008. Among their findings, there
is the identification of topological patterns in the lawmakers networks that can
be used as indicators of political instabilities over a given period of time. It is
also worth mentioning the study [8], also based on roll-call voting data from
Brazilian lawmakers, that investigates whether local and regional interests from
the respective states they represent, in the Brazilian federalism system, may in-
fluence the legislative decision-making in the House more than the party leaders,
at the national level. After analyzing data from 1989 until 2006, to evaluate the
impact of local pressures on legislative voting, the authors have concluded that,
in fact, political parties play a more central role in the congressmen voting be-
havior, along with the ability of the president to form stable legislative coalitions
to control the House voting agenda.

    In this paper, we evaluate the presidential support in the Brazilian House
of Representatives by using a database built from roll-call voting data from
1998 until 2019, thus covering more than 20 years or legislative activities. Two
methods are tested and compared for this end. The first one is based on the
ratio of lawmakers votes following the government position, in each session, when
compared to the total number of votes, for each period. The second method is
a network-based approach, where the political parties and the government are
mapped as nodes in the network, and the connections between them are based
on their respective vote recommendation similarities, pairwise, in each voting
session, over a given period of time. Therefore, the first method evaluates the
presidential support by analyzing the House votes database at the members level,
while the second method performs the same type of evaluation but at the parties
level.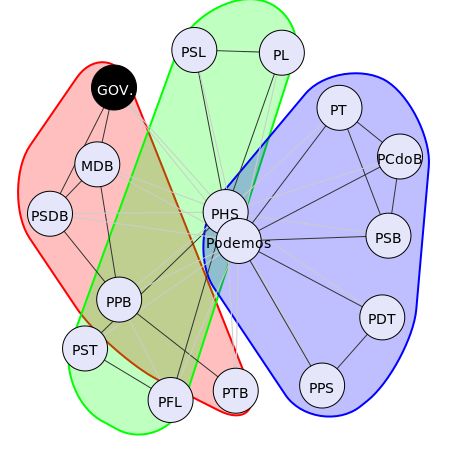
Evaluating Presidential Support in the House Through Networks     3

    Regarding the organization of this paper, besides this introduction, we have,
in section 2, the details regarding the database and the methodology used in
the study. Then, in section 3, we present and discuss the obtained results when
applying the proposed technique on roll-call voting data from the built database.
At the end, in section 4, we close this study by making some final remarks.

2     Materials and Methods

The methodology used in this study is described below. All network analyses
performed in this study are implemented by using the igraph Python package
[12].

2.1     Database

The database to be analyzed in this work was built from original data obtained
from the Brazilian House of Representatives’ official website [6]. These data
comprise the outcome of legislative voting sessions deliberated in the House,
in the period from Jan 1, 1998 until July 12, 2019, thus covering more than
20 years of legislative work. The year of 1998 was chosen as the initial one in
the built database because this is when information regarding vote recommen-
dations, both from party leaders and from the government, starts to become
available in the original data. As preprocessing, a thorough data cleansing was
performed in the obtained data, for detecting and fixing possible mistakes, such
as duplicated names among lawmakers and misprints. The data for each session
comprise the following information: the bill to be considered in the House, the
voting date, and the representatives who attended that session. Additionally, the
following information is provided for each voter:

 –    ID (a unique number for each congressperson),
 –    Full Name,
 –    Political Party, and
 –    Vote.

The roll call voting system in the Brazilian House consists of, basically, four
types of votes:

 – Yes: when the lawmaker approves the bill;
 – No: when the lawmaker disapproves the bill;
 – Abstention: when the lawmaker deliberately chooses to not take part in the
   voting;
 – Obstruction: similar to abstention, except that abstention counts for quorum
   purposes, while obstruction does not count for it.

Other types of votes from the original data, mainly consisting of different cat-
egories for the “absent” situation, were not taken into account in our analysis,
being discarded during the preprocessing.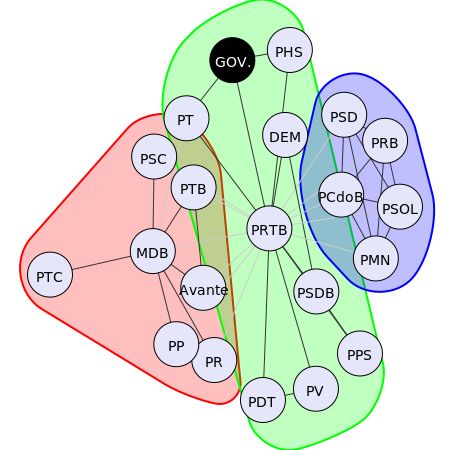
4       Tiago Colliri

    At the end, we were able to obtain a total of 1,019,845 votes, from 2,900
different legislative sessions occurred during the considered period. However, not
all these sessions presented information about vote recommendations from the
part of the government, which is required for this study. Therefore, we filtered
these data one last time, to leave only the votes and sessions that presented vote
recommendations from the government during the period. The final numbers of
the dataset analyzed in this work are shown in Table 1. As one can observe,
the final data cover eight different presidencies, from the first term of Fernando
Henrique Cardoso (FHC) until the current government, of Bolsonaro, comprising
a total of 814,776 votes in 2,271 distinctive legislative sessions.

Table 1. Summary of the data used in our analysis. The term “original” refers to
all voting data available in the period, while “filtered” refers only to the data from
legislative sessions that present vote recommendations from the government, which are
the focus of this work.

                                               Original         Filtered
              Period            Presidency Sessions    Votes Sessions Votes
      01-01-1998 – 12-31-1998   FHC I            93    34,849      12 4,251
      01-01-1999 – 12-31-2002   FHC II          432 163,511       329 127,880
      01-01-2003 – 12-31-2006   Lula I          451 146,538       378 128,433
      01-01-2007 – 12-31-2010   Lula II         619 207,484       509 173,498
      01-01-2011 – 12-31-2014   Dilma I         428 139,007       328 111,090
      01-01-2015 – 12-02-2015   Dilma II        274 112,404       247 101,401
      08-31-2016 – 12-31-2018   Temer           463 161,662       358 125,155
      01-01-2019 – 07-12-2019   Bolsonaro       140    54,390     110 43,068
                                Total         2,900 1,019,845   2,271 814,776

2.2    Political Parties Networks Generation

To perform our analyses, we map each political party in the voting sessions as
the node in a network, with one additional node representing the government,
and the edges between them are created according to their respective vote rec-
ommendations similarity, pairwise, on all sessions of the same period. Given that
there are currently 33 political parties in Brazil, then the maximum number of
nodes in the network obtained from current voting data, in the hypothetical sit-
uation where all parties currently occupy seats in the House, will be 34, i.e., the
total number of parties plus one additional node to represent the government.
Building a network from bills co-sponsorship data is a well known technique,
that already has been extensively applied in other related studies [14,21,15].
However, most of these works focus on the analysis of roll-call voting data at the
House members level, and not at the parties level, as in the case of this approach.
Besides of this, here we are also including a node to represent the government
in the networks, which can be considered a novelty in this type of study.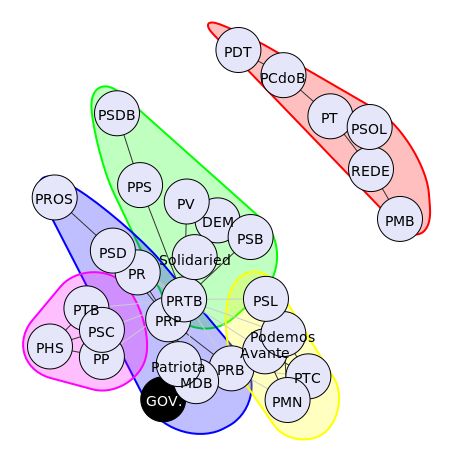
Evaluating Presidential Support in the House Through Networks         5

     A network can be defined as a graph G = (V, E), where V is a set of nodes
and E is a set of tuples representing the edges between each pair of nodes (i, j) :
i, j ∈ V. The edges in E are usually provided in the form of a square matrix
M , with size equal to the number of nodes in the network and binary values,
in case of unweighted graphs. In our case, we start by mapping the parties vote
recommendation similarities, in each voting session s, as a square matrix A,
according to:
             (
               1, if party i and j recommended the same vote in session s,
  Ai,j (s) =                                                                   (1)
               −1, otherwise.

The values in A are then accumulated in a matrix W , considering all voting
sessions occurred in a given time interval T , in the form of:
                                    X
                        Wi,j (T ) =    Ai,j (s) | st ∈ T ,              (2)
                                     s

where st returns the time t when session s has happened. In this way, the values
in matrix W will, basically, provide us the overall level of political agreement
(or disagreement) between each pair of parties i and j, based on their respective
vote recommendations in all n sessions occurred within the period T . Please note
that, consequently, the maximum possible value of Wi,j (T ) will be +n, in case
the party leaders from i and j presented the same vote recommendations for all
sessions in the period, while, on the other hand, the minimum value will be −n,
which means that their party leaders gave different vote recommendations in all
sessions of that period.
    There are different possible ways of generating a network G(T ) from matrix
W (T ). One of this ways is, for instance, simply mapping it as a weighted network,
using the values in W (T ) as the edges weights. Or, as another possibility, one can
also map the values in W (T ) to binary ones, according to a predefined threshold
value. In this study, we opt for generating edges between each pair of vertices i
and j based on the following rule:
                                (
                                   1, if Wi,j (T ) = max Wi (T )
                    Gi,j (T ) =                                                  (3)
                                   0, otherwise .

This method results in an unweighted graph, in which parties are connected
only to the ones that are the most politically aligned to them, in terms of their
respective leaders vote recommendations in the House. We decide to proceed this
way, by considering only the maximum values in matrix W (T ) when generating
the edges, mainly for the following reasons: (1) as the resulting networks will be
less connected, we believe their topological structures will reflect only the most
meaningful information, in terms of the parties political similarities, in each
period, (2) it also facilitates the interpretability and visibility of the results,
and (3) less dense networks are more sensitive to the specific measures that will
be extracted from them later, when evaluating the government support in each
presidency.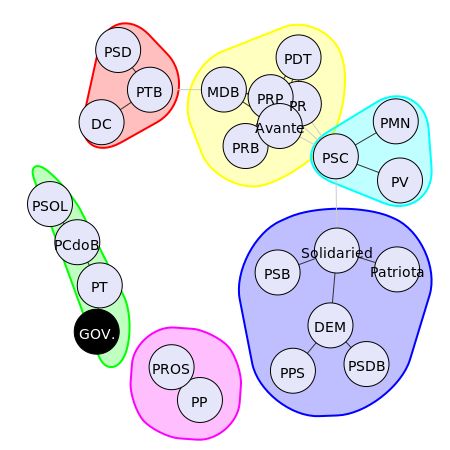
6         Tiago Colliri

    With regards to the time interval T , we opt for using a yearly frequency for
this end, with T ∈ [1998, 2019], respecting the initial and final dates of each
presidency, as listed in Table 1, which results in 22 different political parties
networks generated.

2.3     Presidential Support Evaluation
We evaluate the level of support for each presidency in the House of Repre-
sentatives through two different methods. The first one is based on the actual
legislative voting data for the period, i.e., bills co-sponsorship data, and consid-
ers the votes registered by lawmakers and the respective vote recommended by
the government, in each session, as it has been already made in other similar
studies [25,13]. The second method is based on specific measures extracted from
the built political parties networks, which, as we described above, are based
on data regarding vote recommendations, both from party leaders and from the
government. We proceed this way with the objective of not only making compar-
isons between the two methods, but also with the aim of analyzing both results
from the perspective of the main political events happened during the last two
decades in Brazil.
    In the first method considered, we process all roll-call votes v, made by each
lawmaker i, in each session s, and the level of presidential support, for a period
of time T , is provided by:
              P
                 s f (v)
                P        | f (v) = {vi | vi ∈ v ∧ vi = vg (s)} ∧ st ∈ T ,        (4)
                   s |v|

where vg (s) stands for the vote recommended by the government for session s, st
returns the time t when session s happened, and|v| is the length of array v. Hence,
in another words, this method provides us with the presidential support in the
House measured as the ratio of the number of votes from congressmen following
the respective government recommendation in each session, when compared to
the total number of votes registered during the period.
     For the second method, we extract specific measures from the obtained po-
litical parties networks, and assess the government support in the House based
on these measures, in each period. The network measures considered for this end
are described below:
    – Closeness: a centrality measure, defines how close a vertex is to all other
      vertices in the graph [23], being calculated as the reciprocal of the sum of
      the length of the shortest paths between the node and all other nodes in
      the graph [26]. In the context of this study, a higher closeness centrality for
      the node representing the government in the political parties network will
      indicate a higher level of House support for that presidency.
    – PageRank : also a centrality measure, uses an algorithm originally developed
      for ranking the importance of website pages in the World Wide Web [24].
      In this case, a higher PageRank score for the government, in the political
      parties networks, indicates more support in the House for that presidency.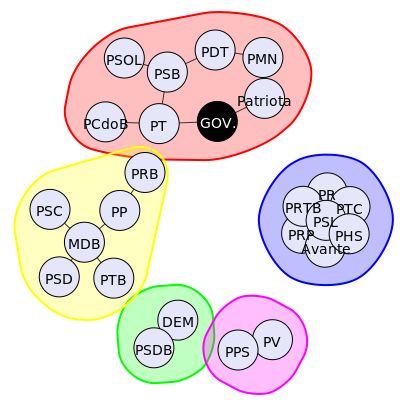
Evaluating Presidential Support in the House Through Networks 7
– Hub Score: also known as the HITS algorithm [7], is based on the idea that
hubs with higher scores represent nodes with links to many other nodes, and
a higher authority score is given to nodes that are linked to many different
hubs. This indicator will be used in the same manner that the centrality
measures described above, with higher scores for the government’s node, in
the political parties networks, indicating a higher support in the House.
– Network Density: describes the portion of the potential connections in a net-
work that are actual connections or, in another words, the total number of
links over the maximum possible number of links [3]. Differently from the
others above, which are analyzed from the node level, this measure is ex-
tracted for the whole network, and has already been used in other similar
studies, mainly for assessing and comparing connections within political par-
ties [31,18,30]. In this work, we used it as an indicator of how connected are
the political parties and also the government in the built networks, for each
presidency, with less connections indicating a more divided and fragmented
House, hence resulting in more difficulties for the president in obtaining bills
approval support.
3 Results and Discussion
In this section, we present the results obtained when applying the two considered
approaches on the built database, comprising real voting data from around 21
years of legislative work in the Brazilian House of Representatives.
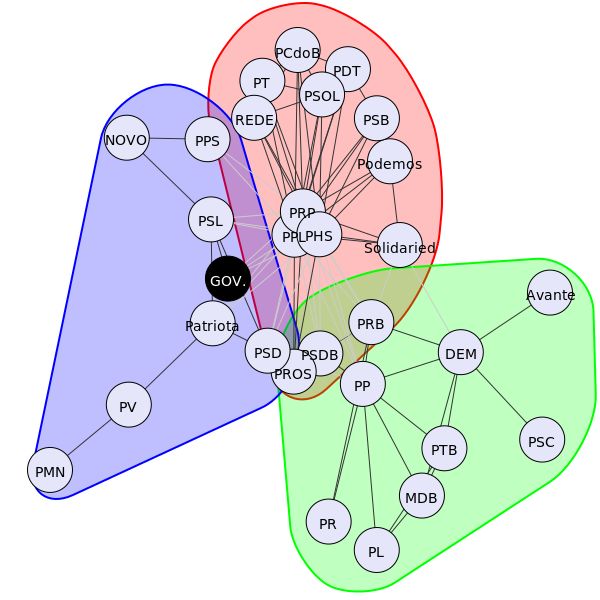
We start by showing, in Fig. 1, some examples of the political parties networks
generated by the network-based approach, for each year. To help in the analysis,
we have also applied the fastgreedy algorithm [4] to detect communities in the
networks. The node representing the government is highlighted in black. As one
can observe, as a general rule in these networks, the position of the government’s
node is highly influenced by the party currently in power. In the first graph, for
instance, the presidency was from PSDB party, which results in the government’s
node being directly connected to this party in the network. This same feature
can be observed in the graphs from other periods as well, with the node from
the government always being closer to the party currently in the presidency, and
also to other parties that supported that presidency, in each year.
Still regarding Fig. 1, we would like to call a special attention to the com-
munities, which, in this case, can be seen as groups of parties that share similar
political views, based on the vote recommendations from their leaders in the
sessions, for each period. Therefore, for those who are somewhat familiar with
the political scenario in Brazil for the last 20 years, it is easy to notice the for-
mation of some sort of “expected” aggregations in these networks topological
structures. Historical left wing parties, for instance, such as PT, PCdoB. PSB,
PDT and PSOL, oftentimes share the same cluster in the networks, in different
periods, thus confirming their respective ideological affinities through legislative
data. The same observation can also be made for parties historically more as-
sociated to right wing political views, such as DEM (former PFL), PL, PP and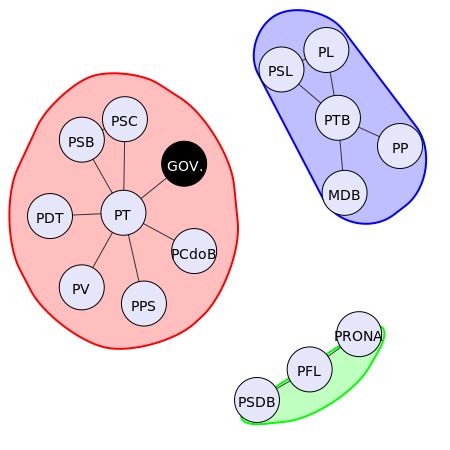
8         Tiago Colliri

    (a) 1998 (FHC I - PSDB)    (b) 2002 (FHC II - PSDB)        (c) 2004 (Lula I - PT)

     (d) 2009 (Lula II - PT)    (e) 2012 (Dilma I - PT)       (f) 2014 (Dilma II - PT)

     (g) 2016 (Temer - MDB)                               (h) 2019 (Bolsonaro - PSL)

Fig. 1. Examples of the political parties networks generated in our analysis, based on
the party leaders vote recommendations in the House of Representatives, in each year.
The communities are detected using the fastgreedy algorithm. The vertex representing
the government is highlighted in black.
Evaluating Presidential Support in the House Through Networks 9
PSL. These results are overall consistent with those obtained in previous works,
using the same type of data but a different methodology [29,33]. However, there
are also some unexpected formations resulting from these topological structures,
such as the fact that the PT and DEM parties share the same community in
the network for 2009, in Fig. 1(d), which means that the vote recommendations
from their party leaders, in this specific year, were not as different as they were
in other years.
(a) Closeness (b) PageRank
(c) Hub Score (d) Network Density
Fig. 2. Support in the House for each presidency, assessed according to two different
methods, for the same period. The first method (in blue) is based on the House members
co-sponsorship historical data. The second one (in green) is based on specific measures
extracted from the built political parties networks: (a) Closeness, (b) PageRank, (c)
Hub Score and (d) Network Density
Let us now proceed to Fig. 2, where we have four plots showing the evolution
of the presidential support in the House, evaluated according to the two methods
tested in this study. The first method, denoted by the blue color in the plots, is
based on co-sponsorship legislative data, considering the ratio of votes registered10 Tiago Colliri
by congressmen following the respective recommendation from the government,
in each session, when compared to the total number of votes recorded within the
period of each presidency. The second method tested, represented by the green
color in the plots, is based on specific measures extracted from the built political
parties networks, with their respective yearly values being averaged, for each
presidency. The green line in the first three plots, in Figs. 2(a), 2(b) and 2(c),
shows the evolution of each respective measure for the node represented by the
government in the networks. Hence, in this form of analysis, the higher the value
of each measure in these plots, the higher is the support for that presidency in
the House. While, in Fig. 2(d), the density measure is extracted for the whole
network and, in this case, less dense networks mean less connections between the
nodes and, within this context, indicate a more divided and fragmented House
of Representatives, often resulting in more difficulties for the president to build
stable coalitions for controlling the House voting agenda.
As one can observe, in Fig. 2, although being based on different approaches,
both methods overall still present some similar features regarding the evolution of
the presidential support in the House during the considered period. Three of the
plots show an initial peak for the presidential support evolution, in the FHC II
government, followed by a descending behavior, in the Lula presidency, with the
only exception for this rule being the analysis based on the Hub Score indicator.
This same phenomenon is also observed in previous researches, using the same
type of data but different methodologies [8,33]. Another common feature in these
analyses is in the fact that all indicators present a descending movement in the
first and second terms of the Dilma presidency, indicating that the support
in the House was lower during this period, when compared to other ones. This
phenomenon makes sense whereas one take into account the fact that the second
term of Dilma was interrupted in December 2015, because of the impeachment
process, with Temer officially assuming the presidency in August 2016. These
results are also in line with those obtained by other researchers, using the same
data [19].
Another interesting characteristic that can be noted in Fig. 2 is the indication
that the second term of Lula had more support in the House than the first one,
according to the analyses based on Closeness, PageRank and co-sponsorship
voting data. Again, this same feature has also been observed in a previous study
[33], using similar data but a different methodology. There is also the indication
that the Bolsonaro presidency has more support in the House than its predecessor
Temer, according to the same analysis techniques mentioned earlier plus the
one based on Network Density. Additionally, still according to this measure,
one can notice that, as Fig. 2(d) indicates, the level of fragmentation among
political parties in the House has been increasing since the last term of FHC,
reaching its peak during the Temer government, i.e., the bottom in terms of the
network density measure, and with a slight pullback in the Bolsonaro presidency.
A less dense network, in this context, suggests the incidence of more partisanship
and non-cooperation among parties and, consequently, more difficulties for the
government to obtain support in the House during the last two decades. ThisEvaluating Presidential Support in the House Through Networks 11
result corroborates as well with those obtained by previous studies, although for
US voting data [2,22,17,20].
225000
votes following party recommendation
200000 votes different from recommendation
175000
150000
125000
Votes
100000
75000
61% 70%
50000 62%
25000 57% 60%
60% 53% 62% 65%
60% 63% 72% 63%
59% 58%
0
MDB
PT
PSDB
PP
PR
PTB
DEM
PSB
PDT
PSD
PPS
PCdoB
PRB
PSC
PV
Fig. 3. Total votes and loyalty rates for the 15 political parties with highest number
of votes in the Brazilian House of Representatives, for the period of 01-01-1998 until
07-12-2019. Only currently active parties are considered for generating this figure.
We have seen, in Fig. 2, that despite the methods used for evaluating the
support for each presidency in the House are different, with one being based
on actual voting data and the other being based on the networks built from
party leaders vote recommendations, they still present similar features overall,
in terms of the evolution of the support in different presidencies. However, the
occurrence of such similarities is only possible if lawmakers actually follow the
vote recommendations from their respective party leaders, otherwise the analyses
resulting from both methods would be completely different. Therefore, to better
understand the results, we present, in Fig. 3, the respective loyalty rates for
the main political parties in Brazil, in terms of total number of votes in House
sessions during the period considered in this study. Only currently active parties
are included in this figure. Overall, the average level of loyalty for the 15 parties
is 62%. The parties with the highest loyalty rates are PCdoB and PT, with 72%
and 70% of the votes following the recommendation from their leaders during
the period, respectively. If we analyze these data also taking into account the
total number of votes, the main parties in the House during the period would be
MDB, PT and PSDB, with MDB and PSDB having similar loyalty rates, of 61%12 Tiago Colliri
and 62%, respectively. In this aspect, and disconsidering political ideologies, the
ideal situation for a government hence would be to receive support, through the
formation of coalitions, from political parties that not only have a large number
of seats in the House, but that also present a higher rate of loyalty from their
members to the parties leaderships, in terms of voting.
4 Final Remarks
In this study, we evaluated the government support in the Brazilian House of
Representatives by testing two different methods on data comprising the legisla-
tive sessions occurred in the period between 1998 and 2019. The obtained results
indicate that the proposed network-based approach is valid, given that, although
being different from the more traditional method also tested in this study, which
is based solely on co-sponsorship voting data, it was still able to present many
common features with the latter, when assessing the support in the House for
each presidency during the considered period. Additionally, as this is essentially
a graphical approach, there is also the possibility of taking advantage of this
as a supplementary resource for both enriching and facilitating the analysis, as
we have demonstrated in Fig. 1, by presenting the networks generated by the
model. Moreover, we also found that most of the results obtained in this work,
regarding the ideological similarities between political parties and the evolution
of the government support in the House, in each presidency, are in line with the
ones achieved by previous relevant studies in this field, based on the same type
of data but using different methodologies.
As future works, we plan to further explore the built database by making ad-
ditional analyses regarding the political parties and presidential support. Among
these possibilities, we can mention: to verify the existence of a possible corre-
lation between presidential support and the number of government-sponsored
bills that were approved in the House, in the same period; to perform analyses
based on each type of bill, to find out which types of legislation are more likely
to receive support from the members of the House; and also to make a more
detailed study regarding the formation of interest groups (or caucus) among the
congressmen and/or their respective parties.
References
1. Andris, C., Lee, D., Hamilton, M.J., Martino, M., Gunning, C.E.,
Selden, J.A.: The rise of partisanship and super-cooperators in
the U.S. House of Representatives. PLoS One 10(4), 1–14 (2015).
https://doi.org/https://doi.org/10.1371/journal.pone.0123507
2. Aref, S., Neal, Z.: Detecting coalitions by optimally partitioning signed networks
of political collaboration. Scientific Reports 10(1), 1–10 (2020)
3. Barabási, A.L., et al.: Network Science. Cambridge University Press (2016)
4. Brandes, U.: A faster algorithm for betweenness centrality. Journal of Mathemat-
ical Sociology 25(2), 163–177 (2001)Evaluating Presidential Support in the House Through Networks 13
5. Bursztyn, V.S., Nunes, M.G., Figueiredo, D.R.: How Brazilian congressmen con-
nect: homophily and cohesion in voting and donation networks. Journal of Complex
Networks 8(1), cnaa006 (2020)
6. Câmara: Dados Abertos. [accessed on August 1, 2019] (2019), https://
dadosabertos.camara.leg.br/
7. Chakrabarti, S., Dom, B., Raghavan, P., Rajagopalan, S., Gibson, D., Kleinberg, J.:
Automatic resource compilation by analyzing hyperlink structure and associated
text. Computer Networks and ISDN Systems 30(1-7), 65–74 (1998)
8. Cheibub, J.A., Figueiredo, A., Limongi, F.: Political parties and governors as deter-
minants of legislative behavior in Brazil’s Chamber of Deputies, 1988–2006. Latin
American Politics and Society 51(1), 1–30 (2009)
9. Cheibub, J.A., Limongi, F.: Legislative-executive relations. Comparative Consti-
tutional Law (12), 211 (2011)
10. Colliri, T., Ji, D., Pan, H., Zhao, L.: A network-based high level data classification
technique. In: 2018 International Joint Conference on Neural Networks (IJCNN).
pp. 1–8. IEEE (2018)
11. Colliri, T., Zhao, L.: Analyzing the bills-voting dynamics and predicting
corruption-convictions among Brazilian congressmen through temporal networks.
Scientific Reports 9(1), 1–11 (2019)
12. Csardi, G., Nepusz, T., et al.: The igraph software package for complex network
research. InterJournal, Complex Systems 1695(5), 1–9 (2006)
13. Dal Maso, C., Pompa, G., Puliga, M., Riotta, G., Chessa, A.: Voting behavior,
coalitions and government strength through a complex network analysis. PLoS
One 9(12), e116046 (2014)
14. Epstein, D., Fowler, J., O’Halloran, S.: Co-sponsorship networks of minority-
supported legislation in the House. In: Annual Meeting of the American Political
Science Association, Philadelphia, Pennsylvannia (2006)
15. Fischer, M., Varone, F., Gava, R., Sciarini, P.: How MPs ties to interest groups
matter for legislative co-sponsorship. Social Networks 57, 34–42 (2019)
16. Kirkland, J.H., Gross, J.H.: Measurement and theory in legislative networks: The
evolving topology of Congressional collaboration. Social Networks 36(1), 97–109
(2014). https://doi.org/https://doi.org/10.1016/j.socnet.2012.11.001
17. Layman, G.C., Carsey, T.M., Horowitz, J.M.: Party polarization in American poli-
tics: Characteristics, causes, and consequences. Annual Review of Political Science
9(1), 83–110 (2006). https://doi.org/10.1146/annurev.polisci.9.070204.105138
18. Lietz, H., Wagner, C., Bleier, A., Strohmaier, M.: When politicians talk: Assessing
online conversational practices of political parties on Twitter. In: Proceedings of
the International AAAI Conference on Web and Social Media. vol. 8 (2014)
19. Marenco, L., Carmona, H.A., Cardoso, F.M., Andrade Jr, J.S., Lenz Cesar, C.:
Time evolution of the behaviour of Brazilian legislative representatives using a
complex network approach. PLoS One 15(2), e0226504 (2020)
20. Moody, J., Mucha, P.J.: Portrait of political party polarization. Network Science
1(1), 119–121 (2013). https://doi.org/10.1017/nws.2012.3
21. Neal, Z.: The backbone of bipartite projections: Inferring relationships from co-
authorship, co-sponsorship, co-attendance and other co-behaviors. Social Networks
39, 84–97 (2014)
22. Neal, Z.P.: A sign of the times? Weak and strong polarization in the US Congress,
1973–2016. Social Networks 60, 103–112 (2020)
23. Okamoto, K., Chen, W., Li, X.Y.: Ranking of closeness centrality for large-scale
social networks. In: International Workshop on Frontiers in Algorithmics. pp. 186–
195. Springer (2008)14 Tiago Colliri
24. Page, L., Brin, S., Motwani, R., Winograd, T.: The pagerank citation ranking:
Bringing order to the web. Tech. rep., Stanford InfoLab (1999)
25. Prins, B.C., Shull, S.A.: Enduring rivals: Presidential success and support in the
house of representatives. In: Congress & the Presidency: A Journal of Capital
Studies. vol. 33, pp. 21–46. Taylor & Francis (2006)
26. Sabidussi, G.: The centrality index of a graph. Psychometrika 31(4), 581–603
(1966)
27. Silva, T.C., Zhao, L.: Network-based high level data classification. Neural Networks
and Learning Systems, IEEE Transactions on 23(6), 954–970 (2012)
28. Strogatz, S.H.: Exploring complex networks. Nature 410(6825), 268–276 (2001)
29. Tsai, T.h.: The influence of the president and government coalition on roll-call
voting in Brazil, 2003–2006. Political Studies Review p. 1478929920904588 (2020)
30. Verweij, P.: Twitter links between politicians and journalists. Journalism Practice
6(5-6), 680–691 (2012)
31. Victor, J.N., Ringe, N.: The social utility of informal institutions: Caucuses as
networks in the 110th US House of Representatives. American Politics Research
37(5), 742–766 (2009)
32. Waugh, A.S., Pei, L., Fowler, J.H., Mucha, P.J., Porter, M.A.: Party polarization
in Congress: A network science approach. arXiv preprint arXiv:0907.3509 (2009)
33. Zucco Jr, C., Lauderdale, B.E.: Distinguishing between influences on Brazilian
legislative behavior. Legislative Studies Quarterly 36(3), 363–396 (2011)You can also read