Keeping our heads above water: A systematic review of fatal drowning in South Africa - (SciELO) SA
←
→
Page content transcription
If your browser does not render page correctly, please read the page content below
This open-access article is distributed under
               Creative Commons licence CC-BY-NC 4.0.                                                                          RESEARCH

Keeping our heads above water: A systematic review
of fatal drowning in South Africa
C J Saunders,1,2,3 BSc (Med) Hons, PhD; D Sewduth,2 MEd, MDP; N Naidoo,3 N Dip AEC, BTech EMC, H Dip Ed, MPH

1
  Division of Emergency Medicine, Department of Surgery, Faculty of Health Sciences, University of Cape Town, South Africa
2
  Lifesaving South Africa, Durban, South Africa
3
  Department of Emergency Medical Sciences, Faculty of Health and Wellness Sciences, Cape Peninsula University of Technology, Cape Town, South Africa

Corresponding author: C J Saunders (c.saunders@uct.ac.za)

    Background. Drowning is defined as the process of experiencing respiratory impairment from submersion/immersion in liquid, and
    can have one of three outcomes – no morbidity, morbidity or mortality. The World Health Organization African region accounts for
    approximately 20% of global drowning, with a drowning mortality rate of 13.1 per 100 000 population. The strategic implementation of
    intervention programmes driven by evidence-based decisions is of prime importance in resource-limited settings such as South Africa (SA).
    Objective. To review the available epidemiological data on fatal drowning in SA in order to identify gaps in the current knowledge base
    and priority intervention areas.
    Methods. A systematic review of published literature was conducted to review the available epidemiological data describing fatal drowning
    in SA. In addition, an internet search for grey literature, including technical reports, describing SA fatal drowning epidemiology was
    conducted.
    Results. A total of 13 published research articles and 27 reports obtained through a grey literature search met the inclusion and exclusion
    criteria. These 40 articles and reports covered data collection periods between 1995 and 2016, and were largely focused on urban settings.
    The fatal drowning burden in SA is stable at approximately 3.0 per 100 000 population, but is increasing as a proportion of all non-natural
    deaths. Drowning mortality rates are high in children aged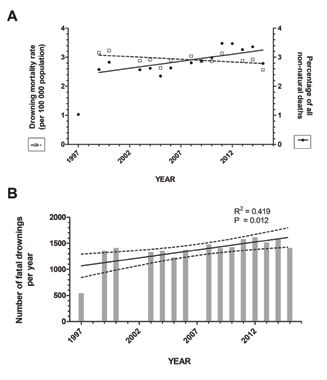
RESEARCH
Table 1. Systematic search strategy and results†
Cochrane Web of Science
Search terms Library, n Scopus, n Science, n Direct, n Medline, n EBSCOhost‡, n Safety Lit, n
Searched in: All text All text Title, abstract, All text All text All text Textword(s)
keywords exact
1 ‘South Africa’ 773 96 313 53 917 221 449 64 546 881 228 1 554
Searched in: Title, abstract, Title, abstract, Title, abstract, Title, abstract, Title, abstract Abstract Textword +
keywords keywords keywords keywords synonyms
2 ‘Drown*’ 6 8 256 3 961 2 100 2 826 11 227 2 161
3 ‘Immersion 2 19 8 16 7 14 3
injur*’
4 ‘Submersion 0 59 43 26 32 58 28
injur*’
5 2 OR 3 OR 4 6 8 276 3 987 2 120 2 848 11 275 2 177
6 1 AND 5 1 67 57 73 18 211 13
Unduplicated total n=221
*Asterisks indicate wildcard characters in Boolean searches in order to capture all spelling variations.
†
All searches were limited to articles published in English between 1995 (inclusive) and the search date (March 2017). Where applicable, limits were set to studies involving humans only.
‡
When searching the EBSCO database, the following databases were selected: Academic Search Premier; Africa Wide Information; CINAHL; General Science Abstracts; Medline; PsyInfo.
(http://www.lifesaving.co.za/) were searched
Research articles identified Grey literature identified Research articles identified
through database search, through targeted internet search, from bibliographies, for relevant data using a search strategy
IDENTIFICATION
N=221 N=4 N=35
specific to the context of each website.
Epidemiological data collected before 1994
were excluded. Twenty-seven additional
Excluded after reading titles
and abstracts,
sources of information were screened and
n=198 included in this review (Table 3). These
included public or technical reports from
Stats SA, the SAMRC Violence, Injury and
SCREENING
Peace Research Unit (VIPRU) and LSA.
Full text screened for eligibility, Full text screened for eligibility, Full text screened for eligibility, There was a large variation in design, data
n=23 n=4 n=35
collection and reporting in the retrieved
information, and consequently direct com
parison and meta-analysis were not possible.
Where appropriate, descriptive statistics
DATA CAPTURING
Excluded after reviewing full text, Excluded after reviewing full text, Excluded after reviewing full text,
n=10 n=4 n=8
including means and standard deviations
(SDs) were computed in Microsoft Excel
(Microsoft Office for Mac 2011, version
Data sources included, n=40
14.6.7, Microsoft, USA), and linear regres
sion was performed using GraphPad PRISM
Fig. 1. Flow diagram indicating the systematic search strategy for studies and data sources included in (version 5.02, GraphPad Software, USA).
this review. This systematic search was conducted in accordance with PRISMA guidelines for systematic
review analysis.[60] Results
The systematic search and review strategy
were collected in or before 1994 for three which were submitted to the same review retrieved 13 published research articles,
reasons: (i) the historical exclusion of data process before inclusion. Thirteen published and a further 27 reports obtained through
from the former homeland states during research articles were included in this review a grey literature search, that met the
the apartheid era;[10] (ii) the recognised (Table 2). inclusion and exclusion criteria (Fig. 1).
under-registration of deaths in the black In addition, an internet search for grey These 40 articles and reports covered data
population during the apartheid era;[11] and literature describing SA fatal drowning collection periods between 1995 and 2016,
(iii) the effects of migrant labour on the epidemiology was conducted (March 2017). and were largely focused on urban settings.
estimation of population size during this The websites of Statistics South Africa (Stats Drowning surveillance was the primary aim
time.[12] The full text of remaining articles SA; www.statssa.gov.za), the South African in only seven of the included articles and
was reviewed by two authors separately. Medical Research Council (SAMRC; www. reports.[13-19]
Where it was possible to separate the data, mrc.ac.za), the SA government departments
only data on unintentional drowning were of Home Affairs (http://www.home-affairs. The drowning burden in SA
included. Where it was not possible to gov.za) and Health (www.health.gov.za), the In the included articles and reports, the
separate the data, this is noted in the results. South African Police Service (www.saps. majority of data reported were sourced from
The bibliographies of included articles were gov.za), the National Sea Rescue Institute Stats SA (n=12) and the SAMRC-VIPRU
screened for additional articles of relevance, (NSRI; http://www.nsri.org.za/) and LSA National Injury Mortality Surveillance Sys
62 January 2018, Vol. 108, No. 1RESEARCH
Table 2. List of published articles included in this review (n=13)
Author Year Title
Burrows et al.[39] 2009 Adolescent injuries in urban South Africa: A multi-city investigation of intentional and
unintentional injuries
Burrows et al.[38] 2010 Fatal injuries among urban children in South Africa: Risk distribution and potential for reduction
Donson and Van Niekerk[16] 2013 Unintentional drowning in urban South Africa: A retrospective investigation, 2001 - 2005
Garrib et al.[53] 2011 Injury mortality in rural South Africa 2000 - 2007: Rates and associated factors
Groenewald et al.[42] 2016 Linking mortuary data improves vital statistics on cause of death of children under five years in
the Western Cape Province of South Africa
Lin et al.[17] 2015 Unintentional drowning mortality, by age and body of water: An analysis of 60 countries
Lu et al.[13] 2010 Quality of cause-of-death reporting using ICD-10 drowning codes: A descriptive study of
69 countries
Meel[14,50] 2008 Drowning deaths in Mthatha area of South Africa (plus erratum)
Meel[51] 2008 Unnatural deaths among children in the Transkei region of South Africa
Morris et al.[15] 2016 Drowning in Pretoria, South Africa: A 10-year review
Pretorius and Van Niekerk[40] 2015 Childhood psychosocial development and fatal injuries in Gauteng, South Africa
Reid et al.[41] 2016 Where do children die and what are the causes? Under-5 deaths in the Metro West geographical
service area of the Western Cape, South Africa, 2011
Streatfield et al.[52] 2014 Mortality from external causes in Africa and Asia: Evidence from INDEPTH Health and
Demographic Surveillance System Sites
Table 3. List of grey literature and reports included in this review (n=27)
Author/authoring
body Year Title
MRC-UNISA[32] 2003 A profile of fatal injuries in South Africa: Fourth annual report of the National Injury Mortality Surveillance
System 2002
MRC-UNISA[33] 2004 A profile of fatal injuries in South Africa: Fifth annual report 2003 of the National Injury Mortality
Surveillance System
MRC-UNISA[34] 2005 A profile of fatal injuries in South Africa: Sixth Annual report of the National Injury Mortality Surveillance
System 2004
MRC-UNISA[36] 2008 A profile of fatal injuries in South Africa 2007
MRC-UNISA[37] 2009 A profile of fatal injuries in South Africa 2008
MRC-UNISA[43] 2009 A profile of fatal injuries in Mpumalanga
MRC-UNISA[47] 2010 A profile of fatal injuries in Gauteng 2009
MRC-UNISA[45] 2012 A profile of fatal injuries in Mpumalanga 2010
MRC-UNISA[46] 2013 A profile of fatal injuries in Mpumalanga 2011
MRC-UNISA[49] 2013 A profile of fatal injuries in Gauteng 2011
Stats SA[20] 2005 Mortality and causes of death in South Africa, 1997-2003: Findings from death notification (P0309.3)
Stats SA[21] 2006 Mortality and causes of death in South Africa, 2003 and 2004: Findings from death notification (P0309.3)
Stats SA[22] 2007 Mortality and causes of death in South Africa, 2005: Findings from death notification (P0309.3)
Stats SA[23] 2008 Mortality and causes of death in South Africa, 2006: Findings from death notification (P0309.3)
Stats SA[24] 2010 Mortality and causes of death in South Africa, 2008: Findings from death notification (P0309.3)
Stats SA[25] 2011 Mortality and causes of death in South Africa, 2009: Findings from death notification (P0309.3)
Stats SA[26] 2013 Mortality and causes of death in South Africa, 2010: Findings from death notification (P0309.3)
Stats SA[27] 2014 Mortality and causes of death in South Africa, 2011: Findings from death notification (P0309.3)
Stats SA[28] 2014 Mortality and causes of death in South Africa, 2012: Findings from death notification (P0309.3)
Stats SA[29] 2014 Mortality and causes of death in South Africa, 2013: Findings from death notification (P0309.3)
Stats SA[30] 2015 Mortality and causes of death in South Africa, 2014: Findings from death notification (P0309.3)
Stats SA[31] 2017 Mortality and causes of death in South Africa, 2015: Findings from death notification (P0309.3)
MRC-UNISA = MRC-UNISA Crime, Violence and Injury Lead Programme; Stats SA = Statistics South Africa.
tem (NIMSS) (n=17), both of which are based on vital registration (SD 81) fatal drownings per year, with a mean drowning mortality
records. Fig. 2 shows the number of fatal accidental drownings per rate of 2.87 (0.23) per 100 000 population (Fig. 2). Although the
year as indicated in the annual Stats SA P0309.3 report on mortality absolute number of fatal drownings increased significantly between
and causes of death in SA between 1997 and 2015.[20-31] In the most 1999 and 2015 (r2=0.419; p=0.012), the drowning mortality rate
recent 5 years between 2011 and 2015, there was an average of 1 541 per 100 000 population remained consistent (r2=0.243; p=0.087).
63 January 2018, Vol. 108, No. 1RESEARCH
A performed a 10-year retrospective review of drowning mortality
(both intentional and unintentional) in Pretoria and reported 278
confirmed drowning fatalities between 2002 and 2011, representing
Drowning mortality rate,
per 100 000 population
1.2% of the caseload for the relevant inland, urban medicolegal
unnatural deaths, %
Proportion of all
laboratory.
Three published articles analysed NIMSS data to describe fatal
injury epidemiology in SA children specifically. Burrows and
colleagues investigated fatal injuries in children (0 - 14 years) [38] and
adolescents (10 - 19 years)[39] in six South African cities (Buffalo City,
Cape Town, Johannesburg, eThekwini, Tshwane, Nelson Mandela
1997 2002 2007 2012 Metro) between 2001 and 2003. The age-adjusted unintentional
Year drowning mortality rate across all six cities was 5.3 per 100 000
B population for male children and 2.1 per 100 000 for female
r2=0.419
children. [38] Drowning mortality rates differed considerably across
p=0.012
2 000 cities, ranging from 2.2 per 100 000 population in Cape Town to
Fatal drownings per year, n
9.2 per 100 000 in Buffalo City; however, drowning was in the top
1 500
five causes of fatal injury across all six cities.[38] The population-
1 000 attributable risk for drowning in children was high for both sex
and city, indicating substantial potential for risk reduction.[38] In
500 adolescents, drowning accounted for approximately a third of non-
transport-related unintentional injuries (males 34%, females 27%). [39]
0
Pretorius and Van Niekerk[40] investigated the occurrence of injury
1997 2002 2007 2012
mortality in Gauteng Province in children (0 - 19 years of age), where
Year
drowning represented 8.9% of the total fatal injury burden between
Fig. 2. Trends in (A) drowning mortality rate and the proportion of non- 2008 and 2011. Two studies used the Western Cape local mortality
natural deaths made up by drowning, and (B) the number of drowning surveillance system to describe causes of death in young children
fatalities reported annually by Statistics South Africa. Data were extracted in the Western Cape.[41,42] In 2011, drowning accounted for 2.8% of
from the StatsSA annual P0309.3 reports on mortality and causes of death in deaths in children agedRESEARCH
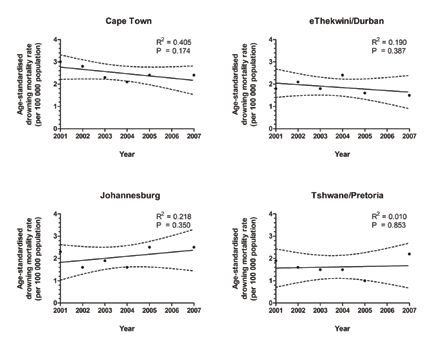
children aged 5 - 14 years (2.9 per 100 000,
Cape Town eThekwini/Durban 95% CI 2.7 - 3.1). [17] Similarly, the NIMSS
r2=0.405 r2=0.190 annual reports consistently report the highest
p=0.174 p=0.387
drowning mortality rate,
drowning mortality rate,
per 100 000 population
per 100 000 population
proportion of drowning fatalities occurring
Age-standardised
Age-standardised
in the age group 1 - 4 years (Table 4). In
Donson and Van Niekerk’s[16] city-level
analysis of NIMSS data, the highest age-
adjusted drowning mortality rates were 6.3
per 100 000 population in children aged 0 - 4
years, and 2.2 per 100 000 in children aged
Year Year
5 - 14 years. The age group 0 - 4 years had the
highest drowning mortality rate in all five
Johannesburg Tshwane/Pretoria cities investigated, the rate being particularly
r =0.218
2
r2=0.010
high in the inland cities of Johannesburg
p=0.350 p=0.853 (9.3 per 100 000 population) and Pretoria
drowning mortality rate,
drowning mortality rate,
per 100 000 population
per 100 000 population
(6.9 per 100 000).[16] In a separate analysis of
Age-standardised
Age-standardised
drowning in Pretoria, 19% of all drowning
fatalities occurred in the age group 1 - 2
years and 15% occurred in children agedRESEARCH children. In Pretoria, 79% of fatal drowning victims were male. [15] global drowning estimates (7.4 per 100 000 population).[1] However, The male-to-female ratio ranged between 2.8[14] and 4.0,[16] and there is a large variation in global drowning mortality, with drowning was highest in the 45 - 59, 15 - 29 and 30 - 44 years age groups. [16] rates in low- and middle-income countries reported to be over three Donson and Van Niekerk[16] reported an age-adjusted drowning times higher than those in high-income countries.[2] In an analysis mortality rate of 3.4 per 100 000 population in males compared with of 60 countries, SA ranked 21st in all-age drowning mortality but 0.9 per 100 000 in females in an urban setting. This was consistent among the top 10 for child drowning mortality.[17] with observations in a rural setting, where Garrib et al.[53] reported Drowning mortality rates are high in SA children aged
RESEARCH
The ratio of male-to-female drowning reported here is higher than system including first-response organisations, local government,
that reported globally, where males are generally twice as likely to hospital emergency departments and forensic departments as well
drown as females, but is consistent with the higher drowning prevalence as a co-ordinating body such as the National Department of Health
in males globally.[1,2] The high ratio of male to female drowning is or a national water safety authority.
particularly pronounced in adulthood, and this observation may be
explained by increased risk-taking behaviour in males, particularly Acknowledgements. None.
in teenagers and during early adulthood.[59] This is supported by the Author contributions. CJS contributed to the conception and design of the
observation that adult males were more likely than females to be work, data acquisition and analysis, interpretation of the data and drafting
under the influence of alcohol at the time of death. There were limited
the manuscript. DS contributed to the conception of the work and critical
data describing drowning risk factors other than sex and age. The
revision of the manuscript. NN contributed to data analysis, interpretation
prevalence of drowning was highest in the warmer summer months,
of the data and critical revision of the manuscript. All authors approved
during weekends and during the mid- to late afternoon. Although
no exposure data are available, it can reasonably be hypothesised the final version of this manuscript and accept responsibility for the
that this pattern reflects the higher exposure during these times. The accuracy and integrity of this work.
limited data available suggest that ~40% of drowning victims, males Funding. The work reported did not require project funding.
in particular, will test positive for blood alcohol at the time of death. Conflicts of interest. None.
Globally, alcohol use around bodies of water has been identified as a
significant risk factor for drowning in adolescents and adults.[2] 1. Peden MM, McGee K. The epidemiology of drowning worldwide. Inj Control Saf Promot
2003;10(4):195-199. https://doi.org/10.1076/icsp.10.4.195.16772
Study limitations 2. World Health Organization. Global Report on Drowning: Preventing a Leading Killer. Geneva: WHO,
2014. http://www.who.int/violence_injury_prevention/global_report_drowning/en/ (accessed 15 Janu
There are several limitations to the data presented in this review. ary 2017).
3. Idris AH, Berg RA, Bierens J, et al. Recommended guidelines for uniform reporting of data from
First, the majority of the data included were extracted from vital drowning. Circulation 2003;108(20):2565-2574. https://doi.org/10.1161/01.CIR.0000099581.70012.68
registration records or medicolegal autopsy records and therefore 4. Suominen PK, Vähätalo R. Neurologic long term outcome after drowning in children. Scand J Trauma
Resusc Emerg Med 2012;20(55):1-7. https://doi.org/10.1186/1757-7241-20-55
exclude cases where the body was not recovered after drowning. [17] 5. Joanknecht L, Argent AC, van Dijk M, van As AB. Childhood drowning in South Africa: Local data
Such cases are likely to be biased towards drowning incidents in large should inform prevention strategies. Pediatr Surg Int 2015;31(2):123-130. https://doi.org/10.1007/
s00383-014-3637-0
bodies of water and may therefore affect the distribution of drowning 6. Department of Health Statistics and Information Systems. WHO Methods and Data Sources for
Country-level Causes of Death. Geneva: World Health Organization, 2014. http://www.who.int/
across locations. Second, there is inconsistency in the separation and healthinfo/statistics/GlobalCOD_method.pdf (accessed 15 January 2017).
annotation of unintentional and intentional drowning incidents. 7. Finch C. A new framework for research leading to sports injury prevention. J Sci Med Sport 2006;9(1-
2):3-9. https://doi.org/10.1016/j.jsams.2006.02.009
Although this review has attempted to include only data relating 8. World Health Organization. Preventing Drowning: An Implementation Guide. Geneva: WHO, 2017.
to unintentional drowning, there are cases noted in the results http://www.who.int/violence_injury_prevention/drowning/drowning_prevention_guide/en/ (accessed
29 April 2017).
where it was not possible to do so. Donson and Van Niekerk[16] have 9. International Life Saving Federation. World Drowning Report 2007. Leuven: ILSF, 2007. https://ilsf.
previously reported that 79.9% of deaths from drowning in SA were org/drowning-prevention/library/world-drowning-report (accessed 4 December 2017).
10. Kibel SM, Joubert G, Bradshaw D. Injury-related mortality In South African children, 1981 - 1985.
unintentional, and it can therefore be assumed that, where included, S Afr Med J 1990;78:398-403.
11. Botha JL, Bradshaw D. African vital statistics – a black hole? S Afr Med J 1985;67:977-981.
intentional drowning deaths are under-represented in the data. 12. Davis S, Smith LS. The epidemiology of drowning in Cape Town – 1980 - 1983. S Afr Med J
Third, the data presented here are mainly focused on urban SA, and 1985;68:739-742.
13. Lu T-H, Lunetta P, Walker S. Quality of cause-of-death reporting using ICD-10 drowning codes:
data on drowning in rural areas are conspicuous in their paucity. A descriptive study of 69 countries. BMC Med Res Methodol 2010;10:30. https://doi.org/10.1186/1471-
2288-10-30
Conclusions 14. Meel BL. Drowning deaths in Mthatha area of South Africa. Med Sci Law 2008;48(4):329-332. https://
doi.org/10.1258/rsmmsl.48.4.329
The SA public health system is laden with a high infectious 15. Morris NK, du Toit-Prinsloo L, Saayman G. Drowning in Pretoria, South Africa: A 10-year review.
J Forensic Leg Med 2016;37:66-70. https://doi.org/10.1016/j.jflm.2015.10.010
disease burden and a high prevalence of injury, including violence, 16. Donson H, van Niekerk A. Unintentional drowning in urban South Africa: A retrospective
investigation, 2001 - 2005. Int J Inj Contr Saf Promot 2013;20(3):218-226. https://doi.org/10.1080/1
transport-related injuries and burns, and there are limited resources 7457300.2012.686041
for injury prevention programmes outside these high-priority 17. Lin C-Y, Wang Y-F, Lu T-H, Kawach I. Unintentional drowning mortality, by age and body of water: An
analysis of 60 countries. Inj Prev 2015;21(e1):e43-50. https://doi.org/10.1136/injuryprev-2013-041110
areas. It is therefore imperative that drowning prevention initiatives 18. Lifesaving South Africa. Drowning statistics: January 2015 - December 2015. Durban: LSA, 2016.
are evidence-based and effective. This review suggests that SA http://lifesaving.co.za/blog/176/#sthash.IwMVYctl.dpbs (accessed 15 March 2017).
19. Lifesaving South Africa. Drowning statistics: January 2016 - December 2016. Durban: LSA, 2017.
drowning prevention initiatives are currently confined to the http://lifesaving.co.za/download-result.php?filename_download=1483535132drowning-stats-jan-
early stages of an effective injury prevention strategy. The results 2016-dec-2016.pdf (accessed 15 January 2016).
20. Statistics South Africa. Mortality and causes of death in South Africa, 1997 - 2003. Findings from death
presented suggest that drowning mortality and the distribution notification. Statistical release P0309.3. Pretoria: Stats SA, 2005. http://www.statssa.gov.za/?page_
id=1854&PPN=P0309.3&SCH=3337 (accessed 15 March 2017).
of mortality across age groups and drowning location differ 21. Statistics South Africa. Mortality and causes of death in South Africa, 2003 and 2004. Findings
substantially between urban centres and provinces. However, there from death notification. Statistical release P0309.3. Pretoria: Stats SA, 2006. http://www.statssa.gov.
za/?page_id=1854&PPN=P0309.3&SCH=3659 (accessed 15 March 2017).
are few supporting data sources for these findings. In addition, 22. Statistics South Africa. Mortality and causes of death in South Africa, 2005. Findings from death
there is very little exploration of other risk factors such as activity notification. Statistical release P0309.3. Pretoria: Stats SA, 2007. http://www.statssa.gov.za/?page_
id=1854&PPN=P0309.3&SCH=3937 (accessed 15 March 2017).
prior to drowning and the role of alcohol consumption. Evidence 23. Statistics South Africa. Mortality and causes of death in South Africa, 2006 . Findings from death
suggests that epidemiological studies describing specific risk factors notification. Statistical release P0309.3. Pretoria: Stats SA, 2008. http://www.statssa.gov.za/?page_
id=1854&PPN=P0309.3&SCH=4254 (accessed 15 March 2017).
associated with location of, and activity prior to, drowning are 24. Statistics South Africa. Mortality and causes of death in South Africa, 2008. Findings from death
notification. Statistical release P0309.3. Pretoria: Stats SA, 2010. http://www.statssa.gov.za/?page_
needed to inform targeted intervention strategies.[56] Furthermore, id=1854&PPN=P0309.3&SCH=4790 (accessed 15 March 2017).
there is a gap in the evidence base relating to risk factors for adult 25. Statistics South Africa. Mortality and causes of death in South Africa, 2009. Findings from death
notification. Statistical release P0309.3. Pretoria: Stats SA, 2011. http://www.statssa.gov.za/?page_
drowning. There is therefore a need for consistent and detailed id=1854&PPN=P0309.3&SCH=5097 (accessed 15 March 2017).
drowning surveillance in SA in order to monitor national trends 26. Statistics South Africa. Mortality and causes of death in South Africa, 2010. Findings from death
notification. Statistical release P0309.3. Pretoria: Stats SA, 2013. http://www.statssa.gov.za/?page_
as well as identify risk factors in all SA communities and allow id=1854&PPN=P0309.3&SCH=5490 (accessed 15 March 2017).
for temporal and spatial comparison of drowning epidemiology at 27. Statistics South Africa. Mortality and causes of death in South Africa, 2011. Findings from death
notification. Statistical release P0309.3. Pretoria: Stats SA, 2014. http://www.statssa.gov.za/?page_
both a national and international level. This requires a collaborative id=1854&PPN=P0309.3&SCH=5774 (accessed 15 March 2017).
67 January 2018, Vol. 108, No. 1RESEARCH
28. Statistics South Africa. Mortality and causes of death in South Africa, 2012. Findings from death 44. MRC-UNISA Safety and Peace Promotion Research Unit. A profile of fatal injuries in Mpumalanga 2009.
notification. Statistical release P0309.3. Pretoria: Stats SA, 2014. http://www.statssa.gov.za/?page_ 2010. http://www.mrc.ac.za/crime/mpumalanga2009.pdf (accessed 15 March 2017).
id=1854&PPN=P0309.3&SCH=6015 (accessed 15 March 2017). 45. MRC-UNISA Safety and Peace Promotion Research Unit. A profile of fatal injuries in Mpumalanga 2010.
29. Statistics South Africa. Mortality and causes of death in South Africa, 2013. Findings from death 2012. http://www.mrc.ac.za/crime/NIMSSMpumalanga2010.pdf (accessed 15 March 2017).
notification. Statistical release P0309.3. Pretoria: Stats SA, 2014. http://www.statssa.gov.za/?page_ 46. MRC-UNISA Safety and Peace Promotion Research Unit. A profile of fatal injuries in Mpumalanga 2011.
id=1854&PPN=P0309.3&SCH=5955 (accessed 15 March 2017). 2013. http://www.mrc.ac.za/crime/NIMSS2011Mpumalanga.pdf (accessed 15 March 2017).
30. Statistics South Africa. Mortality and causes of death in South Africa, 2014. Findings from death 47. MRC-UNISA Safety and Peace Promotion Research Unit. A profile of fatal injuries in Gauteng 2009.
notification. Statistical release P0309.3. Pretoria: Stats SA, 2015. http://www.statssa.gov.za/?page_ 2010. http://www.mrc.ac.za/crime/gauteng_2009.PDF (accessed 15 March 2017).
id=1854&PPN=P0309.3&SCH=6377 (accessed 15 March 2017). 48. MRC-UNISA Safety and Peace Promotion Research Unit. A profile of fatal injuries in Gauteng 2010.
31. Statistics South Africa. Mortality and causes of death in South Africa, 2015. Findings from death 2012. http://www.mrc.ac.za/crime/NIMSSGauteng2010.pdf (accessed 15 March 2017).
notification. Statistical release P0309.3. Pretoria: Stats SA, 2017. http://www.statssa.gov.za/?page_ 49. MRC-UNISA Safety and Peace Promotion Research Unit. A profile of fatal injuries in Gauteng 2011.
id=1854&PPN=P0309.3&SCH=6987 (accessed 15 March 2017). 2013. http://www.mrc.ac.za/crime/NIMSS2011Gauteng.pdf (accessed 15 March 2017).
32. MRC-UNISA Crime, Violence and Injury Lead Programme. A profile of fatal injuries in South Africa: 50. Meel BL. Erratum. Med Sci Law 2010;49(3):228.
Fourth Annual Report of the National Injury Mortality Surveillance System 2002. 2003. http://www.mrc. 51. Meel BL. Unnatural deaths among children in the Transkei region of South Africa. Med Sci Law
ac.za/crime/nimssannual2002.pdf (accessed 15 March 2017). 2008;48(3):232-236. https://doi.org/10.1258/rsmmsl.48.3.232
33. MRC-UNISA Crime, Violence and Injury Lead Programme. A profile of fatal injuries in South Africa: 52. Streatfield PK, Khan WA, Bhuiya A, et al. Mortality from external causes in Africa and Asia: Evidence
Fifth annual report 2003 of the National Injury Mortality Surveillance System. 2004. http://www.mrc. from INDEPTH health and demographic surveillance system sites. Glob Health Action 2014;7(1).
ac.za/crime/summary2003.pdf (accessed 15 March 2017). https://doi.org/10.3402/gha.v7.25366
34. MRC-UNISA Crime, Violence and Injury Lead Programme. A profile of fatal injuries in South Africa: 53. Garrib A, Herbst AJ, Hosegood V, Newell M-L. Injury mortality in rural South Africa 2000 - 2007:
6th Annual Report of the National Injury Mortality Surveillance System 2004. 2005. http://www.mrc. Rates and associated factors. Trop Med Int Health 2011;16(4):439-446. https://doi.org/10.1111/j.1365-
ac.za/crime/national2004.pdf (accessed 15 March 2017). 3156.2011.02730.x
35. MRC-UNISA Crime, Violence and Injury Lead Programme. A profile of fatal injuries in South Africa: 54. Sewduth D. South Africa: The impact of the absence of legislation governing water safety and drowning
7th Annual Report of the National Injury Mortality Surveillance System 2005. 2007. http://www.mrc. prevention. In: World Water Safety Conference. 2007. https://www.ilsf.org/drowning-prevention/library/
ac.za/crime/national2005.pdf (accessed 15 March 2017). south-africa-impact-absence-legislation-governing-water-safety-and (accessed 15 January 2017).
36. MRC-UNISA Crime, Violence and Injury Lead Programme. A profile of fatal injuries in South Africa 55. Commission on Social Determinants of Health. Closing the gap in a generation: Health equity through
2007. 2008. http://www.mrc.ac.za/crime/nimss07.PDF (accessed 15 March 2017). action on the social determinants of health. Final Report of the Commission on Social Determinants of
37. MRC-UNISA Crime, Violence and Injury Lead Programme. A profile of fatal injuries in South Africa Health. Geneva: CSDH, 2008.
2008. 2009. http://www.mrc.ac.za/crime/nimss2008.pdf (accessed 15 March 2017). 56. Peden AE, Franklin RC, Leggat PA. Fatal river drowning: The identification of research gaps through a
38. Burrows S, van Niekerk A, Laflamme L. Fatal injuries among urban children in South Africa: Risk systematic literature review. Inj Prev 2016;22(3):202-209. https://doi.org/10.1136/injuryprev-2015-041750
distribution and potential for reduction. Bull World Health Organ 2010;88(4):267-272. https://doi. 57. Statistics South Africa. Living conditions of households in South Africa 2008/9. Statistical release P0310.
org/10.2471/BLT.09.068486 Pretoria: Stats SA, 2011. http://www.statssa.gov.za/?page_id=1854&PPN=P0310&SCH=5017 (accessed
39. Burrows S, Swart L-A, Laflamme L. Adolescent injuries in urban South Africa: A multi-city investigation 15 July 2017).
of intentional and unintentional injuries. Int J Child Adolesc Health 2009;2(1):117-129. 58. Christopher L, Naidoo N, Cousins D, Willoughby S. Cape Winelands District Municipality: Community
40. Pretorius K, van Niekerk A. Childhood psychosocial development and fatal injuries in Gauteng, South based risk assessment comprehensive report. Cape Town: Cape Peninsula University of Technology, 2008.
Africa. Child Care Health Dev 2015;41(1):35-44. https://doi.org/10.1111/cch.12140 59. Turner C, McClure R. Age and gender differences in risk-taking behaviour as an explanation for high
41. Reid AE, Hendricks MK, Groenewald P, Bradshaw D. Where do children die and what are the causes? incidence of motor vehicle crashes as a driver in young males. Inj Control Saf Promot 2003;10(3):123-
Under-5 deaths in the Metro West geographical service area of the Western Cape, South Africa, 2011. 130. https://doi.org/10.1076/icsp.10.3.123.14560
S Afr Med J 2016;106(4):359-364. https://doi.org/10.7196/SAMJ.2016.v106i4.10521 60. Moher D, Shamseer L, Clarke M, et al. Preferred reporting items for systematic review and meta-analysis
42. Groenewald P, Bradshaw D, Neethling I, et al. Linking mortuary data improves vital statistics on cause protocols (PRISMA-P) 2015 statement. Syst Rev 2015;4(1):1-9. https://doi.org/10.1186/2046-4053-4-1
of death of children under five years in the Western Cape Province of South Africa. Trop Med Int Health
2016;21(1):114-121. https://doi.org/10.1111/tmi.12624
43. MRC-UNISA Crime, Violence and Injury Lead Programme. A profile of fatal injuries in Mpumalanga.
2009. http://www.mrc.ac.za/crime/fatal_inj08.PDF (accessed 15 March 2017). Accepted 21 August 2017.
68 January 2018, Vol. 108, No. 1You can also read