Parametric Policy Proposal for Ambernϊa and Palȍmϊnϊa - Alex Farrar Eric Herbst Michael Mosley - SOA.org
←
→
Page content transcription
If your browser does not render page correctly, please read the page content below

=

      Parametric
    Policy Proposal
     for Ambernϊa
    and Palȍmϊnϊa

           Alex Farrar
           Eric Herbst
        Michael Mosley

               1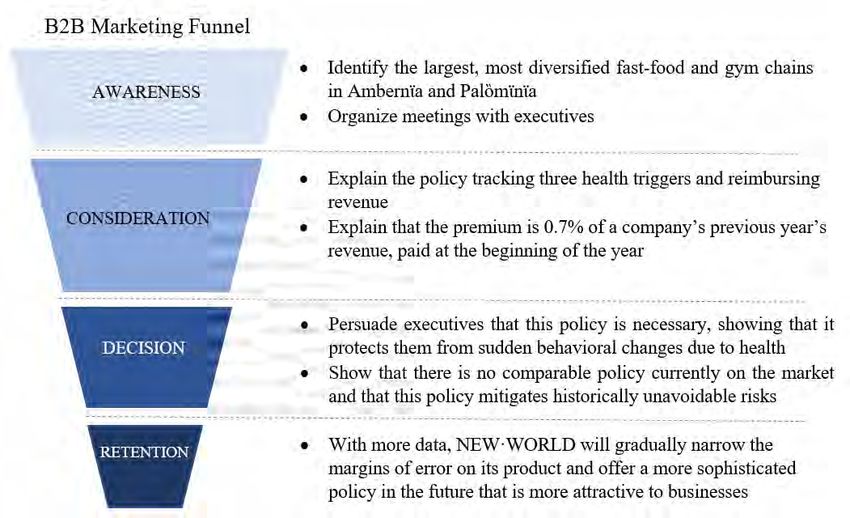
2021 SOA Student Research Case Study Challenge

Table of Contents
Executive Summary .......................................................................................................................3
Objectives........................................................................................................................................4
Design Considerations ...................................................................................................................5
   Triggering Events and Payout Provisions ....................................................................................5
   Insurability ...................................................................................................................................7
   Correlation for Suite of Metrics ...................................................................................................7
Implementation Plan .....................................................................................................................8
   Purchase Frequency and Likelihood ............................................................................................8
   Revenue and Net Income .............................................................................................................9
   Costs ...........................................................................................................................................10
   Marketing Strategy .....................................................................................................................12
Assumptions..................................................................................................................................13
   Key Assumptions .......................................................................................................................13
   Other Quantitative Assumptions ................................................................................................13
   Other Qualitative Assumptions ..................................................................................................14
Risks and Risk Mitigation ...........................................................................................................14
   Basis Risk – Risk 1.....................................................................................................................15
   Inaccurate, Biased, or Misrepresentative Data – Risk 2 ............................................................15
   Misjudged Demand and/or Elasticity – Risk 3...........................................................................15
   The Partnership with the Hospital Does Not Work – Risk 4 .....................................................16
Data to Monitor, Data Limitations, and Sensitivity Analysis ..................................................16
   Data Points to Monitor ...............................................................................................................16
   Data Limitations .........................................................................................................................17
   Sensitivity Analysis ....................................................................................................................17
Appendix and Methodologies......................................................................................................20
   Triggering Points Methodology .................................................................................................20
   R Code ........................................................................................................................................20
   The Lancet Data Graphs .............................................................................................................23
   Monte Carlo Excel Simulation ...................................................................................................26
Works Consulted..........................................................................................................................27

                                                                                                                      Indiana University | 2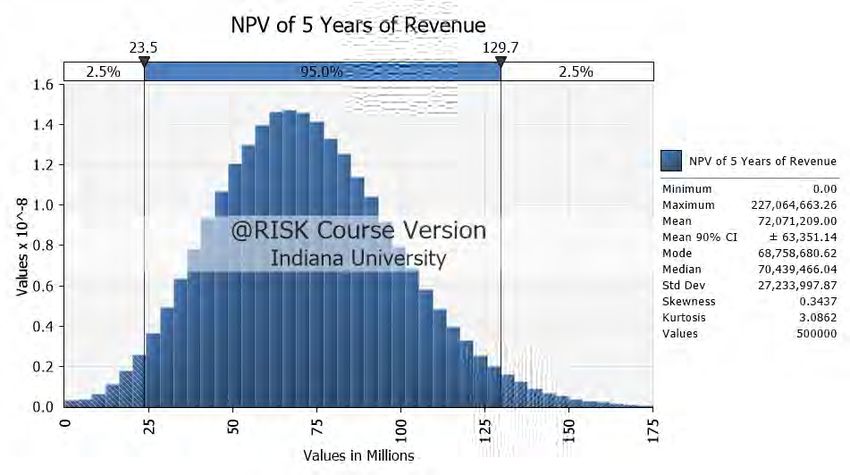
2021 SOA Student Research Case Study Challenge

Executive Summary
This report details how NEW·WORLD can utilize uncertainty about future trends in systolic blood
pressure, obesity prevalence, and diabetes prevalence to create and offer a parametric insurance
policy that is practical for gym chains and fast-food chains that operate in Ambernϊa and Palȍmϊnϊa.
In 2020, US gym revenues plummeted by 28% and US fast-food revenues fell 14%. These two
types of businesses, still reeling from the impacts of COVID-19, will find value in a policy that
protects them from similar, widespread behavioral changes due to health. Under our policy,
significant declines in any of the three metrics listed above will trigger a payout for gyms while
significant improvements in the same metrics will trigger payouts for fast food chains.

We will outline payout structures for each of the three health metrics: average systolic blood
pressure, obesity prevalence, and diabetes prevalence. All metrics have been age and sex
standardized. When one of these triggers occurs, a percentage of the previous year’s revenue will
be reimbursed. We selected these triggers because they are easily measurable and are three of the
four largest contributors to preventable deaths in the world (see Figure 1, opposite). Smoking,
despite being the second largest contributor to preventable deaths, was excluded because this
individual habit is not necessarily indicative of somebody’s overall lifestyle, meaning it will not
be as correlated to the success of gyms or fast-food chains. We standardized these triggers to offer
a simpler plan with only one triggering metric per risk factor.

This report uses empirical data from 1980-2016 from 184 countries (collected by The Lancet) to
determine the expected error of projected values for each of the three triggering events. We used
the data of 142 developing countries to compare to Palȍmϊnϊa and 42 developed countries to
compare to Ambernϊa. From these expected error values, we derived confidence intervals for the
three health metrics while considering the number of years into the future.

                                                                               Indiana University | 3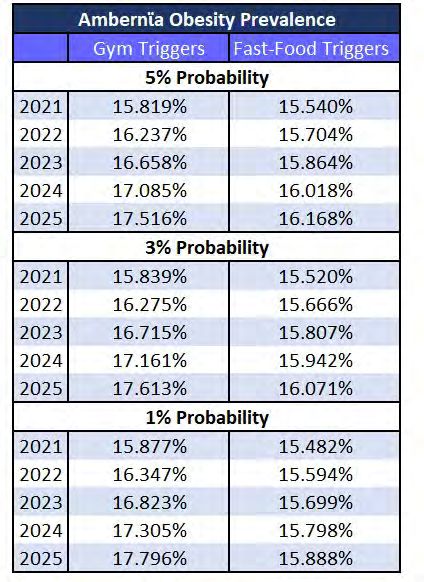
2021 SOA Student Research Case Study Challenge

                                    Number of Deaths by Risk Factor, World, 2017
                     High Blood Pressure                                                                                      10.44
                                 Smoking                                                            7.10
                        High Blood Sugar                                                        6.53
                                  Obesity                                          4.72
                    Outdoor Air Pollution                            2.94
                           Alcohol Abuse                            2.84
                        Diet Low in Fruits                       2.42
                      Indoor Air Pollution                1.64
Poor Sanitation/No Access to Handwashing                 1.48
                   Diet Low in Vegetables                1.46
                    Low Physical Activity              1.26
                     Unsafe Water Source               1.23
                       Second Handsmoke                1.22
                         Low birth weight             1.10
                            Child Wasting             1.08
                               Unsafe Sex            1.03
                                    Other            0.98
                                Drug Use          0.59

                                             0             2                4             6                8           10             12

                                                               Number of Deaths, in millions
          Figure 1: Blood pressure, blood sugar, and obesity are three of the four largest contributors to number of preventable deaths.

          Objectives
          Both gyms and fast-food chains rely on their customers living certain lifestyles. Gym chains want
          an active, healthy population, while fast-food chains benefit from a less healthy population that
          regularly enjoys their products. Both gyms and fast-food chains currently have liability insurance
          (for property, food poisoning, and exercise equipment malfunctions), property insurance, and
          business interruption insurance. Our proposal is similar to business interruption insurance in the
          sense that we would be compensating the company for lost income due to a ‘catastrophe.’ The
          fundamental difference between all these policies and a parametric policy is that the payouts of
          these policies are determined by incurred damages, while a parametric policy is paid out based on
          a predetermined triggering event.

          Because parametric policies are not based on damages, there is increased basis risk, or the
          possibility that damages are not equitable/correlated to the payout. Further, parametric policies are

                                                                                                                Indiana University | 4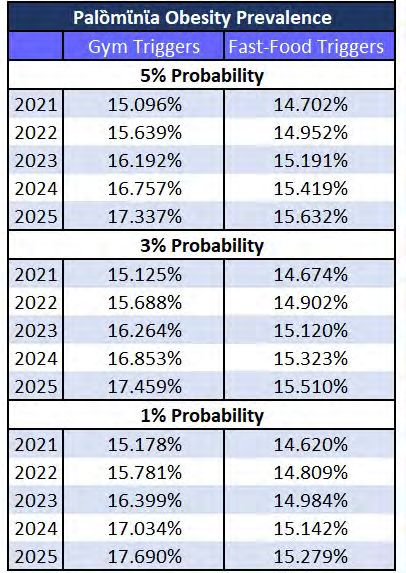
2021 SOA Student Research Case Study Challenge

not intended to be standalone policies. Despite these disadvantages, parametric insurance has been
becoming more prevalent because it eliminates claims adjustments and lengthy claims
investigations. Instead, claims are usually paid out immediately without any disagreement between
the insured and insurer.

There are several factors that will be analyzed in this report to determine the insurability of the
three health metrics through a parametric policy. Firstly, there must be a sufficient amount of
objective data and a reliable source collecting the data for any health metric to be used. Secondly,
there must be evidence that these metrics are closely tied with the performance of gym and fast-
food chains, mitigating basis risk. Lastly, we must prove that there can be steady profitability for
this plan without a significant chance for major losses that could cause NEW·WORLD’s default.

Design Considerations
Triggering Events and Payout Provisions
There are 180 triggering points in this policy, broken down by country, business type, probability,
health metric, and year. The health metrics are diabetes prevalence, mean systolic blood pressure,
and obesity prevalence. Systolic pressure was selected over diastolic pressure because recent
research has shown that it is a better indicator of cardiovascular health. All measures are age and
sex standardized so that a more simple, transparent product can be offered to clients of
NEW·WORLD with as few trigger points as possible while still offering a comprehensive product.

Premiums are paid to NEW·WORLD annually at the beginning of each year (or March in 2021).
Claims to gyms and fast-food chains are also paid annually. When one of the triggers with a 5%
probability occurs, 1% of that chain’s previous year’s revenue will be reimbursed. If any of the
triggers with a 3% probability occurs, an additional 1% (2% total) will be reimbursed. Finally, if
any of the triggers with a 1% probability occurs, an additional 3% (5% total) of revenue will be
reimbursed. If all three 1% probability triggers occurred in one year, a total of 15% of the previous
year’s revenue would be reimbursed. Any claims for 2021 will be paid out in January of 2022,
once there has been sufficient time to aggregate and analyze data. The duration of this policy is
five years, with the final claims being paid in January 2026.

                                                                                Indiana University | 5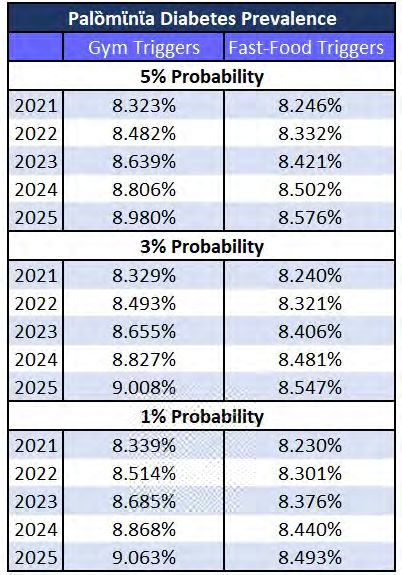
2021 SOA Student Research Case Study Challenge

Figure 2: All 180 trigger points

                                                            Indiana University | 6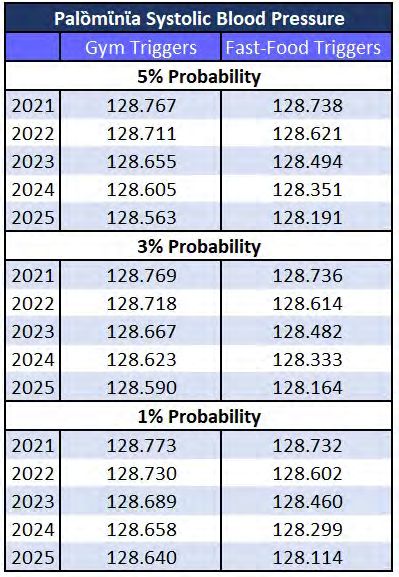
2021 SOA Student Research Case Study Challenge

Insurability

I.      Are the health metrics objective?
        Each of these health metrics were intentionally selected because they are easily measurable,
        strictly defined, and are immune to response bias (unlike smoking or physical activity
        levels). Obesity is characterized by a BMI >= 30. Diabetes is diagnosed when blood sugar
        >= 126 mg/dL. Systolic blood pressure is measured in mm Hg.
II.     Is there a practical method to gather data from the population?
        Almost any sampling method to determine these health metrics applied to the entire
        population would be expensive, logistically challenging, and yield a wide margin of error.
        Because these triggers are so sensitive to minor misrepresentations of the population,
        NEW·WORLD would need access to virtually the entire population’s medical data. This
        is possible through a partnership with a major hospital with interoperability capability,
        meaning that the hospital has access to patients not necessarily in their own system. This
        represents approximately 30% of hospitals. Buying these three simple metrics each year in
        both countries should be significantly cheaper than deals that usually involve accessing
        individual patient records.
III.    Is there evidence that gym and fast-food revenues are affected by the health metrics?
        There are academic dissertations concluding that more fast-food consumption leads to
        higher blood pressure, greater likelihood of being obese, and greater likelihood to have
        diabetes. There are also papers proving that regular exercise prevents obesity, high blood
        pressure, and diabetes. Each study can be found in the Works Consulted section of this
        report. While there is no evidence directly correlating revenues to these health metrics, we
        believe these studies provide sufficient evidence.

Correlation for Suite of Metrics
There are correlations between these health metrics, which are shown below, and were factored
into our model. The highest correlation coefficient was between diabetes prevalence and obesity
prevalence. These correlations expand the tails, increasing the likelihood of large losses and
profits, but do not affect the expected profit for this policy.

                                                                               Indiana University | 7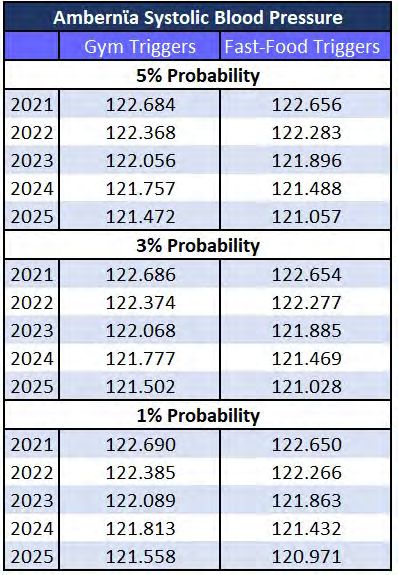
2021 SOA Student Research Case Study Challenge

Figure 3: Correlations between health metrics

Implementation Plan
Purchase Frequency and Likelihood

We derived a demand curve for the policy by first estimating the demand based on gross profit
margin, where a 100% demand means that every applicable firm would buy the product once at
the beginning of the five year period.
                                      Demand Curve Based on Gross Profit Margin
                 100%

                 80%

                 60%
  Gross Profit
    Margin
                 40%

                 20%

                   0%
                        0%      10%      20%     30%   40%      50%     60%    70%     80%    90%     100%

                                                              Demand
Figure 4: Demand curve based on gross profit margin

After determining that a 0.285% premium of the gym or fast-food chain’s previous year’s revenue
would cover the expected payouts, we found the corresponding demand for each premium,
yielding the following demand curve:

                                                                                      Indiana University | 8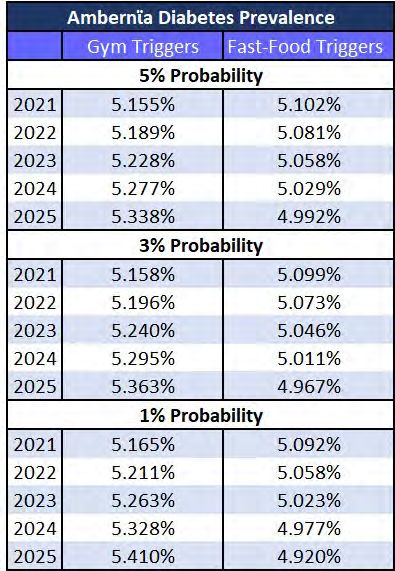
2021 SOA Student Research Case Study Challenge

                        Demand Curve Based on Premium as % of Revenue
                1.6%

                1.4%

                1.2%

                1.0%

Premium         0.8%

                0.6%

                0.4%

                0.2%

                0.0%
                       0%     10%     20%     30%      40%         50%   60%   70%   80%    90%    100%
                                                             Demand

Figure 5: Demand curve based on premium as percentage of revenue

Revenue and Net Income

Through a Monte Carlo model with 500,000 iterations, which simulates future health metrics,
payouts, expenses, and demand, we determined that this policy can be expected to yield ~ψ14.5
million in NPV of revenue in 2021 and ~ψ72 million over its five-year duration. The expected net
income for the policy is ~ψ4.8 million in year one and ~ψ25.6 million for over the five-year span.

Figure 6: NPV of 5 years of revenue

                                                                                       Indiana University | 9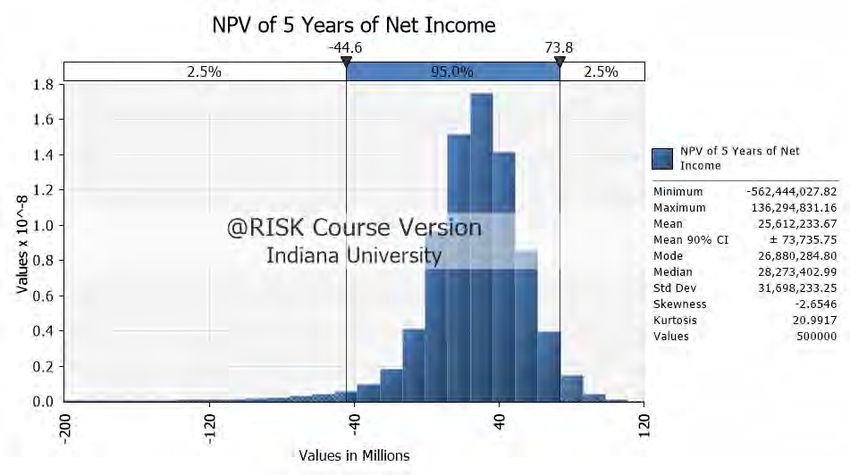
2021 SOA Student Research Case Study Challenge

Figure 7: NPV of 5 years of net income

The probability of breaking even is approximately 88%. The net income distribution is skewed left
(skew = -2.66). Despite the center of the distribution lying at ~ψ25.6 million, there is only a ~0.1%
chance of this policy yielding a NPV net income of over ψ100 million, while there is a ~0.9%
chance that there is a NPV loss of over ψ100 million.

Costs

Figure 8: Parametric expenses as percentages of parametric revenue

                                                                                        Indiana University | 10
2021 SOA Student Research Case Study Challenge
Figure 9: NPV of 5 years of payouts (not adjusted for reinsurance)
While expenses for commission, hospital data, reinsurance, marketing, and salaries fluctuate
negligibly, claim payouts vary drastically (see Figure 10). The 2.5th percentile for payouts is no
payouts, while the 97.5th percentile is ~0.85% of NEW·WORLD’s total expected assets each year.
Payouts as a Percentage of Assets
0.10%
0.09%
0.08%
0.07%
0.06%
0.05%
0.04%
0.03%
0.02%
0.01%
0.00%
2021 2022 2023 2024 2025
Mean 2.5th Percentile 97.5th Percentile
Figure 10: Payouts by year as a percentage of assets
Indiana University | 112021 SOA Student Research Case Study Challenge
Expenses by Year as Percentage of Total Assets
0.0045%
0.0040%
0.0035%
0.0030%
0.0025%
0.0020%
0.0015%
0.0010%
0.0005%
0.0000%
2021 2022 2023 2024 2025
Commission Reinsurance Hospital Data Cost
Marketing Expenses Salaries
Figure 11: Expenses by year as percentage of total assets
Marketing Strategy
With NEW·WORLD being the first-mover in parametric health policies and offering a never-
before-seen product, effective business-to-business marketing is imperative.
Figure 12: B2B marketing funnel
Indiana University | 122021 SOA Student Research Case Study Challenge
Assumptions
Key Assumptions
• GDP Conversions
o Assumed that there was an equivalent number of major players in the USA fast-
food and gym industries in Ambernϊa and Palȍmϊnϊa (ten and five respectively)
o Directly applied fast-food and gym revenues of major American players as
percentage of US GDP to Palȍmϊnϊa and Ambernϊa
o Assumed that targeted fast-food and gym chains operate in both Ambernϊa and
Palȍmϊnϊa
• Profit Margin and Demand Relationship
o Assumed that demand was strictly based on gross profit margin. To derive a
demand curve, we first assumed that 100% of firms will purchase the policy if
offered for free. Once the expected gross profit margin was 80%, we assumed 0%
of firms would purchase the policy. At a 60% gross profit margin, which is typical
for NEW·WORLD’s other products, we assumed a conservative 50% demand.
• Discount Rate
o Net income within 10% of projections when discount rate is between 0%-5.9%
o Used the weighted average GDP growth of Ambernϊa and Palȍmϊnϊa as the value
for expected market return
o Estimated the risk free rate as the long-term interest rate in Ambernϊa
o Utilized industry beta of 0.64 to execute requirements in CAPM Pricing Model
Other Quantitative Assumptions
• Ambernϊa Inflation – 1%
o Flatlined from the given case data
o Model would stay within 10% of expected NPV revenue if between -3% and 5%
• Palȍmϊnϊa Inflation – 10%
o Flatlined from the given case data
o Model would stay within 10% of expected NPV revenue if between -8% and 29%
Indiana University | 132021 SOA Student Research Case Study Challenge
• Currency Conversion – ψ1.00 = $0.78
o Took seven geographically diverse countries that had similar levels of tertiary
educational attainment and GNI growth to Ambernϊa, and then equated the average
GNI/person in dollars to Ambernϊa’s GNI/person in silons
o Model would stay within 10% of expected NPV revenue if between $0.71 and $0.85
Other Qualitative Assumptions
• In our quadratic regressions for diabetes prevalence and systolic blood pressure and our linear
regression for obesity, we assumed that Ambernϊa would closely follow the margin of error
shown in the 42 developed countries and that Palȍmϊnϊa would closely follow the distribution
of 142 developed countries.
• We assumed that the standard deviations of triggers from 10 years ago will be equivalent in
magnitude of deviation from the 2021-2025 triggers.
Risks and Risk Mitigation
Figure 13: Risk matrix
Indiana University | 142021 SOA Student Research Case Study Challenge
Basis Risk – Risk 1
I. The inherent risk of parametric insurance is that the payout either drastically exceeds or
falls short of the actual damages. If there is a significant change in the trends of several of
these metrics without corresponding revenue declines, the policy would need to be
discontinued.
II. There may be loyal consumer segments (that are small in proportion to the population)
whose gym or fast-food expenditures grow, causing revenues to increase despite national
health metrics moving adversely.
Mitigation: Correlation between payouts and damages will be carefully monitored in years after
the inception of this policy. Any adverse developments in health metrics for one business should
benefit the other type.
Inaccurate, Biased, or Misrepresentative Data – Risk 2
I. The data in either the case materials or Lancet dataset could have been collected in a biased,
uncomprehensive manner. This could mean that every trigger point is miscalculated,
possibly forcing NEW·WORLD to pay claims for every triggering point for one business
type, while never being close to the triggering points for the other business type (which
raises ethical concerns).
II. There could be an issue with hospital data, where the unhealthiest individuals are more
likely to be in their systems. This could be an especially big issue in Palȍmϊnϊa, where
healthcare may not be as readily accessible to healthy individuals. This would cause the
hospital data to represent worse national health than the actual population.
Mitigation: Insuring fast-food chains and gyms simultaneously hedges NEW·WORLD’s position,
ensuring more revenue even if one side is frequently generating payouts. Check all hospital data
against other government sources, such as the World Bank and national censuses.
Misjudged Demand and/or Elasticity– Risk 3
I. Companies suffering financial effects from COVID-19 may not be able to justify this
expense.
Indiana University | 152021 SOA Student Research Case Study Challenge
II. There may not be a firm that buys this policy because its price is too high. This would mean
that NEW·WORLD has wasted administrative, actuarial, and marketing resources.
III. Because this is a new product with little competition, it is possible that demand is more
inelastic than normal insurance, meaning a higher gross profit margin would correspond to
a fractionally higher demand. This would result in NEW·WORLD missing out on potential
revenue.
Mitigation: NEW·WORLD’s historical gross profit margin was used to justify the demand curve
during the policy-making process, which is conservative for a unique policy like this.
The Partnership with the Hospital Does Not Work – Risk 4
I. Selling patient data is heavily regulated in most countries, and certain conditions of
anonymity must be maintained. It is possible that a country could bar NEW·WORLD from
partnering with hospitals, or hospitals could decline due to ethical reasons.
II. The actual cost of this partnership could vary drastically from estimates since there is no
precedent. This data could cost more than the income NEW·WORLD expects to bring in,
making the policy impractical.
Mitigation: 10% of yearly parametric revenue was allocated to this partnership in the policy-
making process, which is likely a high-end estimate since NEW·WORLD only needs six
datapoints each year (one for each health metric and country).
Data to Monitor, Data Limitations, and Sensitivity Analysis
Data Points to Monitor
These values should be reported to NEW·WORLD’s senior management on an end-of-year basis:
• Revenue, expenses, and net income
• Data on all 36 health triggers each year in the parametric insurance policy
• B2B marketing success rates as compared to expected demand
Indiana University | 162021 SOA Student Research Case Study Challenge
• Whether NEW·WORLD should renegotiate for cheaper reinsurance if projected values are
closely met in first 2-3 years of policy
Data Limitations
• There was not a substantial breakdown between variable and fixed expenses on
NEW·WORLD’s income statement. Our expenses were exclusively taken as a percent of
parametric revenue based on income statement ratios, so this assumption could be invalid
if current fixed expenditures scaled to the added parametric policy.
• It was unusual for a multinational insurance company with over ψ60 billion in assets to not
have any debt in their capital structure. We used a sound approach in calculating the
company discount rate from a formula perspective, but it is difficult to ascertain the
meaning of the discount rate in such an improbable situation.
• We were not given any historical data for obesity prevalence, which forced us to estimate
a rate of change and develop trigger points further away from our projected values.
• We do not have breakdowns of NEW·WORLD’s typical insurance offerings, target
segments, or expenditures. Further, we do not know about the existing relationships or
credibility that NEW·WORLD has developed in the industry. We assumed that
NEW·WORLD is diversified and can break into most insurance segments.
Sensitivity Analysis
Changing the premium has massive implications on demand and further impacts profit. We
assumed a 0.7% premium, implying a 59.3% gross profit margin and 51.6% demand.
Indiana University | 172021 SOA Student Research Case Study Challenge
Premium Charged vs Expected 5-Year Net Income
ψ30,000,000
ψ25,000,000
ψ20,000,000
ψ15,000,000
ψ10,000,000
ψ5,000,000
ψ-
Premium 0.3% 0.5% 0.7% 0.9% 1.1% 1.3% 1.5%
GPM 43.0% 59.4% 68.3% 74.1% 78.1%
Demand 79.4% 51.2% 31.3% 16.5% 5.5%
Figure 14: Sensitivity of premium and NPV of net income
Uncertainty of non-fluctuating expenses, such as the hospital partnership, salaries, and reinsurance
significantly affects net income (see Figure 15 below). We assumed the total operating expense to
be 36% of parametric revenue. There is approximately a ψ3.1 million range in the NPV of total
net income when considering discount rates between 0.5% and 4.5% (see Figure 16 below).
Figure 15: Sensitivity of premium and operating expenses
Figure 16: Sensitivity of premium and discount rate
Indiana University | 182021 SOA Student Research Case Study Challenge
The graph below shows the relationship between estimated market return and NEW·WORLD’s
discount rate. As the estimated market return increases, new product offerings must perform
better to make the investment worthwhile. An increasing discount rate lowers the NPV of future
net income.
Discount Rate as a Function of Market Return
9%
8%
7%
6%
NEW·WORLD 5%
Discount Rate 4%
3%
2%
1%
0%
1% 4% 7% 10% 13%
Estimated Market Return
Figure 17: Sensitivity of discount rate and estimated market return
Indiana University | 192021 SOA Student Research Case Study Challenge
Appendix and Methodologies
Triggering Points Methodology
The triggering points for each of the three health metrics were found using empirical data collected
by The Lancet, a scientific journal. After standardizing the data to age and sex, a quadratic
regression was run on each of the 42 developed countries (for application to Ambernϊa) and 142
developing countries (for application to Palȍmϊnϊa) using data from 2000-2009. We then compared
the expected values yielded by these regression coefficients to the actual, observed datapoints from
2010-2014. Finally, we separately calculated the expected standard deviation by year for
developed and developing nations, which we could apply to the systolic blood pressure and
diabetes prevalence quadratic regression lines of Palȍmϊnϊa and Ambernϊa.
However, for obesity, we do not have access to the historical data for Palȍmϊnϊa or Ambernϊa.
Moreover, we need to find an expected slope and the accompanying error of that slope from the
Lancet dataset. We found that there was a correlation between current obesity prevalence and the
change per year, which could be used to estimate the rate of change in Palȍmϊnϊa and Ambernϊa.
However, we found that obesity prevalence rates that were extremely small or extremely large
tended to have slopes that were smaller than the expected values on the regression line. Since
Palȍmϊnϊa and Ambernϊa both exhibit a more average prevalence (~15%), we excluded countries
where prevalence was less than 5% or over 35% from our analysis. After deriving an expected
value for the true slope from the regression output, we factored in the error of that slope and the
error from expected deviations from that slope each year, similarly to what we did with blood
pressure and diabetes prevalence.
R CODE (Using data collected by The Lancet)
tenyrs_diab_developed = Diabetes_Developed %>%
filter(Year < 2010, Year > 1999) #First 10 years of 15 most recent years of data for diabetes prevalence
tenyrs_diab_developing = Diabetes_Developing %>%
filter(Year < 2010, Year > 1999)
lm_diab_developed = lmList(object = Diab_Prev ~ Year + I(Year^2) | Country, tenyrs_BP_developed)
lm_diab_developing = lmList(object = Diab_Prev ~ Year + I(Year^2) | Country, tenyrs_BP_developing)
#Creating a list that stores simple quadratic regression coefficients by country
Diab_reg_coefficients_by_developed_country = coef(lm_diab_developed)
Indiana University | 202021 SOA Student Research Case Study Challenge
Diab_reg_coefficients_by_developing_country = coef(lm_diab_developing)
#Coef() allows user to easily download data to a CLV file
#In Excel, we compared projected values for those 5 years to the observed values, finding an expected standard
deviation for each year.
Figure 18: Standard deviations from expected future diabetes
tenyrs_BP_developed = Sys_Developed %>%
filter(Year < 2011, Year > 2000) #First 10 years of 15 most recent years of data for systolic blood pressure
tenyrs_BP_developing = Sys_Developing %>%
filter(Year < 2011, Year > 2000)
lm_BP_developed = lmList(object = Systolic ~ Year + I(Year^2) | Country, tenyrs_BP_developed)
lm_BP_developing = lmList(object = Systolic ~ Year + I(Year^2) | Country, tenyrs_BP_developing)
BP_reg_coefficients_by_developed_country = coef(lm_BP_developed)
BP_reg_coefficients_by_developing_country = coef(lm_BP_developing)
#In Excel, we compared projected values for those 5 years to the observed values, finding an expected standard
deviation for each year.
Figure 19: Standard deviations from expected future systolic BP
tenyrs_obes_developed = Obes_Developed %>%
filter(Year < 2012, Year > 2001) #First 10 years of 15 most recent years of data for obesity prevalence
tenyrs_obes_developing = Obes_Developing %>%
filter(Year < 2012, Year > 2001)
lm_obes_developed = lmList(object = Obesity ~ Year | Country, 10yrs_obes_developed)
lm_obes_developing = lmList(object = Obesity ~ Year | Country, 10yrs_obes_developing)
Indiana University | 212021 SOA Student Research Case Study Challenge
obes_reg_coefficients_by_developed_country = coef(lm_obes_developed)
obes_reg_coefficients_by_developing_country = coef(lm_obes_developing)
#Took the slope coefficients by country to use in a regression function between current prevalence and slope
Figures 20 and 21: Correlations between obesity prevalence and growth per year
#Separated countries with 5-35% prevalence because high and low prevalence countries tend to have slopes below
the regression line, as seen above. Also, these countries are distant from the Palȍmϊnϊa and Ambernϊa prevalence (both
~15%)
cutdown_obesity_prev_and_slope_developed = obesity_prev_and_slope_developed %>%
filter(Prev > .05 ,Prev < .35)
cutdown_obesity_prev_and_slope_developing = obesity_prev_and_slope_developing %>%
filter(Prev > .05, Prev < .35)
lm_developed_prev_vs_slope = lm(Slope ~ Prev, cutdown_obesity_prev_and_slope_developed)
lm_developing_prev_vs_slope = lm(Slope ~ Prev, cutdown_obesity_prev_and_slope_developing)
#Yields regression coefficients that we applied to Palȍmϊnϊa and Ambernϊa , finding their slopes to be ~.4% increase
per year and ~.3% increase per year, respectively. Standard errors were .074% for Ambernϊa and .082% for Palȍmϊnϊa.
Figure 22: Standard deviations from expected future obesity (After factoring in error from Slope & Deviation)
Indiana University | 222021 SOA Student Research Case Study Challenge
The Lancet Data Graphs
There is too much data to include in this report, but these graphs represent every datapoint
considered:
Figure 23: Systolic pressure over time in developing countries
Figure 24: Systolic pressure over time in developed countries
Indiana University | 232021 SOA Student Research Case Study Challenge
Figure 25: Diabetes Prevalence over time in developing countries
Figure 26: Diabetes prevalence over time in developing countries
Indiana University | 242021 SOA Student Research Case Study Challenge
Figure 27: Obesity prevalence over time in developed countries
Figure 28: Obesity prevalence over time in developing countries
Indiana University | 252021 SOA Student Research Case Study Challenge
Monte Carlo Excel Simulation
We used Palisade’s @Risk tool to factor in uncertainty to our model and predictions.
• The following formulas were used to randomize the competitive landscape in each iteration
assuming ten fast-food chains and five gyms. These numbers were calculated by taking the
revenue of major players in the USA, scaling to GDP, and converting dollars to silons.
=RiskNormal(MeanFF, StdDevFF) = =RiskNormal(360000000, 286000000) 10 times
=RiskNormal(MeanGym, StdDevGym) = =RiskNormal(86500000, 24000000) 5 times
• Revenue was then calculated by multiplying the sum of this revenue by 0.7% (the yearly
premium). This revenue calculation included the inflation rates for Palȍmϊnϊa and Ambernϊa
as well as the discount rate to find the NPV.
• =RiskNormal() was used to randomize the 30 total monitored points over the next five years,
with the means as the expected values (see Figure 2), and the standard deviations as calculated
(See Figures 18, 19, 22). =NormInv() was used to find triggering events based on probability.
o Note: For obesity, =RiskNormal() was used twice. It was used once to find a random
slope and once to factor in the deviation from this true slope.
• The 180 possible payouts could then be simulated using the following formula (gym ex.):
=IF(RiskNormalValue >= Trigger, Reimbursement% * (1 + Inflation) * SUM(CountryRevenue), 0)
• =RiskCorrMat(), as seen below, was used within the health metric functions to factor in
correlation between diabetes, obesity, and systolic blood pressure (see Figure #3 for the
correlations). Correlations were found using =correl() for two arrays of metrics (by country)
collected by The Lancet.
=RiskNormal(ExpectedHealthMetric ,StdDev, RiskCorrmat(RiskMatrix, 1, 1))
• =RiskPert() was used to randomize the weight of sales in Palȍmϊnϊa and Ambernϊa for each
individual company, with 5% of revenue being in Palȍmϊnϊa as the minimum and 20% as the
maximum.
• =RiskBernoulli was used to randomize whether the company purchased the policy, with the
demand percentage as the probability.
Indiana University | 262021 SOA Student Research Case Study Challenge
Works Consulted
“2021 Student Research Case Study Challenge.” SOA,
www.soa.org/research/opportunities/2021-student-case-study/.
Alsabieh, Mohammad, et al. “Fast Food Consumption and Its Associations with Heart Rate,
Blood Pressure, Cognitive Function and Quality of Life. Pilot Study.” Heliyon, Elsevier, 17
May 2019, www.ncbi.nlm.nih.gov/pmc/articles/PMC6526229/.
“Betas by Sector (US).” Betas,
pages.stern.nyu.edu/~adamodar/New_Home_Page/datafile/Betas.html.
Colberg, Sheri R., et al. “Physical Activity/Exercise and Diabetes: A Position Statement of the
American Diabetes Association.” Diabetes Care, American Diabetes Association, 1 Nov.
2016, care.diabetesjournals.org/content/39/11/2065.
“Data Downloads > NCD.” NCD-RisC, ncdrisc.org/data-downloads.html.
“Junk Food and Diabetes: The Link, the Effects, and Tips for Eating Out.” Medical News Today,
MediLexicon International, www.medicalnewstoday.com/articles/317122#effects.
Le, Thi. “Fast Food Restaurants in the US.” Oct. 2020, my-ibisworld-
com.proxyiub.uits.iu.edu/us/en/industry/72221a/about.
Mohammadbeigi, A, et al. “Fast Food Consumption and Overweight/Obesity Prevalence in
Students and Its Association with General and Abdominal Obesity.” Journal of Preventive
Medicine and Hygiene, Pacini Editore Srl, 28 Sept. 2018,
www.ncbi.nlm.nih.gov/pmc/articles/PMC6196377/.
“Physical Activity.” Obesity Prevention Source, 12 Apr. 2016, www.hsph.harvard.edu/obesity-
prevention-source/obesity-causes/physical-activity-and-
obesity/#:~:text=Physical%20activity%20increases%20people's%20total,the%20developm
ent%20of%20abdominal%20obesity.
RH;, Cornelissen VA;Fagard. “Effect of Resistance Training on Resting Blood Pressure: a Meta-
Analysis of Randomized Controlled Trials.” Journal of Hypertension, U.S. National
Library of Medicine, pubmed.ncbi.nlm.nih.gov/15662209/.
Roth, Ryan. “Gym & Fitness Franchises.” IBISWorld, Oct. 2020, my-ibisworld-
com.proxyiub.uits.iu.edu/us/en/industry-specialized/od5599/about.
Smith, Adrienne. “Content For Each B2B Marketing Funnel Stage.” Adrienne Smith, Adrienne
Smith, 22 May 2020, www.adrienneksmith.com/resources/content-to-use-each-stage-of-
b2b-marketing-funnel.
Indiana University | 27You can also read