Full Year Results 31st March 2021 - Augmentum Fintech

Page created by Herman Yang
 
CONTINUE READING
Full Year Results 31st March 2021 - Augmentum Fintech
Full Year Results
     31st March 2021
Full Year Results 31st March 2021 - Augmentum Fintech
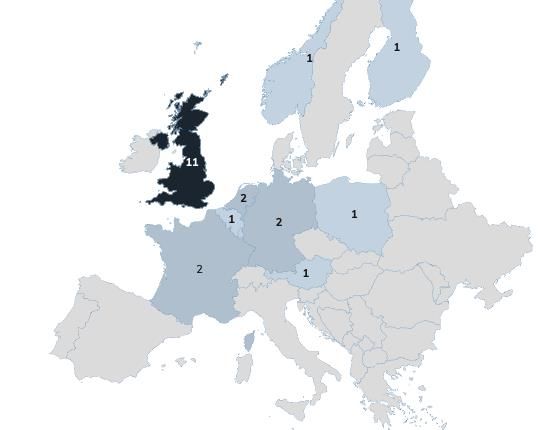
Disclaimer
This presentation has been prepared by Augmentum Fintech Management Limited (“Augmentum”), which is                      In preparing this presentation, Augmentum has relied upon and assumed, without independent verification, the
authorised and regulated by the United Kingdom Financial Conduct Authority, for information and discussion               accuracy and completeness of all information available from public sources or which was otherwise reviewed by
purposes only and should not be considered to be an offer or solicitation of an offer to buy or sell shares in the       Augmentum. The information presented in this document may be based upon the subjective views of
capital of Augmentum Fintech plc (the “Company”). In particular, this document does not constitute an offer to           Augmentum or upon third party sources subjectively selected by Augmentum. Augmentum believes that such
sell, or the solicitation of an offer to acquire or subscribe for shares in the capital of the Company in any            third party sources are reliable, however no
jurisdiction where to do so would be unlawful. The information in this presentation has not been fully verified and      assurances can be made in this regard.
is subject to material revision and further amendment without notice.                                                    Neither this presentation nor its contents may be distributed, published or reproduced, in whole or
This presentation has not been approved by an authorised person in accordance with section 21 of the Financial           in part, by you or any other person for any purpose. In particular, neither this presentation nor any copy of it may
Services and Markets Act 2000. As such this document is being made available only to and is directed only at: (a)        be: (i) taken or transmitted into the United States of America; (ii) distributed,
persons outside the United Kingdom; (b) persons having professional experience in matters relating to                    directly or indirectly, in the United States of America or to any US person (within the meaning
investments falling within Article 19(5) of the Financial Services and Markets Act 2000 (Financial Promotion) Order      of regulations made under the Securities Act 1933, as amended); (iii) subject to certain
2005 (the "Order"); or (c) high net worth bodies corporate, unincorporated associations and partnerships and             exceptions, taken or transmitted into Canada, Australia, New Zealand or the Republic
trustees of high value trusts as described in Article 49(2) (A) to (C) of the Order, and other persons to whom it may    of South Africa or to any resident thereof; or (iv) taken or transmitted into or distributed
otherwise lawfully be communicated (all such persons together being referred to as "relevant persons"). Any              in Japan or to any resident thereof. Any failure to comply with these restrictions may
failure to comply with these restrictions constitutes a violation of the laws of the United Kingdom. The                 constitute a violation of the securities laws or the laws of any such jurisdiction.
distribution of this presentation in or to persons subject to the laws of other jurisdictions may be restricted by law   The distribution of this document in other jurisdictions may be restricted by law
and persons into whose possession this document comes should inform themselves about, and observe, any such              and the persons into whose possession this document comes should inform
restrictions. Any failure to comply with these restrictions may constitute a violation of the laws of the relevant       themselves about, and observe, any such restrictions.
jurisdiction.                                                                                                            The value of investments and the income from them can fall as well as rise.
This presentation does not constitute or form any part of, and should not be construed as, an offer or invitation or     An investor may not get the amount of money he/she invests. Past
other solicitation or recommendation to purchase or subscribe for any securities. No reliance may be placed for          performance is not a guide to future performance.
any purpose whatsoever on the information, representations or opinions contained in this document, and no                By accepting this document or by attending any presentation to which
liability is accepted for any such information, representations or opinions. This document does not constitute           this document relates you will be taken to have represented, warranted
either advice or a recommendation regarding any securities. Any persons who is any doubt about the subject               and undertaken that: (i) you are a relevant person; (ii) you have read
matter of this presentation should consult a duly authorised person.                                                     and agree to comply with the contents of this disclaimer; and (iii) you
None of the Company, Augmentum or any other persons makes any guarantee, representation or warranty,                     will treat and safeguard as strictly private and confidential all the
express or implied, as to the accuracy, completeness or fairness of the information and opinions contained in this       information contained herein and take all reasonable steps to
document, and none of the Company, Augmentum or any other person accepts any responsibility or liability                 preserve such confidentiality.
whatsoever for any loss howsoever arising from any use of this document or its contents or otherwise arising in
connection therewith.

2
Full Year Results 31st March 2021 - Augmentum Fintech
Contents

▪ Investment summary

▪ Full Year Results 31st March 2021

▪ Portfolio update

▪ Market update

▪ Appendix

3
Full Year Results 31st March 2021 - Augmentum Fintech
Summary

▪ Our portfolio of 21 companies is well diversified across fintech verticals: the portfolio and the fintech sector have proven resilient
  during the Covid-19 pandemic

▪ During the year ended 31st Mar-21 we delivered an increase of 14.3p in NAV per share, +12% versus 31st Mar-20. NAV stands at
  £183.2m, +35%1 versus Mar-20 and the unrealised annualised IRR on invested capital since inception is 19%

▪ In Oct-20 Augmentum raised £27.5m net proceeds through an oversubscribed placing and retail offer

▪ We remain a highly selective investor; welcoming two exceptional companies to the portfolio during the year and strengthening
  existing portfolio positions through follow-on investment

▪ Post-year end, we have completed two further initial investments, additional follow-on investments and realised our first portfolio
  exit through the sale of our holding in Dext to Hg Capital

▪ The fintech sector is a beneficiary of accelerated digitisation driven by the Covid-19 pandemic, creating additional near-term
  opportunities for companies operating in the space

▪ Looking forward, we have a strong pipeline of further opportunities across our target verticals

4   1.   Includes net proceeds of £27.5m from capital raise in Q4 2020 (+20% contribution to uplift) and net portfolio fair value increase (+15% contribution to uplift)
Full Year Results 31st March 2021 - Augmentum Fintech
Our portfolio stands at 21 companies with steady
 deployment of capital since IPO in 2018
 Capital deployment Q1 2018 – Q2 20211
                                                                                                                           £25.8m                                    £27.5m
                                                                                                                                                                                       Post-Year End
                                                                                                                            equity                                    equity
                        180                                                                                                  issue                                     issue                           100%
                                               Capital deployed (£m)                                                        Jul-19                                   Oct-20

                        160                    Share of raised capital and proceeds deployed (%)                                                             87%                                       90%
                                                                                                                                             82%     82%
                                                                                                                   79%
                                                                                                                                                                                                       80%
                        140                                                                                                          75%                                                   82%
                                                                                                      70%                   71%
                                                                                                                                                                               77%
                                                                                                                                                                                                       70%
                        120                                                                                                                                           71%
Capital deployed (£m)

                                                                                  61%
                                                                                                                                                                                                       60%
                        100                                         51%
                                                                                                                                                                                                       50%
                        80                        40%
                               35%                                                                                                                                                                     40%

                        60
                                                                                                                                                                                                       30%

                        40
                                                                                                                                                                                                       20%

                        20                                                                                                                                                                             10%

                         0                                                                                                                                                                             0%
                              Q1 18              Q2 18             Q3 18          Q4 18             Q1 19          Q2 19   Q3 19     Q4 19   Q1 20   Q2 20   Q3 20   Q4 20     Q1 21      Q2 21
 1. Q2 2021 Year to Date (Apr-June 9th 2021)       New investment post-year end     Portfolio exit post-year end

 5
Full Year Results 31st March 2021 - Augmentum Fintech
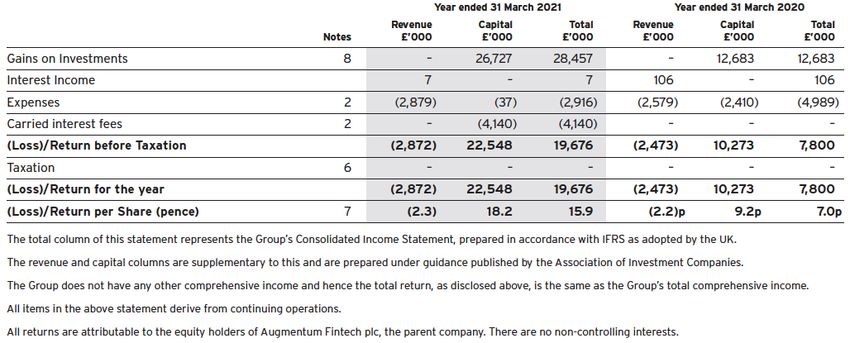
The Augmentum portfolio
      is well diversified
      Augmentum NAV1 by Area of Opportunity, %
                                                                                            Retail Investment

                                                                             Equities 19%
      SME Financial Stack
B2B

                                                                                                                B2C
                                                         NAV
                                                       £183.2m
                                                                                              Digital Banking

                                                         Circular Econ. 7%
      RegTech
                                                                                             Lifetime Wealth

      Infrastructure
                                                                                            Circular Economy

          Portfolio exit post-year end

      6               1.   NAV as at 31st March 2021
Full Year Results 31st March 2021 - Augmentum Fintech
The latest additions to the portfolio increase our coverage of key areas where we hold
a strong thesis but previously had limited exposure
Overview of thesis based sourcing strategy in action

    Payments                                                         Decentralised Finance                                Workplace Pensions & Savings

    Augmentum Thesis                                                 Augmentum Thesis                                     Augmentum Thesis
    Rise of alternative payment methods (APMs) driven                Software-led disruption will move deeper into the    There are multiple markets in Europe where a lack of
    by ecommerce and regulatory change create                        financial services stack, smart contracts have the   product innovation from incumbent pension providers
    opportunity for account-to-account payments                      potential to play the role of intermediary in        creates opportunity for disruption from new entrants
    providers to take significant digital payments market            financial transactions
    share

    Market Statistic                                                 Market Statistic                                      Market Statistic

     $4.3trn                                                         $59bn                                                 €3trn
     Total retail e-commerce payment value 2020,                     Total Value Locked in decentralised finance           European pension fund assets3
     expected to grow at 10%+ CAGR 2020-24F                          smart contract transactions2

     New Investment                                                  New Investment                                       New Investments
                                                                                                                                                  Invested €2.5m in Epsor
                          Invested £0.5m in Nov-20 with                                                                                           (France) in Apr-21 & £5m in
                                                                                            Invested a total of $3.9m
                          intention to follow-on with £4m in                                                                                      Cushon (UK) in
                          upcoming round                                                                                                          May-21

         1.   Statista – Worldwide E-commerce Sales Value 2020-24F
         2.
         3.
              Defi Pulse, accessed 21st May 2021, 18:00 BST
              European Central Bank
                                                                            Including post-year end investments, available capital4 is 82% deployed
7        4.   Available capital = raised capital + exit proceeds
Full Year Results 31st March 2021 - Augmentum Fintech
Contents

▪ Investment summary

▪ Full Year Results 31st March 2021

▪ Portfolio update

▪ Market update

▪ Appendix

8
Full Year Results 31st March 2021 - Augmentum Fintech
Financial & operational highlights
Year ended 31st March 2021

     AUGM PLC                                                                                                   Capital Raise & Deployment                                  Portfolio

    £183.2m Overall Net Asset Value,                                                                         £28m Capital raised through                                    4
    +35% vs 31st Mar-20 NAV of £135.8m1                                                                      oversubscribed placing and retail offer                        New portfolio                   Post-Year End
                                                                                                             in Oct-20                                                      companies

                                                                                                                                                                                            Post-Year End
                                                                                                             £15.4m Capital deployed in new and                                  Exit                 Holding acquired by
    +14.3p NAV per share increase to                                                                         follow-on investments, further £8.3m                                                         Hg Capital
    130.4p, +12% vs Mar-20                                                                                                                                                                             31% Gross IRR
                                                                                                             deployed post-year end

    +19% Unrealised annualised IRR on                                                                        >£185m Total equity raised by
    invested capital                                                                                         Augmentum Portfolio Companies during
                                                                                                             the year

     1.   Includes net proceeds of £27.5m from capital raise in Q4 2020 (+20% contribution to uplift) and net portfolio fair value increase (+15% contribution to uplift)

9
Gross portfolio value and NAV progression

 Gross Portfolio Value, 31st March 2018-21                                                                        NAV and NAV per Share, 31st March 2018-21

                    +19% unrealised annualised IRR on invested capital                                                                                        130.4p

                                                                                             £27m       £164m    200

                                                                                                                                                 116.1p       £183m
                                                                            £14m                                                      109.6p
                                              £24m                £123m                                          150
                                                                                                                                                    £136m
                                                                                                                        99.0p
                        £65m
                                                                                                                                      £103m
                                                                                                                 100    £94m
       Seed
     portfolio

      £34m                                                                                                        50

                                                                                                                   0

     Mar-18            Net                 Unrealised             Mar-20     Net           Unrealised   Mar-21         Mar-18        Mar-19         Mar-20    Mar-21
                     Additions         1
                                             Uplift                        Additions   1
                                                                                             Uplift

10            1.   Net additions = Invested Capital - Dividends
Capital deployment during the year
Year Ended 31st March 2021                                                  Post-Year End                            Other   £30.9m

                                                                                                                                 Year Ended Mar-21 & Post-Year End
                                                                                                                                                                     Capital Deployed
                                                                                                                     £6.5m
                                                                                    New
     We have welcomed 4 exceptional companies to the                             Investment
     portfolio – 2 within the year, 2 post-year end - and
     continue to invest for growth across our existing
     companies                                                                                     £4.0m

                                                                                  £5.0m
                                                                                                    New
                                                                    Other                           Investment

                                                                    £7.4m

               New
            Investment                                                       New
                                                        £2.6m                Investment

                                 £2.6m

             £2.8m

                                Year Ended 31st March 2021 £15.4m                             Post-Year End £15.5m
11
Contents

▪ Investment summary

▪ Full Year Results 31st March 2021

▪ Portfolio update

▪ Market update

▪ Appendix

12
Our portfolio is balanced across stages of maturity
Augmentum NAV1 by Company Stage, %

                                                                                  NAV
                                                                                £183.2m
                                                                                                                                                                                                      Year-on-Year Revenue Growth by Stage
                                                                                                                                                                                                      Year Ended 31st March 2020-212, %

                                                                                                                                                                                                       Early                  +110%
                                                                                                                                                                                                       Mid                      +57%

                                                                                                                                                                                                       Late                     +30%

           Portfolio exit post-year end

      1.    NAV as at 31st March 2021
      2.    YoY revenue comparison period is Q2’19 -Q1’20 and Q2’20-Q1’21, except for WhiskyInvestDirect (FY19-20, FYE October), Zopa where 12 months to February 2020-21 were used and Intellis, where annual revenue was smoothed to derive comparable estimates. Excludes Previse, Wayhome
13          and VOLT as all were pre-product launch in 2019 preventing YoY revenue comparison. Parafi Capital is also excluded due to being an investment fund and therefore non-revenue generative. SRL Global excluded as no comparable revenue figures for 2020 and 2021.
Having delivered strong growth in 2020 despite Covid, our portfolio is well
          positioned to benefit from continued accelerated digitisation in financial services
          Year-on-Year Growth of Portfolio Companies1 by Annual Run-Rate Revenue
Year-on-Year Revenue Growth, Year Ended 31st March

                                                     Strong Growth                                                                                                                                                                                                                                                                                                72% of Gross Portfolio Value4
                                                            (>30%)                                                                                                                                                                                                                                                                                                is invested in companies which
                                                                                                                                                                                                                                                                                                                                                                  grew >30% YoY

                                                                                                                                                                                                                                                                                                                                                                       Current Momentum

                                                                                                                                                                                                                                                                                                                                                                  Favourable
                   2020-21 (%)2

                                                                 Growth                                                                                                                                                                                                                                                                                           Neutral
                                                              (10%-30%)                                                                                                                                                                                                                                                                                           Unfavourable

                                                          Low Growth
                                                              (
£164.1m
                                                                 £24.4m
                                                   Other

                                                                         £0.9m
                                                                         £5.0m
                                                                          £18.4m
                                                                                   £8.0m
                                                                                   £0.1m
                                                                                   £0.3m
                                                                                   £7.6m
                                                                                      £9.5m
                                                                                      £0.4m
                                                                                      £1.2m
                                                                                      £7.9m
                                                                                           £10.3m
                                                                                       (£0.8m)
                                                                                           £1.0m
                                                                                           £10.2m
                                                                                              £10.5m
                                                                                               £3.0m
                                                                                                   £7.5m
                                                                                                    £10.6m
                                                                                                     £0.8m
                                                                                                     £2.6m
                                                                                                       £7.2m
                                                                                                           £11.5m
                                                           Mar-21

                                                                                                           £1.3m
                                                                                                           (£1.1m)
                                                                                                           £11.2m
                                                           Reduction

                                                                                                               £12.9m
                                                                                                                 £4.0m
Portfolio valuation changes

                                                                                                                     £2.6m

                                                                                                                                                     Applies only to BullionVault due to spin out of WhiskyInvestDirect within the year
                                                                                                                     £6.3m
                                                           Divestment1

                                                                                                                       £14.9m
                                                                                                                        £4.0m
                                                                                                                        £10.9m
                                                                                                                             £19.0m
                                                           Uplift

                                                                                                                                £2.7m
                              Year ended 31st March 2021

                                                                                                                                 £2.0m
                                                                                                                                £14.2m
                                                           Investment                                                                   £32.6m
                                                                                                                                        £10.2m
                                                                                                                                            £0.7m
                                                                                                                                            £21.8m

                                                                                                                                                     1.
                                                           Mar-20

                                                                                                                                                     15
Significant fair value movements
Year ended 31st March 2021                                                                                                                                                                                  Mar-20         Fair Value Movement         Mar-21

▪ interactive investor is the No.1 UK direct-to-consumer fixed fee                                                                                                  ▪ Grover brings the access economy to the consumer electronics
  investment platform, with over £45 billion of assets under                                                                                                          market by offering a simple, monthly subscription model for over
  administration and over 350,000 customers across its general                                                                                                        2,000 products including smartphones, laptops, virtual reality
  trading, ISA and SIPP accounts                                                                                                                                      technology and wearables

                                                                                                                                                                                       17x growth in international
Highlights

                                                                                                                                                                          Highlights
                                       Acquired                                                          20%                                                                                                                           €70m
                                                                                       Key Stat

                                                                                                                                                                                                                            Key Stat
                                                                          1
                                                                                                                                                                                               markets
                                                                                                         Share of UK retail equity                                                                                                     Annualised subscription
                                                                                                         trading volume                                                                 130k+ active subscriptions                     value surpassed
                                                                                                                                                                                                                                       in March 2021
FV Movement

                                                                                                                                                                    FV Movement
                                                                                                                Invested                                 Value                                                                          Invested        Value
              Mar-20                   £21.8m                                                                                                                                          Mar-20   £6.3m
                                                                                                               £3.8m                                 £32.6m
                                                                                       Overview

                                                                                                                                                                                                                            Overview
                                                                                                                                                                                                                                        £9.7m          £12.9m
                   FV Δ                                        £10.8m                                                                                                                    FV Δ                    £6.7m
                                                                                                                   NAV/                                                                                                                   NAV/
              Mar-21                           £32.6m                                                              Cash                                    IRR                         Mar-21           £12.9m                            Cash            IRR
                                                                                                                  8.5x                                 114%                                                                              1.3x            50%
   Methodology: Public market multiple comparison                                                                                                                    Methodology: Calibrated price of recent transaction

16            1.   Interactive investor entered into agreement to acquire the direct-to-consumer customer book of Equiniti Financial Services (EQi) in March 2021
Significant fair value movements                                                                                                                                                                         Mar-20            Fair Value Movement                  Mar-21
Year ended 31st March 2021

                                                                                                                                                                                                                                     Exit Post-Year End

▪ Tide’s mission is to help SMEs save time                                                                       ▪ Onfido’s is building the new identity                                        ▪ Hg Capital acquired Augmentum’s
  and money in the running of their                                                                                standard. Onfido’s AI-based technology                                         holding in Dext in April 2021
  businesses, with 5% market share of                                                                              assesses over 4,500 different types of                                       ▪ Dext’s provides machine learning
  business accounts in the UK, serving over                                                                        identity documents, determining                                                technology to connect accountants,
  320,000 SMEs                                                                                                     whether they are genuine or fraudulent                                         bookkeepers and businesses

                 Awarded further                                    5%                                                                                               93%                                                Acquired                     1m
Highlights

                                                                                                                Highlights

                                                                                                                                                                                                Highlights
                                                       Key Stat

                                                                                                                                                      Key Stat

                                                                                                                                                                                                                                          Key Stat
                  £25m Grant
                                                                    Market share of
                                                                                                                                    $100m                            YoY revenue                                                                     Users on platform
                                                                                                                                Series C fundraise                   growth Q1 2020-
                                                                    UK SME banking
                                                                                                                                                                     21
FV Movement

                                                                                                                 FV Movement

                                                                                                                                                                                                 FV Movement
                                                                             Invested       Value                                                                           Invested    Value                                                                   Invested    Value
              Mar-20             £14.2m                                                                                        Mar-20     £10.9m                                                               Mar-20        £7.5m
                                                                  Overview

                                                                                                                                                                 Overview

                                                                                                                                                                                                                                                     Overview
                                                                             £11.0m       £19.0m                                                                            £7.7m      £14.9m                                                                   £7.5m      £10.5m
                FV Δ                                £4.7m                                                                        FV Δ                £4.0m                                                       FV Δ                   £3.0m
                                                                             NAV/                                                                                           NAV/                                                                                NAV/
              Mar-21                 £19.0m                                  Cash            IRR                               Mar-21       £14.9m                          Cash        IRR                    Mar-21          £10.5m                           Cash        IRR

                                                                             1.7x           34%                                                                             1.9x        42%                                                                     1.4x       32%1

    Methodology: Calibrated price of recent transaction                                                          Methodology: Public market multiple comparison                                  Methodology: Calibrated price of recent transaction

17                 1.   Dext IRR at 31st March 2021 was 32%, at exit post-year end realised gross IRR was 31%
We have a significant live pipeline of investment opportunities with
£144m under active development
Overview of Potential Deal Value in Live Pipeline1

                                                                                     £924m                                                                                                                                                                     £144m
                                                                       Total Live Pipeline                                                                                                                                      Opportunities in Active Development
                                                                                                                                                                                                                                                    Portfolio Follow-ons £13m
                                                                                                                                                                                                                                                    Digital Banking £6m
                                                                                                                                                                                                                                                    Trading Infrastructure £10m
                                                                                                          Active 2
                                                                                                       Development                                                                                                                                  Banking Infra £11m
                                                                                                          £144m
                                                                                                                                                                                                                                                    Workflow Software £13m

                                                                                                                                                                                                                                                    Insurtech £14m

                                                                                                                                                                                                                                                    Payments £18m

                                                                                            3
                                                       Watchlist & New                                                                                                                                                                              Regtech £27m
                                                           £780m

                                                                                                                                                                                                                                                    Digital Asset Infrastructure £32m

1. As at 14th May 2021
2. Active Development includes live pipeline opportunities which have been progressed beyond initial meeting
3. Watchlist & New includes live pipeline opportunities which are approaching first meeting (New) and companies which have progressed beyond first meeting and been assigned for follow-up when appropriate fundraising process kicks off (Watchlist)

18
The diversity in our pipeline showcases our multi-stage,
pan-European investment strategy

 Opportunities in Active Development by Stage1                     Opportunities in Active Development by Geography1

                                 Series A   Series B   Series C+
                                                                                   +1 US
                                 24                    £144m

                                 25%                     24%

                                 25%                     28%                                         1

                                 50%                     49%

                              Deal Count                Value

                                                                                     Geographical Split of Live Opportunities
      ▪ Our fund structure allows us to capitalise on a
        broader opportunity set than most funds                                                          UK             Non-UK
      ▪ Our expertise spans the growth stages                              Count                         46%              54%
                                                                           Value                         37%              63%

19   1. As at 14th May 2021
The fintech verticals represented in our live pipeline opportunities showcase areas
where we see significant opportunity
Overview of fintech verticals represented by pipeline opportunities in Active Development1                                               Opportunities in Active
                                                                                                                                            Development
                                                                                                                                                      Combined
 Vertical                        Overview of Thesis                                                                                        #
                                                                                                                                                     Ticket Value
Digital Asset                    Opportunity to build fundamental market infrastructure which will support the new asset class of
                                                                                                                                           4              £32m
Infrastructure                   digital assets
                                 Technology has the potential to transform regulatory processes and their efficacy across regulatory
Regtech                                                                                                                                    3              £27m
                                 industries including financial services
                                 Global leaders in payments will be built by leveraging new technologies to deliver better, faster,
Payments                                                                                                                                   3              £18m
                                 cheaper solutions to consumers and industry participants
                                 Large, traditional vertical waking up to the power of technology to expand product opportunities,
Insurtech                                                                                                                                  3              £14m
                                 enhance user experiences and deliver significant efficiencies
                                 Across financial services people-led processes could be performed in part or in full by software with
Workflow Software                                                                                                                          2              £13m
                                 no compromise, and often enhancement in outcomes
                                 Much of banking infrastructure is comprised of restrictive legacy technology, rebuilding technology
Banking Infrastructure                                                                                                                     2              £11m
                                 stacks using modern programming opens new opportunities for the vertical
Trading                          Technologies enabling advantaged access to new markets                                                    1              £10m
Digital Banking                  Reimagining banking interfaces and focus on personalization at scale                                      1               £6m
Portfolio Follow-ons             Our portfolio brings together a broad range of investment theses                                          5              £13m
Total                                                                                                                                     24             £144m

20      1. As at 14th May 2021
Contents

▪ Investment summary

▪ Full Year Results 31st March 2021

▪ Portfolio update

▪ Market update

▪ Appendix

21
With accelerated adoption driven by Covid and a huge
opportunity ahead, the Fintech sector is an exciting place to be

Fintech adoption trends were accelerated by                                     Fintechs and payment firms are a growing market
Covid lockdowns                                                                 presence but huge headroom remains

                                                                                Top 500 Global Banks, Payment & Fintech Firms* Share of
                                                                                Market Capitalisation
 12% of UK population downloaded an online banking
                                                                                100%
 app for the first time during the first lockdown1                                                                                                                 Fintech firms
                                                                                                                                                                   more than
                                                                                                                                                                   doubled share of
 74% of UK consumers are using less cash vs pre-covid                       2
                                                                                         90%                          89%            86%           81%
                                                                                                                                                            72%    Top 500 market
                                                                                                                                                                   cap 2019-20

 20% of US daily trading volume from retail traders in                                                                                             14%
                                                                                                                                                            17%
 2021 vs c.10% in 20193                                                                     8%                          9%           11%                    11%
                                                                                            2%                          2%            4%           5%
                                                                                         2016                        2017           2018           2019     2020

                                                                                                                     Fintechs      Payment Firms    Banks

     1.   Global Processing Services on Bdaily news
     2.   Finextra - How Covid-19 changed the UK's relationship with cash       * Estimated value used for private fintech firms
22   3.   Citadel Securities via Forbes                                         Source: The Economist
Fintech funding in Q1 is at record levels
Global Fintech Financing Volume & Deal Count, 2016-Q1’21 Run Rate
140.0
                                                                                                                                     3,024
                                                                                                                                                      3,000

120.0
                                                                                                                                     116.4
                                                                                                                                                      2,500

100.0
                                                                                                         2,006
                                                                                     1,849                                                             Funding in Q1’21
                                                                                                                                                      2,000

 80.0                   1,629           1,642                    1,663                                                                                has already topped
                                                                                                                                                      full year funding in
                                                                                                                                                      1,500

 60.0                                                             53.9                                                                                    2016 & 2017
                                                                                     45.3                   45.3
                                                                                                                                                      1,000
 40.0

                         29.0            27.0
                                                                                                                                                      500
 20.0

                                                                                                                                      29.1
   -                                                                                                                                                  -

                        2016            2017                     2018                2019                  2020                      Q1'21

                      Funding ($bn)   Annual Funding Run Rate based on Q1'21 ($bn)      Deal Count (#)           Annual Deal Count Run Rate based on Q1'21 (#)

Source: FT Partners

23
Europe is experiencing the same bounce back and
the UK continues to over-index on fintech investment
  European Fintech Financing Volume & Deal Count                                                                   UK Share of European Fintech Funding
  2016-Q1’21 Run Rate                                                                                              2016-Q1’21, %

                                                                                                                                 0%            10%         20%     30%     40%   50%    60%     70%     80%    90%
 35.0                                                                                                        700

                                                                                               621
                                                                           598                                     2016                                          22%
 30.0                                                                                                        600

                                        504           506                                     25.6
 25.0                                                                                                        500
                                                                                                                   2017                                                           48%
                      416                      402
 20.0                                                                                                        400
                                                                                                                   2018                                                                   59%

 15.0                                                                                                        300

                                                                                                                   2019                                                                                       84%
                                                      10.1                 9.9
 10.0                                   8.5                                                                  200

                                               5.0                                                                 2020                                                  32%
  5.0                                                                                                        100
                      2.7
                                                                                               6.4
   -                                                                                                         -
                                                                                                                   Q1'21                                                                          69%
                      2016              2017   2018   2019                2020               Q1'21

                       Funding ($bn)                         Annual Funding Run Rate based on Q1'21 ($bn)                                                                   Average: 52%
                       Deal Count (#)                        Annual Deal Count Run Rate based on Q1'21 (#)

Source: FT Partners                                                                                                Source: KPMG Pulse of Fintech, Sifted

24
Growing overseas investment in Europe reflects the quality,
and global potential of European fintechs
% European Fintech Financing Rounds with US-Based Investor Participation, 2016-Q1’21

50%

45%                                                                                            Increased activity from US-
                                                                                               based investors introduces
40%                                                                                    38%
                                                                                                   new co-investment
35%
                                                           32%             32%                      opportunities for
30%
                                                                                                      Augmentum
25%                          23%          22%
                      21%
20%

15%

10%

 5%

 0%

                      2016   2017         2018            2019             2020        Q1'21

Source: FT Partners

25
Leading fintechs are electing to remain private, leaving public market
investors with limited opportunity to participate in exceptional returns
Funding and Valuation History for Leading Private Fintechs, Series A-Latest Reported Funding Round1

 Payments                                                                        Lending                                         Open Banking                   Digital Banking

                                    $95bn                                                                         $31bn                          $13bn                             $6bn
                                    Latest Round                                                                  Latest Round                   Latest Round                      Latest Round
                                    EV                                                                            EV                             EV                                EV

     $100m                                                                           $11m                                         $63m                           $57m
     Series A                    950x                                                Series A                    2,818x           Series A      206x             Series A         105x
     EV                          Increase in                                         EV                          Increase in      EV            Increase in      EV               Increase in
                                 EV Series A-                                                                    EV Series A-                   EV Series A-                      EV Series A-
                                 Latest                                                                          Latest                         Latest                            Latest

     2010                             Q1’21                                          2005                          Q1’21         2012             Q1’21          2014               Q3’20

         1. Where Series A Valuation has not been publicly released, we assume 20% equity dilution at Series A
26       Source: Tracxn Company Information (Accessed 20/04/21), Press Releases
Our profile as one of Europe’s pre-eminent fintech investors continues to
gain traction
Press coverage highlights                                                                            Award Highlights

                                                          [Augmentum] offers something
                                                          truly different and the wisdom of
                                                          its choice of holdings appears
                                                          proven by their ability to withstand
                                                          the epidemic.

                                                              A fintech winner... There is no
                                                              doubt in my mind that
                                                              Augmentum is performing well.

                                                                          Augmentum Fintech
                                                                          offers tremendous
                                                                          potential.

                                        At Wellian Investment Solutions, wealth manager
                                        Richard Philbin gets exposure to private markets
                                        both by investing in dedicated private equity funds
                                        such as 3i and the venture capital fund Augmentum
                                        which provides exposure to unlisted fintech firms.

                                        ‘I’ve invested in Augmentum for a number of our
 Biggest Risers: 4. Augmentum Fintech   clients and portfolios’... It’s a really good diversifier’

27
@AugmentumF
Augmentum Fintech

   Thank you
Contents

▪ Investment summary

▪ Full Year Results 31st March 2021

▪ Portfolio update

▪ Market update

▪ Appendix

29
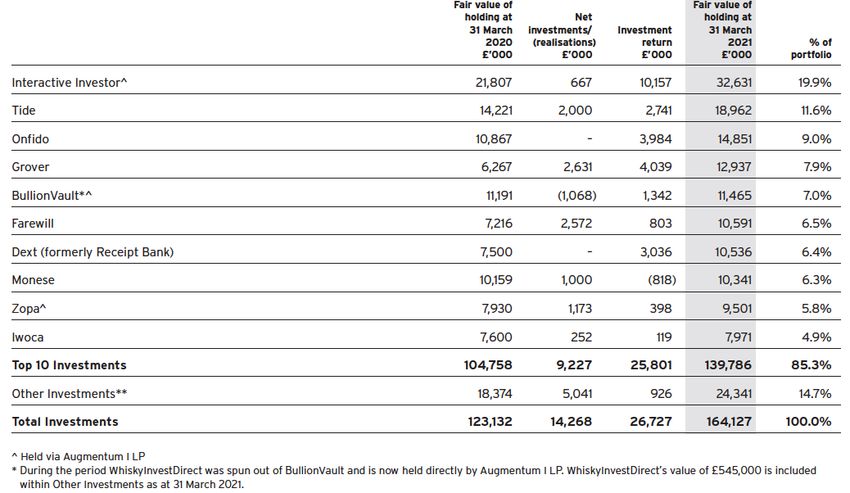
Gross Portfolio Value Table
Year Ended 31st March 2021

30
Consolidated Income Statement
Year Ended 31st March 2021

31
Top 10 holdings

                                                                                                                                            Joined                   Fair Value
Company                                Fintech Area                                                                                       Portfolio     Invested1   31st Mar-21   NAV/Cash    IRR
ii                                     Retail Investment                                                                                      Mar-18       £3.8m       £32.6m         8.5x   114%

Tide                                   SME Financial Stack                                                                                    Aug-18     £11.0m        £19.0m         1.7x   34%

Onfido                                 Regulatory Technology                                                                                  Dec-18       £7.7m       £14.9m         1.9x   42%

Grover                                 Circular Economy                                                                                       Sept-19      £7.9m       £12.9m         1.6x   50%

BullionVault                           Retail Investment                                                                                      Mar-18       £8.4m       £11.5m         1.4x   15%

Farewill                               Lifetime Wealth                                                                                        Dec-18       £6.6m       £10.6m         1.6x   31%

Dext                                   SME Financial Stack                                                                                     Jan-20      £7.5m       £10.5m         1.4x   32%2

Monese                                 Digital Banking                                                                                        May-18     £10.3m        £10.3m         1.0x      -

Zopa                                   Digital Banking                                                                                        Mar-18     £19.7m          £9.5m        0.5x      -

iwoca                                  SME Financial Stack                                                                                    Dec-18       £7.9m         £8.0m        1.0x      -

 Portfolio exit post-year end

               1.   Interactive investor, BullionVault & Zopa were part of the IPO seed portfolio acquired from Augmentum Capital in Mar-18
32             2.   Dext IRR at 31st March 2021 was 32%, at exit post-year end realised gross IRR was 31%
Our experienced senior management team are ex-operators
and entrepreneurs with deep sector expertise

Management team
                                    Senior Team

     Tim Levene      Richard Matthews         Martyn Holman      Perry Blacher

      Ellen Logan   Réginald de Wasseige          Akash Bajwa    Georgie Hazell

Advisory board

     Edward Wray        Phillip Riese             Josh Hannah   Bronek Masojada

33
Since IPO in 2018, Augmentum has built one of the largest
fintech portfolios in Europe
Venture Funds by Direct Active European Series A+ Fintech Investments, #

                                                                   Augmentum is the UKs only publicly listed,
                                                                   fintech-focused fund
                                                                                                                                                                                                                          21
     25                        25                                                                                                                                                                                         Portfolio Companies2
   +17                         +16
  Seed                        Seed                  21
                                                                                                                                                                                                                          £183.2m
                                                                        18                   18
                                                                                                                 17            17
                                                                                                                                                                                                                          Overall Net Asset Value3
                                                                     +1 Seed             +1 Seed
                                                                                                                                        15
                                                                                                                                       +1 Seed      13
                                                                                                                                                                12
                                                                                                                                                   +3 Seed                           11
                                                                                                                                                                                                    10
                                                                                                                                                                                    +3 Seed
                                                                                                                                                                                                  +1 Seed         8       8          8
                                                                                                                                                                                                                +1 Seed            +1 Seed
                                                                                                                                                                                                                                                     6
                                                                                                                                                                                                                                                  +2 Seed

                                                                                                                                                                1

                                                                                                                                                                                      Earlybird
                                                                         Balderton
                                Anthemis

                                                                                              IDInvest

                                                                                                                                                     Creandum

                                                                                                                                                                                                                                     DN Capital
     SpeedInvest

                                                                                                                  Octopus

                                                                                                                                         Partech

                                                                                                                                                                    Draper Esprit

                                                                                                                                                                                                                  Mouro

                                                                                                                                                                                                                          Paypal
                                                                                                                               Accel

                                                                                                                                                                                                                                                    EQT Ventures
                                                     Augmentum

                                                                                                                                                                                                    Northzone
                   1. Draper Esprit investment in Earlybird evaluated as a single active investment
                   2. Includes new investment into Cushon and Epsor and realisation of Dext made post-year ended 31st Mar-21

34                 3. 31st Mar-21 NAV
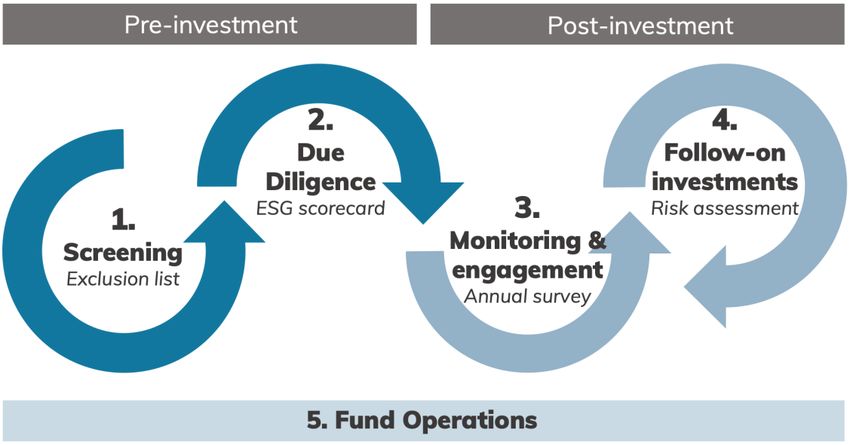
                   Source: Investor Websites, Crunchbase. Accessed 14 May-21
We have integrated a broad set of responsible investment principles
into our investment approach and fund operations

                               Pure
     Conventional              financial
                               value
     Responsible investing
     (ESG integration)

     Impact Investing
     (“Return first”)

     Impact Investing
     (“Impact first”)

     Venture philanthropy

                               Pure
     Philanthropic donations   social
                               value

35
We use a variety of valuation methodologies to value each business, tailoring the
approach to the stage & circumstances of the company
Overview of valuation methodologies applied to portfolio holdings

            Calibrated price of recent                                           Where there has been a recent funding round we take the price of Augmentum shares at the point of this transaction and
                 transaction (CPORT)                                             calibrate the value according to our analysis of the performance of the company since that date.

                    Multiple comparisons                                         Where there are comparable businesses in the public markets, we use multiple comparisons to value our portfolio company using
                                                                                 the most appropriate financial metrics for that business (e.g. Revenue, Earnings, AUA etc.).

                     Discounted cash flow                                       For more mature, profit-making businesses we use DCF forecasts to reach an estimated valuation, taking into
                                 forecast                                       account liquidity discounts.

      Convertible loan note (CLN)                                                Where CLNs have been issued we determine the value using the built-in discount and valuation cap that the note will receive
                                                                                 on the next round in conjunction with our calibrated assessment of the expected company valuation at the next funding round

                    Downside protection1                                         We employ deal terms to protect our exposure to downside risk & factor this into our valuation assessments,
                                                                                 e.g.:
                                                                                 ▪ Anti-dilution
                                                                                 ▪ Liquidation preferences
                                                                                 ▪ Ratchets
                                                                                 ▪ Warrants

                                                           BDO audit or review our valuations twice yearly
36   1. 100% of our early stage investments, and 16/18 of the total portfolio have downside protection (SRL Global and interactive investor do not have downside protection)
You can also read