Spatial-Temporal Relationship Between Population Mobility and COVID-19 Outbreaks in South Carolina: Time Series Forecasting Analysis - Journal of ...
←
→
Page content transcription
If your browser does not render page correctly, please read the page content below
JOURNAL OF MEDICAL INTERNET RESEARCH                                                                                                            Zeng et al

     Original Paper

     Spatial-Temporal Relationship Between Population Mobility and
     COVID-19 Outbreaks in South Carolina: Time Series Forecasting
     Analysis

     Chengbo Zeng1,2,3, MS; Jiajia Zhang1,3,4, PhD; Zhenlong Li1,3,5, PhD; Xiaowen Sun1,3,4, MS; Bankole Olatosi1,3,6, PhD;
     Sharon Weissman1,3,7, MD; Xiaoming Li1,2,3, PhD
     1
      South Carolina SmartState Center for Healthcare Quality, Arnold School of Public Health, University of South Carolina, Columbia, SC, United States
     2
      Department of Health Promotion, Education, and Behavior, Arnold School of Public Health, University of South Carolina, Columbia, SC, United
     States
     3
      Big Data Health Science Center, University of South Carolina, Columbia, SC, United States
     4
      Department of Epidemiology and Biostatistics, Arnold School of Public Health, University of South Carolina, Columbia, SC, United States
     5
      Geoinformation and Big Data Research Lab, Department of Geography, College of Arts and Sciences, University of South Carolina, Columbia, SC,
     United States
     6
      Department of Health Services, Policy, and Management, Arnold School of Public Health, University of South Carolina, Columbia, SC, United States
     7
      School of Medicine, University of South Carolina, Columbia, SC, United States

     Corresponding Author:
     Chengbo Zeng, MS
     South Carolina SmartState Center for Healthcare Quality
     Arnold School of Public Health
     University of South Carolina
     915 Greene Street
     Columbia, SC, 29208
     United States
     Phone: 1 8034775298
     Email: czeng@email.sc.edu

     Abstract
     Background: Population mobility is closely associated with COVID-19 transmission, and it could be used as a proximal indicator
     to predict future outbreaks, which could inform proactive nonpharmaceutical interventions for disease control. South Carolina is
     one of the US states that reopened early, following which it experienced a sharp increase in COVID-19 cases.
     Objective: The aims of this study are to examine the spatial-temporal relationship between population mobility and COVID-19
     outbreaks and use population mobility data to predict daily new cases at both the state and county level in South Carolina.
     Methods: This longitudinal study used disease surveillance data and Twitter-based population mobility data from March 6 to
     November 11, 2020, in South Carolina and its five counties with the largest number of cumulative confirmed COVID-19 cases.
     Population mobility was assessed based on the number of Twitter users with a travel distance greater than 0.5 miles. A Poisson
     count time series model was employed for COVID-19 forecasting.
     Results: Population mobility was positively associated with state-level daily COVID-19 incidence as well as incidence in the
     top five counties (ie, Charleston, Greenville, Horry, Spartanburg, and Richland). At the state level, the final model with a time
     window within the last 7 days had the smallest prediction error, and the prediction accuracy was as high as 98.7%, 90.9%, and
     81.6% for the next 3, 7, and 14 days, respectively. Among Charleston, Greenville, Horry, Spartanburg, and Richland counties,
     the best predictive models were established based on their observations in the last 9, 14, 28, 20, and 9 days, respectively. The
     14-day prediction accuracy ranged from 60.3%-74.5%.
     Conclusions: Using Twitter-based population mobility data could provide acceptable predictions of COVID-19 daily new cases
     at both the state and county level in South Carolina. Population mobility measured via social media data could inform proactive
     measures and resource relocations to curb disease outbreaks and their negative influences.

     (J Med Internet Res 2021;23(4):e27045) doi: 10.2196/27045

     https://www.jmir.org/2021/4/e27045                                                                    J Med Internet Res 2021 | vol. 23 | iss. 4 | e27045 | p. 1
                                                                                                                         (page number not for citation purposes)
XSL• FO
RenderX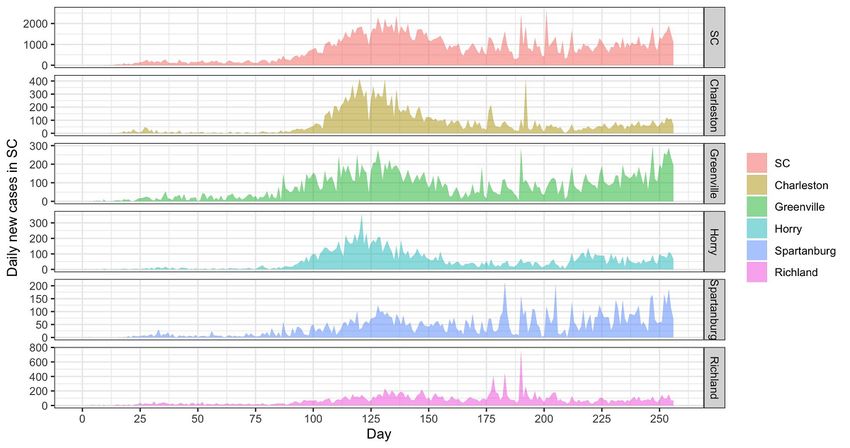
JOURNAL OF MEDICAL INTERNET RESEARCH                                                                                                   Zeng et al

     KEYWORDS
     COVID-19; mobility; incidence; South Carolina

                                                                         phases of the COVID-19 outbreak, policy reactions, and public
     Introduction                                                        holidays [14-16]. Several studies have leveraged mobility data
     Since the first confirmed case of COVID-19 in the United States     from social media (eg, Google, Facebook, Twitter) to investigate
     on January 21, 2020, countrywide COVID-19 outbreaks have            the relationship between population mobility and COVID-19
     surged. As of March 5, 2021, there were 28,580,198 cumulative       transmission [9,11,17-19]. These studies identified a consistently
     confirmed cases and 517,224 COVID-19–related deaths in the          positive relationship between population mobility and
     United States [1]. South Carolina, a state located in the           COVID-19 incidence. However, few studies used population
     southeastern United States, had its first confirmed cases on        mobility as a predictor to forecast further outbreaks and to
     March 6, 2020. From March to May 2020, the trend of daily           evaluate prediction accuracy in addition to performing
     new cases was flat, with an average daily increase in cases of      correlation analysis. A study by Wang and Yamamoto [19]
     less than 500. However, the daily new cases in South Carolina       predicted COVID-19 daily new cases in Arizona using disease
     have risen sharply since June 2020. On July 14, 2020,               surveillance data, the Google Community Mobility report, and
     COVID-19 cases in South Carolina surpassed 60,000, with more        partial differential equations. They found an acceptable
     than 2200 daily new cases, the second highest increase in one       prediction accuracy for the next 3 days, but the time window
     day in the United States [2]. Between August and October 2020,      of prediction did not cover the duration of viral incubation (ie,
     the transmission rate slowed down with the further                  14 days). Furthermore, this study only split Arizona into three
     implementation of nonpharmaceutical interventions (NPIs),           regions (ie, central, northern, and southern) rather than
     such as dine-in service restrictions and face-covering              examining prediction accuracy at both the state and county level.
     requirements, but increased steadily after October. By March        In fact, there may be geospatial differences in population
     5, 2021, there were 448,275 reported cases and 7697 deaths in       mobility due to the plausible differential implementation fidelity
     South Carolina [3].                                                 of NPIs and reactions to reopening policies by county [20,21].
                                                                         Additionally, there may be geospatial differences in the
     Given the rapid transmission of COVID-19 and limited options        estimation of population mobility on social media as the number
     in terms of medical interventions, forecasting is of critical       of users and their demographic characteristics may differ by
     importance as it could predict the spread of disease, estimate      county. All these differences may result in variations in
     the impacts of NPIs, and inform further decision making             prediction accuracy at the county level, and further studies are
     regarding public health interventions [4]. During the COVID-19      needed in this regard.
     pandemic, decision makers in the United States need to balance
     the net losses arising from social interruptions, economic          Prior research has predicted COVID-19 incidence using disease
     damage, and indirect effects on health caused by NPIs with the      surveillance data and several different time series methods.
     direct health benefits of disease control [5]. Accurate and         Most of the studies successfully incorporated the association
     reasonable forecasting of COVID-19 could minimize the disease       of the current incidence with the previous incidence using time
     burden in health care settings and the loss of health and life in   series methods such as autoregressive, moving average,
     different phases of reopening plans [5,6].                          autoregressive integrated moving average (ARIMA), and
                                                                         Holt-Winters [22]. Some studies used generalized linear
     Existing literature has suggested that population mobility may      regression with continuous outcomes (eg, rate and count),
     reflect the influences (both positive and negative) of NPIs,        without including time series [23]. However, there were few
     reopening actions, and public holidays [7-9]. For instance, in      studies that simultaneously considered time-varying population
     the early stages of the COVID-19 pandemic, the governor of          mobility. Recently, Liboschik and colleagues [24] suggested
     South Carolina issued a series of NPIs, such as shelter-in-place    that count time series following generalized linear models could
     and the closure of schools and nonessential businesses, to reduce   overcome the limitations of classic time series methods. Based
     social interaction. These NPIs showed positive effects in           on the generalized linear model methodology, a suitable
     suppressing the statewide spread of COVID-19. Later, in May         distribution for count data and appropriate link function could
     2020, reopening policies and public holidays diluted the            be specified, and the effect of the time-varying covariate could
     implementation of NPIs, leading to increased social interactions    be tested and integrated into forecasting. In this study, we
     and statewide COVID-19 spread [10,11]. At present, it may be        adopted the Poisson count time series model and time-varying
     difficult to directly measure the real-time impact of reopening     population mobility data extracted from Twitter, which may
     policies, public holidays, and NPI implementation fidelity.         increase the accuracy of COVID-19 prediction.
     Therefore, population mobility may be a proximal indicator
     allowing for real-time COVID-19 transmission forecasting.           To address these knowledge gaps, by leveraging disease
                                                                         surveillance data and Twitter-based population mobility, this
     Social media platforms, such as Twitter, collect geospatial         study aimed to construct Poisson count time series models of
     information and closely monitor changes in population mobility      COVID-19 daily new cases, investigate the relationship between
     [12,13]. Indeed, the tremendous volume of user-generated            them, and evaluate the prediction accuracy of daily new cases
     geoinformation from social media enables the real-time or near      for the next two-week window at both the state and county level
     real-time surveillance of population mobility and provides timely   in South Carolina.
     data on how population mobility changes in response to different

     https://www.jmir.org/2021/4/e27045                                                           J Med Internet Res 2021 | vol. 23 | iss. 4 | e27045 | p. 2
                                                                                                                (page number not for citation purposes)
XSL• FO
RenderX
JOURNAL OF MEDICAL INTERNET RESEARCH Zeng et al
training data set, and those from the next 3 days (days 235-237)
Methods were used as a testing data set for the purpose of model
COVID-19 Incidence Data evaluation. With the smallest prediction error (equation 1) and
good interpretation, the predictive model with the best time
Cumulative confirmed cases of COVID-19 through November window was selected. After the best time window in the first
11, 2020, at both the state and county level in South Carolina round selection was determined, second- and third-round
were collected from The New York Times data set, which was selections were conducted to narrow down the time window
deposited in GitHub [25]. The data set was compiled using data and obtain the final model with the smallest prediction error.
from state and local governments and health departments, The final model was used to predict the COVID-19 daily new
ensuring its accuracy. Within the study period (March 6, 2020 cases for the next 3, 7, and 14 days (days 238-251). The
[date of first COVID diagnosis in South Carolina] to November cumulative difference (equation 2) between observed and
11, 2020 [251st day]), daily new cases were calculated by predicted cases and mean absolute percentage accuracy
subtracting the cumulative confirmed cases of the previous day (equation 3) for each time frame were reported [19]. The
from the total cases for the entire state and its five counties with equations used are as follows:
the largest numbers of cumulative confirmed cases (ie,
Charleston, Greenville, Horry, Spartanburg, and Richland). The
study protocol was approved by the Institutional Review Board
at the University of South Carolina.
Population Mobility
Population mobility was determined using the number of people
(Twitter users) with a moving distance greater than 0.5 miles
per day in South Carolina and the selected counties. The In equations 1-3, d represents the day; n is the next 3, 7, or 14
methodology of extracting daily population movement days; o is the observed value, p is the predicted value, and x
(origin-destination flows) from geotagged tweets is discussed represents the daily new cases.
elsewhere [26,27]. Briefly, geotagged tweets during the study
Finally, a similar analytic procedure was performed to construct
periods were collected and used for calculation. Only users who
the final model at the county level for each of the top five
posted at least twice per day or posted tweets on at least two
counties (ie, Charleston, Greenville, Horry, Spartanburg, and
consecutive days were included in the calculation. Daily travel
Richland) in South Carolina. A Poisson count time series model
distance was calculated for each user based on the derived
was conducted using an R package (“tscount”). Table S1 in
origin-destination flows and used to generate a variable of how
Multimedia Appendix 1 provides a detailed description of the
many people moved each day (with a travel distance greater
data acquisition process, scripts for analysis and figures, and a
than 0.5 miles). This method of capturing population mobility
link to data resources.
using Twitter has been previously validated [16,26].
Statistical Analysis Results
First, daily new cases of COVID-19 and population mobility
Descriptive Statistics
at both the state and county level were described using line
charts in R (version 3.6.3; R Foundation for Statistical Figure 1 shows the changes in COVID-19 daily new cases at
Computing; “ggplot” package). Daily new cases and mobility both the state and county level. By October 31, 2020, there were
were also described using five quantiles (ie, minimum, 25th 176,612 cumulative confirmed COVID-19 cases in South
percentile, 50th percentile, 75th percentile, and maximum) for Carolina. The cumulative confirmed cases in Charleston,
each month. Greenville, Horry, Spartanburg, and Richland were 17,384,
18,021, 12,591, 9290, and 17,531, respectively. At the state
Second, a Poisson count time series model was used to model level, the daily new cases from March to the end of May were
the impact of population mobility on the daily new cases of less than 500. From June to the middle of July, the number of
COVID-19 at the state level. Time series models were built at daily new cases rose, with 2217 new patients with confirmed
various time windows. For the first-round selection, a total of COVID-19 on July 14. After that, the transmission rate
17 time windows (by 7-day increments) were considered, decreased, with most daily new case counts staying under 1500.
including 1-7 days, 1-14 days,…, and 1-119 days. The daily However, since October 2020, the daily new cases have steadily
new cases from the first to the 234th day were used as the increased.
https://www.jmir.org/2021/4/e27045 J Med Internet Res 2021 | vol. 23 | iss. 4 | e27045 | p. 3
(page number not for citation purposes)
XSL• FO
RenderXJOURNAL OF MEDICAL INTERNET RESEARCH Zeng et al
Figure 1. Daily COVID-19 new cases at both state and county level in South Carolina. SC: South Carolina.
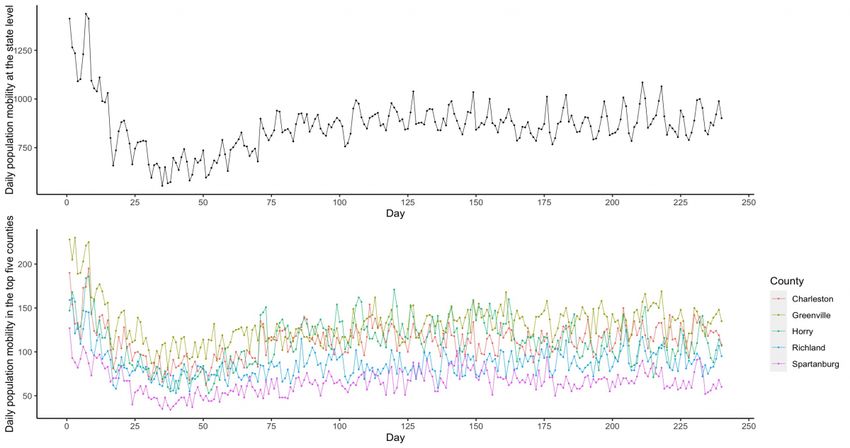
At the county level, the top five counties showed a similar trend Although there were slight increases from the middle of April
of COVID-19 outbreaks and accounted for more than 40% of to that of June, the numbers were consistently around 1000 after
the total cases in South Carolina. The daily new cases increased this timeframe. At the county level, each of the five counties
earlier in Greenville than in the other four counties (ie, had less than 200 people with a moving distance greater than
Charleston, Horry, Spartanburg, and Richland). 0.5 miles after the middle of March. Figure 2 shows the changes
in population mobility at both the state and county level. Table
Trends for population mobility at both the state and county level
S2 in Multimedia Appendix 1 presents the descriptive statistics
were similar. The number of people in South Carolina (Twitter
of population mobility and COVID-19 new cases at both the
users in our data) with a moving distance of more than 0.5 miles
state and county level.
decreased from 1400 to 550 between March 6 and April 9, 2020.
Figure 2. Daily population mobility at both state and county level in South Carolina.
https://www.jmir.org/2021/4/e27045 J Med Internet Res 2021 | vol. 23 | iss. 4 | e27045 | p. 4
(page number not for citation purposes)
XSL• FO
RenderXJOURNAL OF MEDICAL INTERNET RESEARCH Zeng et al
Model Selection of Time Series Analyses At the county level, a similar modelling procedure was
Following the model selection procedure, a Poisson count time employed. Population mobility was consistently and positively
series model of COVID-19 incidence at the state level was associated with new cases of COVID-19 across the top five
constructed using daily new cases and population mobility. counties. The best time windows for Charleston, Greenville,
Population mobility was positively associated with state-level Horry, Spartanburg, and Richland were 9, 14, 28, 20, and 9
COVID-19 daily new cases (β=.818, 95% CI .761-.876), and days, respectively. Table 1 displays the detailed results of the
the model using the past 7 days (1-7 days) as the time window final model, the correlation analysis, and the 3-day prediction
had the smallest prediction error (Table 1). The prediction error error at both the state and county level.
of new cases in the next 3 days (days 235-237) was 0.294.
Table 1. The impacts of population mobility on COVID-19 outbreaks in South Carolina.
Parameters State level County level
Charleston Greenville Horry Spartanburg Richland
Model training
Time windows (days) 1-7 1-9 1-14 1-28 1-20 1-9
Coefficient of population mobil- 0.818 (0.761- 0.486 (0.338- 0.278 (0.165- 0.395 (0.275- 0.270 (0.118- 0.157 (0.067-
ity (95% CI) 0.876) 0.634) 0.390) 0.515) 0.422) 0.246)
Model evaluation (3-day predic- 0.294 2.032 0.214 3.146 0.427 0.396
tion error)
3-day forecasting
Cumulative difference 42 30 28 40 66 81
Accuracy (%) 98.7 85.1 93.3 69.0 76 72.2
7-day forecasting
Cumulative difference 670 110 147 45 175 144
Accuracy (%) 90.9 76.7 85.2 85.9 68.3 76.8
14-day forecasting
Cumulative difference 2858 272 541 217 452 329
Accuracy (%) 81.6 72.1 74.5 72.6 60.3 73.6
mobility and COVID-19 daily new cases and forecast
COVID-19 Daily New Cases Forecasting transmission during the next 14 days at both the state and county
Table 1 also presents the results of forecasting and prediction level in South Carolina. Results revealed that population
accuracy. Using the final models with the selected time mobility was significantly and positively associated with new
windows, COVID-19 daily new cases were forecasted for the daily COVID-19 cases. Using the selected models to forecast
next 14 days at both the state and county level. At the state level, COVID-19 transmission, we found that although the prediction
the 3-day cumulative difference and prediction accuracies were accuracy at the state level and most of the selected counties
42 and 98.7%, respectively. As compared to the 3-day prediction decreased as the time span increased, the prediction accuracy
accuracy, the 7- and 14-day accuracies reduced to 90.9% and remained acceptable. To the best of our knowledge, this is the
81.6%, respectively. At the county level, among the top five first study that combined correlation analysis and forecasting
counties, the 3-day prediction accuracy ranged from together to investigate the impacts of population mobility on
69.0%-93.3%. The prediction accuracy deceased in Charleston, COVID-19 transmission at both the state and county level.
Greenville, and Spartanburg with increased time span. In
contrast, the prediction accuracy in Horry and Richland Population mobility could reflect the impacts of NPIs, reopening
increased in the 7-day prediction but decreased in the 14-day policies, and public holidays, and estimate social movement
prediction. The 14-day prediction accuracies for Horry and during the current COVID-19 pandemic. It is closely related to
Richland were closer to their values in the 3-day prediction. COVID-19 outbreaks, which is in accordance with the findings
Table S2 in Multimedia Appendix 1 presents the predicted and of prior research [9,11,17-19]. This study adds value to previous
observed cases of COVID-19 in the final models. studies by examining the impacts of population mobility on
COVID-19 incidence at both the state and county level in South
Discussion Carolina. The results revealed a positive association of
population mobility with daily new COVID-19 cases. However,
Principal Findings it should be noted that the population mobility data used in our
study only reflected the mobility of people who used Twitter,
This study leveraged disease surveillance data and Twitter-based
although such mobility data have been validated to be a good
population mobility data to test the relationship between
proxy of actual human movement during the pandemic
https://www.jmir.org/2021/4/e27045 J Med Internet Res 2021 | vol. 23 | iss. 4 | e27045 | p. 5
(page number not for citation purposes)
XSL• FO
RenderXJOURNAL OF MEDICAL INTERNET RESEARCH Zeng et al
[16,26,27]. Additionally, those Twitter users tended to be young, modelling rate, ARIMA and Holt-Winters are more appropriate
which might influence how much and what they tweet. The than the Poisson count time series model. Regarding machine
sociodemographic characteristics of Twitter users may be learning, most models are applied to the prediction of binary or
potential confounders, which were not controlled for in our categorical variables, and future studies are needed to apply
study. Thus, caution is needed when interpreting our findings. them to predicting the count outcome with time-varying
Future studies are needed to consider and control for the population mobility.
sociodemographic characteristics of Twitter users.
The use of population mobility data has potential implications
Using Twitter-based mobility data to predict daily new for future research and practices to curb COVID-19 outbreaks.
COVID-19 cases could yield acceptable accuracy, which could From a research perspective, research on mobility and
also justify the prediction efficacy of this indicator. The high COVID-19 could be studied at the state, county, and/or zip code
prediction accuracy at the state level was consistent with Wang’s level. In addition, mobility around different locations could
finding in Arizona [19]. However, such a high prediction provide detailed information regarding COVID-19 transmission,
accuracy was not found at the county level. One possible identify the most relevant mobility associated with daily new
explanation for this finding is that we did not capture or account cases, and inform tailored interventions on social distancing by
for the influences of contextual factors (ie, population density) location to control disease outbreaks. Furthermore, the geospatial
and the roles of mitigating factors (eg, wearing a face mask, difference in the prediction accuracy of population mobility for
practicing social distancing) [18,19,28]. Additionally, the daily new cases by county suggested that contextual
Twitter-based mobility data did not differentiate between social factors—such as demographic characteristics and the
movement at different locations, such as parks, workplaces, and implementation fidelity of NPIs at the county level—should be
retail locations, which have different impacts on COVID-19 accounted for in future research. Finally, since the incubation
incidence [9]. Finally, in this study, we only captured population and transmission of COVID-19 are closely associated with
mobility at the state and county level, while population mobility time-varying factors, such as temperature and weather, such
at the zip code level might provide a more accurate prediction. impacts should be accounted for in forecasting studies [29].
Nevertheless, the findings generated from our study confirmed Regarding the practice of disease control and prevention,
the spatial-temporal relationship between Twitter-based mobility leveraging social media platforms to monitor daily population
and COVID-19 outbreaks in South Carolina and the acceptable mobility could improve predictions of further COVID-19
prediction efficacy of population mobility. transmission, inform proactive NPIs, and guide the allocation
of health care resources to reduce disease morbidity and
Our findings provide empirical evidence to support the
mortality [30,31].
application of Poisson count time series and time-varying
population mobility data in improving the accuracy of Conclusions
COVID-19 forecasting. Compared with the existing literature, Population mobility was positively associated with COVID-19
our models yielded acceptable prediction accuracy for two-week transmission at both the state and county level in South Carolina.
forecasting at both the state and county level. Time-varying Using Twitter-based mobility data could enable acceptable
population mobility could be incorporated into other forecasting predictions of COVID-19 daily new cases. The use of social
models, such as classic time series methods and machine media data to monitor population mobility and predict
learning [22,24]. Since we are particularly interested in count COVID-19 spread could inform proactive measures to curb
data, we preferred the Poisson count time series model. When disease outbreaks and plan coordinated responses.
Acknowledgments
This study was supported by the National Institute of Health (NIH) Research Grant R01AI127203-04S1 by National Institute of
Allergy and Infectious Diseases and National Science Foundation (NSF) grant number 2028791.
Conflicts of Interest
None declared.
Multimedia Appendix 1
Supplementary data.
[DOCX File , 38 KB-Multimedia Appendix 1]
References
1. Centers for Disease Control and Prevention. Coronavirus Disease 2019 (COVID-19): Cases & Deaths in the US. 2021.
URL: https://www.cdc.gov/coronavirus/2019-ncov/index.html [accessed 2021-04-06]
2. Bohatch E. SC sees more than 2,200 coronavirus cases, second highest increase in one day. The State. 2020 Jul 14. URL:
https://www.thestate.com/news/coronavirus/article244215817.html [accessed 2021-04-06]
3. South Carolina Department of Health and Environmental Control. SC Demographic Data (COVID-19). 2021. URL: https:/
/scdhec.gov/covid19#coviddata [accessed 2021-04-06]
https://www.jmir.org/2021/4/e27045 J Med Internet Res 2021 | vol. 23 | iss. 4 | e27045 | p. 6
(page number not for citation purposes)
XSL• FO
RenderXJOURNAL OF MEDICAL INTERNET RESEARCH Zeng et al
4. National Center for Immunization and Respiratory Diseases (NCIRD), Division of Viral Diseases. COVID-19 Forecasting:
Background Information. 2020 Oct 06. URL: https://www.cdc.gov/coronavirus/2019-ncov/cases-updates/forecasting.html
[accessed 2021-04-06]
5. IHME COVID-19 Forecasting Team. Modeling COVID-19 scenarios for the United States. Nat Med 2021 Jan 23;27(1):94-105
[FREE Full text] [doi: 10.1038/s41591-020-1132-9] [Medline: 33097835]
6. National Center for Immunization and Respiratory Diseases (NCIRD), Division of Viral Diseases. Estimated Disease
Burden of COVID-19. 2021 Jan 19. URL: https://www.cdc.gov/coronavirus/2019-ncov/cases-updates/burden.html [accessed
2021-04-06]
7. Drake TM, Docherty AB, Weiser TG, Yule S, Sheikh A, Harrison EM. The effects of physical distancing on population
mobility during the COVID-19 pandemic in the UK. The Lancet Digital Health 2020 Aug;2(8):e385-e387. [doi:
10.1016/s2589-7500(20)30134-5]
8. Wang S, Liu Y, Hu T. Examining the Change of Human Mobility Adherent to Social Restriction Policies and Its Effect on
COVID-19 Cases in Australia. Int J Environ Res Public Health 2020 Oct 29;17(21):7930 [FREE Full text] [doi:
10.3390/ijerph17217930] [Medline: 33137958]
9. Sulyok M, Walker M. Community movement and COVID-19: a global study using Google's Community Mobility Reports.
Epidemiol Infect 2020 Nov 13;148:e284. [doi: 10.1017/s0950268820002757]
10. Gibbs H, Liu Y, Pearson CAB, Jarvis CI, Grundy C, Quilty BJ, LSHTM CMMID COVID-19 working group, et al. Changing
travel patterns in China during the early stages of the COVID-19 pandemic. Nat Commun 2020 Oct 06;11(1):5012 [FREE
Full text] [doi: 10.1038/s41467-020-18783-0] [Medline: 33024096]
11. Xiong C, Hu S, Yang M, Luo W, Zhang L. Mobile device data reveal the dynamics in a positive relationship between
human mobility and COVID-19 infections. Proc Natl Acad Sci U S A 2020 Nov 03;117(44):27087-27089 [FREE Full text]
[doi: 10.1073/pnas.2010836117] [Medline: 33060300]
12. Hawelka B, Sitko I, Beinat E, Sobolevsky S, Kazakopoulos P, Ratti C. Geo-located Twitter as proxy for global mobility
patterns. Cartogr Geogr Inf Sci 2014 May 27;41(3):260-271 [FREE Full text] [doi: 10.1080/15230406.2014.890072]
[Medline: 27019645]
13. Martin Y, Li Z, Ge Y. Towards real-time population estimates: introducing Twitter daily estimates of residents and
non-residents at the county level. arXiv. Preprint posted online on November 26, 2020. [FREE Full text]
14. Yang C, Sha D, Liu Q, Li Y, Lan H, Guan WW, et al. Taking the pulse of COVID-19: a spatiotemporal perspective.
International Journal of Digital Earth 2020 Aug 25;13(10):1186-1211. [doi: 10.1080/17538947.2020.1809723]
15. Li Z, Li X, Porter D, Zhang J, Jiang Y, Olatosi B, et al. Monitoring the Spatial Spread of COVID-19 and Effectiveness of
Control Measures Through Human Movement Data: Proposal for a Predictive Model Using Big Data Analytics. JMIR Res
Protoc 2020 Dec 18;9(12):e24432 [FREE Full text] [doi: 10.2196/24432] [Medline: 33301418]
16. Huang X, Li Z, Jiang Y, Ye X, Deng C, Zhang J, et al. The characteristics of multi-source mobility datasets and how they
reveal the luxury nature of social distancing in the U.S. during the COVID-19 pandemic. International Journal of Digital
Earth 2021 Feb 17:1-19. [doi: 10.1080/17538947.2021.1886358]
17. Bisanzio D, Kraemer MU, Bogoch II, Brewer T, Brownstein JS, Reithinger R. Use of Twitter social media activity as a
proxy for human mobility to predict the spatiotemporal spread of COVID-19 at global scale. Geospat Health 2020 Jun
15;15(1):2020 [FREE Full text] [doi: 10.4081/gh.2020.882] [Medline: 32575957]
18. Gatalo O, Tseng K, Hamilton A, Lin G, Klein E, CDC MInD-Healthcare Program. Associations between phone mobility
data and COVID-19 cases. Lancet Infect Dis 2020 Sep 15:1 [FREE Full text] [doi: 10.1016/S1473-3099(20)30725-8]
[Medline: 32946835]
19. Wang H, Yamamoto N. Using a partial differential equation with Google Mobility data to predict COVID-19 in Arizona.
Math Biosci Eng 2020 Jul 13;17(5):4891-4904 [FREE Full text] [doi: 10.3934/mbe.2020266] [Medline: 33120533]
20. Kishore N, Kiang MV, Engø-Monsen K, Vembar N, Schroeder A, Balsari S, et al. Measuring mobility to monitor travel
and physical distancing interventions: a common framework for mobile phone data analysis. The Lancet Digital Health
2020 Nov;2(11):e622-e628. [doi: 10.1016/s2589-7500(20)30193-x]
21. Chow TE, Choi Y, Yang M, Mills D, Yue R. Geographic pattern of human mobility and COVID-19 before and after Hubei
lockdown. Annals of GIS 2020 Nov 11:1-12. [doi: 10.1080/19475683.2020.1841828]
22. Lynch C, Gore R. Short-Range Forecasting of COVID-19 During Early Onset at County, Health District, and State
Geographic Levels Using Seven Methods: Comparative Forecasting Study. J Med Internet Res 2021 Mar 23;23(3):e24925
[FREE Full text] [doi: 10.2196/24925] [Medline: 33621186]
23. Chan S, Chu J, Zhang Y, Nadarajah S. Count regression models for COVID-19. Physica A 2021 Feb 01;563:125460 [FREE
Full text] [doi: 10.1016/j.physa.2020.125460] [Medline: 33162665]
24. Liboschik T, Fokianos K, Fried R. tscount: An R Package for Analysis of Count Time Series Following Generalized Linear
Models. J Stat Soft 2017;82(5):a. [doi: 10.18637/jss.v082.i05]
25. The New York Times. Coronavirus (Covid-19) Data in the United States. 2020. URL: https://github.com/nytimes/
covid-19-data [accessed 2021-04-06]
26. Huang X, Li Z, Jiang Y, Li X, Porter D. Twitter reveals human mobility dynamics during the COVID-19 pandemic. PLoS
One 2020 Nov 10;15(11):e0241957 [FREE Full text] [doi: 10.1371/journal.pone.0241957] [Medline: 33170889]
https://www.jmir.org/2021/4/e27045 J Med Internet Res 2021 | vol. 23 | iss. 4 | e27045 | p. 7
(page number not for citation purposes)
XSL• FO
RenderXJOURNAL OF MEDICAL INTERNET RESEARCH Zeng et al
27. Li Z, Huang X, Ye X, Li X. ODT Flow Explorer: Extract, Query, and Visualize Human Mobility. arXiv. Preprint posted
online on November 26, 2020.
28. Badr HS, Du H, Marshall M, Dong E, Squire MM, Gardner LM. Association between mobility patterns and COVID-19
transmission in the USA: a mathematical modelling study. The Lancet Infectious Diseases 2020 Nov;20(11):1247-1254.
[doi: 10.1016/s1473-3099(20)30553-3]
29. Carlson CJ, Gomez ACR, Bansal S, Ryan SJ. Misconceptions about weather and seasonality must not misguide COVID-19
response. Nat Commun 2020 Aug 27;11(1):4312 [FREE Full text] [doi: 10.1038/s41467-020-18150-z] [Medline: 32855406]
30. Kurian SJ, Bhatti AUR, Ting HH, Storlie C, Shah N, Bydon M. Utilization of Mobility Data in the Fight Against COVID-19.
Mayo Clin Proc Innov Qual Outcomes 2020 Dec;4(6):733-735 [FREE Full text] [doi: 10.1016/j.mayocpiqo.2020.10.003]
[Medline: 33134851]
31. Buckee CO, Balsari S, Chan J, Crosas M, Dominici F, Gasser U, et al. Aggregated mobility data could help fight COVID-19.
Science 2020 Apr 10;368(6487):145-146. [doi: 10.1126/science.abb8021] [Medline: 32205458]
Abbreviations
ARIMA: autoregressive integrated moving average
NPI: nonpharmaceutical intervention
Edited by C Basch; submitted 08.01.21; peer-reviewed by R Gore, L Jordan; comments to author 09.02.21; revised version received
08.03.21; accepted 23.03.21; published 13.04.21
Please cite as:
Zeng C, Zhang J, Li Z, Sun X, Olatosi B, Weissman S, Li X
Spatial-Temporal Relationship Between Population Mobility and COVID-19 Outbreaks in South Carolina: Time Series Forecasting
Analysis
J Med Internet Res 2021;23(4):e27045
URL: https://www.jmir.org/2021/4/e27045
doi: 10.2196/27045
PMID: 33784239
©Chengbo Zeng, Jiajia Zhang, Zhenlong Li, Xiaowen Sun, Bankole Olatosi, Sharon Weissman, Xiaoming Li. Originally published
in the Journal of Medical Internet Research (http://www.jmir.org), 13.04.2021. This is an open-access article distributed under
the terms of the Creative Commons Attribution License (https://creativecommons.org/licenses/by/4.0/), which permits unrestricted
use, distribution, and reproduction in any medium, provided the original work, first published in the Journal of Medical Internet
Research, is properly cited. The complete bibliographic information, a link to the original publication on http://www.jmir.org/,
as well as this copyright and license information must be included.
https://www.jmir.org/2021/4/e27045 J Med Internet Res 2021 | vol. 23 | iss. 4 | e27045 | p. 8
(page number not for citation purposes)
XSL• FO
RenderXYou can also read