PEDESTRIAN SIMULATION OF METRO RAIL TRANSIT (MRT) LINE 7 STATION 1-NORTH AVENUE STATION, QUEZON CITY, PHILIPPINES - International Journal of GEOMATE
←
→
Page content transcription
If your browser does not render page correctly, please read the page content below
International Journal of GEOMATE, Feb., 2020, Vol.18, Issue 66, pp.156-162
 ISSN: 2186-2982 (P), 2186-2990 (O), Japan, DOI: https://doi.org/10.21660/2020.96320
 Geotechnique, Construction Materials and Environment

   PEDESTRIAN SIMULATION OF METRO RAIL TRANSIT (MRT)
   LINE 7 STATION 1-NORTH AVENUE STATION, QUEZON CITY,
                        PHILIPPINES

                   Romnick P. De Los Reyes1, Marloe B. Sundo2 and *Marish S. Madlangbayan2
  1
      Sustainable Transport & Infrastructure Development Consulting, Inc., Philippines; 2Department of Civil
                        Engineering, University of the Philippines Los Baños, Philippines

       *Corresponding Author, Received: 26 Sept. 2019, Revised: 14 Dec. 2019, Accepted: 31 Dec. 2019

ABSTRACT: Simulation of pedestrian flow represents an advanced approach in modeling and evaluating train
stations. In this study, pedestrian simulation was done using the simulation software Simio to assess the
passenger capacity of MRT 7 Station 1-North Avenue Station through level of service (LOS), queuing system,
and train facility utilization. This paper presents the actual situation inside the train station while predicting the
behavior of queuing pedestrians and provides an accurate estimate of the volume-to-capacity ratio of passengers
entering the station. The study’s approach debugged the conventional assignments of pedestrians currently used
in the field. The constructed three-dimensional building of the North Avenue Station served as framework for
the simulation. Sources, sinks, servers, and paths of the software were the main elements of the simulation.
Each library was defined by their time usage based on data gathered. Time usages of 1.21 sec. and 240 sec. for
sources and sinks, respectively, were used in the simulation. Servers were defined by the train facilities utilized
in the simulation, namely, automatic ticketing machines (TVM) with time usage of 43 seconds, ticketing toll
gates with 1.4 seconds, and manual ticketing windows (BOM) with 20 seconds. In addition to the libraries,
paths that provided the flow, direction, and distribution of pedestrians were calibrated using 10% for TVM users,
35% for BOM users, and 55% for others (regular tickets, beep cards, promo trips) based on data obtained.
Simulation results showed that the new proposed plan has a higher passenger capacity than the original plan.

Keywords: Pedestrian simulation, Rail transit system, Simio, Level of service

1. INTRODUCTION                                                              pedestrian simulation will be conducted as part of
                                                                             the preliminary study for the design and
    The railway system is one of the easiest and                             construction of Metro Rail Transit (MRT) Station.
most convenient ways of travelling from one place                            This approach in pedestrian analysis is expected to
to another. For this reason, many people prefer                              exceed basic operational assessments because of the
trains as their mode of transportation. Since trains                         technique’s ability to demonstrate people’s
provide comfort, uninterrupted movement, and high                            movements and frequently traveled paths, and
speed while generating low pollution and low                                 separately, levels of service (LOS) [2]. Solutions to
energy consumption, which are essential attributes                           this problem depended on the proposed plans for
of sustainable transport, a high rail-based travel                           train stations, which were solely based on site
demand is expected [1].                                                      characteristics where the building will be
    This attraction to rail transport causes heavy                           constructed. Planning of facilities was also carried
pedestrian traffic and severe congestion in train                            out based on the allotted space in the building,
stations, which has become an object of growing                              without regard to the number of people that will be
public concern. Since the increasing number of                               using the facilities. Insufficient consideration given
commuters is unavoidable, the only solution is to                            to passenger characteristics and behavior opens the
improve train station infrastructures and facilities.                        door to the search for more accurate and systematic
One proposed approach is to adopt a pedestrian                               methods of developing and designing the interior
simulation technique in order to systematically                              properties of train stations.
assess and estimate the actual movements and                                     The study will be essential in debugging the
activities of commuters inside train stations. This                          conventional subjective assignments of pedestrians
approach is based on the conventional way of                                 over train stations with more sophisticated planned
subjectively estimating the volume of commuters in                           paths. An overview of the actual situation inside the
a certain area and assuming the sufficient number of                         station provided a dynamic illustration for
facilities that can support the estimated demand.                            prospective recommendations. It helped increase
    Representing another milestone in the field of                           the capacity of the building and assign better
transportation engineering in the Philippines,                               arrangements of machine and manual ticket

                                                                     156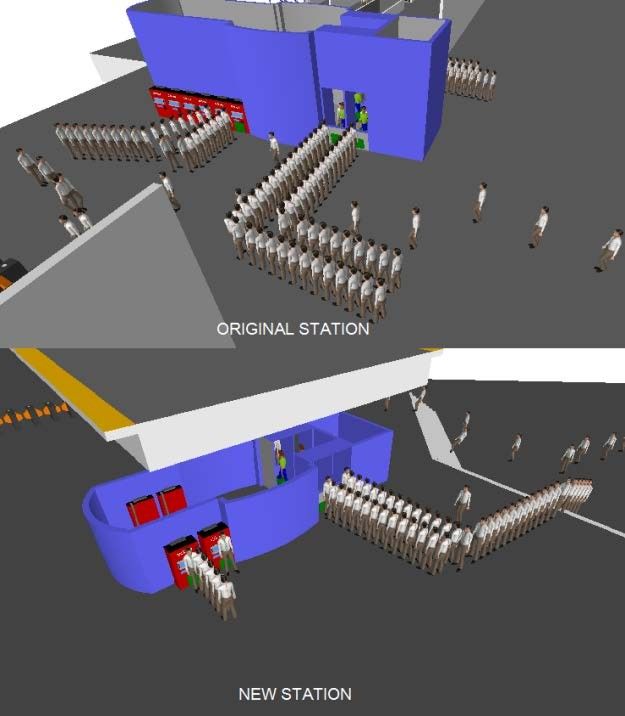
International Journal of GEOMATE, Feb., 2020, Vol.18, Issue 66, pp.156-162

vending facilities. The analysis of this simulation             consideration. The high population of the elderly in
was presented in a dynamic and illustrative way,                Japan affects the space allocated to maintain level
which can prove to be a vital tool for the                      of service transfer of passengers. The suggested
engineering industry [3].                                       travel space of a person would therefore become a
    The Metro Rail Transit Line 7 is a transportation           limitation in conducting a similar study in the
infrastructure development project proposed in                  Philippines.
2008 and greenlighted for construction in April                     A study on pedestrian accessibility was
2016. The P69.30-billion upcoming train line will               conducted in China to evaluate the capacity of urban
be serving approximately 850,000 passengers per                 rail transit systems. Using Kishi’s Logit Price
day when equipped with completed upgrades.                      Sensitivity Meter (KLP) Model, space and time
Hyundai Rotem, the supplier of LRT 1 and MRT 3                  thresholds were determined and were used to
train cars, will cover the communication, signaling             evaluate the layout of the station. Due to limited
and power supply while EEI Corporation will                     data, however, the study recommended that further
provide the elevated trackway in the construction of            research should be conducted [10].
the train system [4]. The 23.17-kilometer rail                      Aside from modeling pedestrian traffic to
composed of 14 stations will connect San Jose Del               identify the capacity of a station, level of service or
Monte in Bulacan to MRT 3 and LRT 1 [5].                        LOS is also used to evaluate train stations. A study
Expected to be completed and operational by April               conducted in Bangkok, Thailand that formulates
2020, the MRT 7 will initially accommodate                      pedestrian LOS for Thai people used LOS for
350,000 passengers and will shorten travel time by              evaluating occupancy of sidewalks in roads and
approximately 2.5 hours [6]. Despite the                        local train stations. Based on the same study, the
outstanding progress not only in the field of railway           formulated LOS has lower space but higher
transportation but also in transportation in general,           flowrate compared to Western studies [11]. Since
pedestrians were not highlighted as a major factor              Thai people, or noticeably Asians including
in the design of MRT stations [7].                              Filipinos, were smaller compared to their Western
    In line with the current thrust to resolve                  counterparts, the square meter space for pedestrian
pedestrian-related problems, pedestrian simulation              is lower than 0.82 meters per pedestrian for LOS.
in train stations was recently introduced in the                    Simulation of train passengers was also
Philippines. It offered an advanced approach toward             correlated to the increasing trend of railway
a more realistic and effective model of pedestrian              technology in the country, which follows the paths
flow in train stations. Pedestrian simulation has               of Japan and other countries. Using Simio in
broad applications, including modeling of various               running the pedestrian simulation for train stations,
scenarios, simulating different models, and                     Dalian Jiaotong University in China created a
studying behavioral patterns of people. Two of the              model of the Dalian Railway Station to obtain the
most common scenarios that can be modelled are                  maximum passenger capacity and the passenger
planning for security aspects and temporary events              arrival pattern in redesigning the station. The
where a high density of people is expected.                     research also aimed to forecast the train station’s
Simulation of different models runs from non-living             capability to accommodate the passengers arriving,
objects to people with various unique                           assess the level of service of passenger routes, and
characteristics, while behavioral patterns of people            report performance of ticketing facilities and their
are studied in populated areas like train stations,             utilization [12]. Although the present paper has
airports, and large public buildings [8]. Most                  similar objectives, pedestrian simulation of Dalian
researches on these applications have been                      Railway Station was further improved because of its
conducted in Japan, owing to the country’s                      recommendation on redesigning the facility and
advanced innovation and continuing progress in the              simulating pedestrian emergency plan.
field of railway engineering.                                       The general objective of this study is to assess
    One of the studies that focused on the                      the pedestrian capacity of MRT 7 Station 1 North
application of microscopic pedestrian simulation                Avenue Station. Specifically, it aims to model
model was conducted by Kardi Teknomo of the                     pedestrian traffic inside the MRT station on a
Institute of Lowland Technology in Saga University,             normal day peak hour basis; forecast delay and
Japan. The simulation was used to predict the                   capacity of accumulation of passengers at the
effects of new policies for train stations before their         concourse area; and evaluate the level of passenger
implementation [9]. As a futuristic approach,                   service transfer and determine train station facility
Teknomo incorporated the sense of time and                      utilization.
direction of passengers to increase the accuracy of
their movement relative to real life scenarios.                 2. MATERIALS AND METHODS
    In contrast to Teknomo’s study, policies to be
implemented here are subjective because their                       From June to July 2016, preliminary procedures
impacts cannot cover the entire population under                in creating a model from site visits in North Avenue

                                                          157
International Journal of GEOMATE, Feb., 2020, Vol.18, Issue 66, pp.156-162
and trial simulations were conducted at the office of the rules on rail transit systems in the Philippines.
STRIDE Consulting, Inc. Succeeding phases of the These machines and manual ticketing systems were
study were carried out at the College of Engineering also part of the preliminary plan for the interior
and Agro-Industrial Technology, University of the design of the station. These include the position of
Philippines Los Baños from August 2016 to May the automatic ticketing machines, windows, and
2017, with several consultations at STRIDE rooms for manual ticketing machines and toll gates
Consulting, Inc. that regulate the flow of passengers entering the
platform area. However, servers simplified the
2.1 Source of Data and Software simulation and comfort rooms and other operations
were not accounted as delays. Moreover,
Data regarding the population entering the emergency events and fluctuations in the volume of
vicinity of North Avenue were provided by passengers during holidays were excluded as
STRIDE Consulting, Inc. and were gathered from factors for the adjustments of the servers.
the official website of the Department of
Transportation (DOTr). Data reliability could be 2.3.3 Sinks
attributed to the company as the source of secondary The sinks in the software were the exits installed as
data. The software used for the simulation, SIMIO, pedestrians leave the station boarding the train. It
was also provided by the company and was licensed controlled the use of the train based on its headway,
under the University of the Philippines Diliman. frequency of trips, and capacity of the train. The
properties of the train were the key factors in the
2.2 Three-dimensional Model adjustment of the sink object in the software.
Using the 3D modeling software Sketch Up, the 2.3.4 Paths
AutoCAD version of the proposed plan for the Path analysis served as the framework of the
North Avenue Station was reconstructed into a 3D simulation because it connected the source, servers,
model. The actual dimensions of the plan were and sinks of the model. The connections were the
adapted in rebuilding the model. The design of the paths of pedestrians as they move throughout the
concourse and platform areas of the train station.
plan was obtained from Philkoei International, Inc.,
Adjustments in travel time, processing time, delays,
in coordination with the design teams of EEI and transfer times are the major contributions of this
Corporation and San Miguel Corporation. procedure and it influenced the overall outcome of
AutoCAD files of the plan were disclosed from the simulation. After setting up all the necessary
STRIDE Consulting, Inc. and was updated paths, the simulation was run and the results for
depending on the design team of the MRT 7 Rail each facility, its utilization status, and time-related
Transit System. factors in the system about pedestrian were
determined. Using the software, results were
tabulated and sorted based on the needs of the
2.3 Pedestrian Simulation
machine to be utilized. Current number of users in
the system and capacity of the system were also
The constructed 3D model of the station served determined from the results produced by the
as the foundation of the simulation. Major software. Finally, the simulation provided footages
procedures prior to the simulation include source of the behavior of queuing in the station and the
mapping, assessment of the servers, delivering the count for the maximum passenger capacity of the
exits, and path analysis. station.
2.3.1 Sources 3. RESULTS AND DISCUSSION
In source mapping, critical points in the station
for pedestrian entry were determined. These include, 3.1 Presentation of Data
but are not limited to, entrance stairs and escalators, A substantial amount of data is needed to enable
merging concourse area for two stations, and simulation of real-life scenarios inside a train
elevators. These were also composed of pedestrian station. These data were divided into three core data,
walkways from the street level calibrated to the namely, proposed plan of the station, historical data
number of people entering the train station and site survey reports. Each datum contributed to
run the replica of the rail transit system.
2.3.2 Servers
The assessment of servers, machines and 3.1.1 Proposed plans
manual ticketing systems was worked out The first essential data in the simulation were
depending on the assumptions and standards set by those obtained from the proposed plan of the North
158International Journal of GEOMATE, Feb., 2020, Vol.18, Issue 66, pp.156-162
Avenue station. The plan served as the floor of After constructing the model’s framework,
simulation as well as an aesthetic element in the historical data are the next essential data for the
simulation. The plan was then converted to a three- simulation. Data on the population, which are the
dimensional building to deliver a close-to-reality traffic per hour per station and number of monthly
image of the station. passenger traffic for 2014, were based on those data
There are two common stations for MRT 7 obtained from the official website of the DOTr.
North Avenue Station, as MRT 3 North Edsa These were the latest data available to public and
Station has been connected to the extended LRT 1 can be easily accessed and downloaded from
Roosevelt Station on the same level of elevated DOTr’s website. The arrival of passengers at North
platform train station. These original and new Edsa station with respect to the operating time of the
proposed plans for the common station will be station was the main source for the population used
located in front of SM North Edsa. The top view of in the simulation [12].
the proposed plans is shown in Fig. 1. From the available data, the peak number of
passengers is 6,818, recorded at a time interval of
8AM to 9AM. The count was from the MRT 3
North Edsa Station, which was assumed to be the
source of passengers boarding the incoming MRT 7
North Avenue Station. The peak count for
passengers were directly used in the simulation
through the source library, with 6,818 passengers
for the original plan and 8,237 passengers for the
new plan. The growth rate used was 3.2% based on
the Metro Manila Urban Transportation Integration
Study (MMUTIS) conducted in 1999.
3.1.3 Pedestrian speed
In addition to the historical data, pedestrian
speed as well as time interval in using the stairs
were incorporated in the simulation through the
time paths. Summarized in Table 1 are the speeds of
a normal male passenger and the speed of escalators
and stairs. These speeds were converted to time
intervals because time paths in Simio requires time
intervals instead of speeds. With the length of the
stairs and escalators available, time intervals were
obtained.
Table 1 Summary of speeds for passengers and
vertical components
STATION COMPONENTS SPEED(m/s)
Passengers (Tregenza, 1976) 1.70
Fig. 1 Top view of common stations Escalator (Schindler, 2007) 0.60
Stairs (Fruin, 1971) 0.57
Several assumptions were considered in the
simulation in terms of the three-dimensional model. Elevator (Schindler, 2007) 0.60
To simplify the station, various facilities of the train Note: escalator and elevator speeds were based on
station such as the communication room, 27⁰ inclination.
maintenance room, and electricity room, among
others, were omitted and represented only by 3.1.4 Delays and time usage
interior boundary walls in the concourse area. The last core data used in the simulation were
Simplifications also included openings, wherein no the delays and time usages, which were subdivided
windows and doors were visible in the model. into four major stages. These are entrance and
Lastly, exterior walls were also not drawn because security check, ticket issuance, gate passage, and
these hinder the users’ view, as well as to minimize waiting time for train departure. Security guards
the use of three-dimensional objects that slow down check the arriving passengers, thereafter passengers
the loading time. have two options: to go directly to the ticket gates
or fall in line at the manual and automatic ticket
3.1.2 Historical data windows. Passengers with tickets will then go to the
159International Journal of GEOMATE, Feb., 2020, Vol.18, Issue 66, pp.156-162
gate to enter the paid concourse area [13]. hand, the constant capacity was recorded at the 90-
An inter-arrival rate of 1.21 seconds was minute mark for the new plan.
adopted in the study [13]. During the second part of
the simulation, upon entering and undergoing
security check, passengers will use the manual
Booking Office Machine (BOM) or automatic
Token Vending Machine (TVM).
Based on the report obtained from the MRT 7
design team and Hyundai Rotem, the duration of
issuance of one ticket for TVM was 43 seconds and
20 seconds for BOM. The same report indicated that
the time processing in using the gate passage to
enter the paid concourse is 1.4 seconds. These three
major calibrations represented by servers in the Fig. 2 Maximum number of passengers
simulation were adopted to virtually present the
scenario wherein the passenger gets a ticket and
enters the gates. In addition, the same report showed
passenger distribution within the train facilities. In
the path of the simulation, 10% of the passengers
were designated to use TVM while 35% was
assigned to BOM. The remaining 55% of
passengers were assumed to have availed of promos
and reloading beep cards, wherein passengers
directly proceed to gate passages [14].
Meanwhile, the headway used in the simulation
was based on the official operations page of the
DOTC-MRT 3 website. The headway was intended Fig. 3 Maximum time in the system
for the AM peak operation of MRT 3 North Edsa
Station. Summarized in Table 2 are the time usages
The capacity for each plan was reached at
used in the calibration of sources, servers, paths and
different times, which means that one station was
sinks.
better than the other in terms of accommodating
passengers. As a station reaches its capacity,
Table 2 Summary of time usage in simulation
passengers will be more congested inside as time
progresses, decreasing the travel time, reducing
BOARDING PHASES TIME USAGE(s)
passenger convenience, and resulting in lower level
Inter-arrival Time 1.21 of service. Since the original plan reached its
TVM Usage 43 capacity first, it was the first one to experience
BOM Usage 20 severe congestion and lower level of service.
Gate Passing Time 1.4 In terms of service time, a consistent result was
Waiting Time 240 obtained, indicating that the new plan has a longer
time in the system than the original plan. Both plans
recorded at the 120-minute mark, with the new plan
registering 117.942 minutes of passenger stay while
3.2 Simulation Analysis the original plan registering 83.01 minutes. It was
Based on the simulation results panel of Simio, expected that the longest stay would be recorded at
the results produced included the capacity, service the end time mark since more passengers have
time, level of service (LOS), and utilization of already accumulated inside the train station. The
facilities. Illustrated in Fig. 2 and Fig. 3 are the 35-minute difference was long enough to decrease
results for the capacity of each station and the total rail transportation convenience and reduce
service time from entering to exiting through the passenger satisfaction.
trains. The maximum passenger capacity obtained Accounting also for queuing in the station, it
was 2,507 passengers for the new station, compared was identified that at the 7:30AM mark, 167
to the 2,031 passengers for the original station. It passengers were already in line for the BOM based
was observed that both stations reached a constant on the original plan. In contrast, only 80 passengers
capacity at some point after running the simulation have queued for the BOM at the same time mark
for more than an hour. For the original station, the based on the new plan. The 7:30AM mark was used
constant capacity was recorded at the 75-minute as the first simulation, since starting 7:00AM, the
mark. The passenger count at this point was first 15 minutes were used as warm-up period. It is
constant until the end of the simulation. On the other assumed that before the peak hour, the station was
160International Journal of GEOMATE, Feb., 2020, Vol.18, Issue 66, pp.156-162
already occupied by passengers. Illustrated in Fig. 4
are the scenarios at the two stations. These were
snapshots from the actual simulation for both
stations.
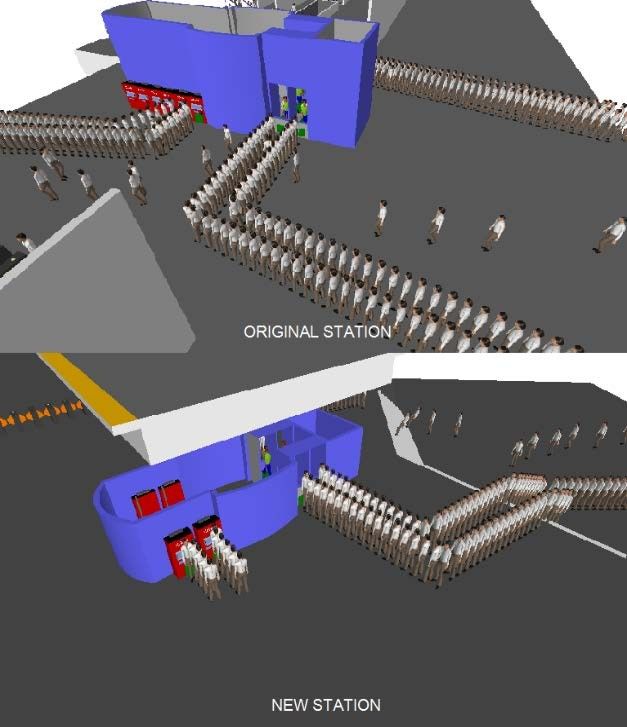
Fig. 5 Queuing at 8:30AM for both stations
Table 3 Pedestrian level of service in walkway
Fig. 4 Queuing at 7:30AM for both stations
LOS V/C Ratio
The second illustration for queuing was captured A ≤0.08
at the 8:30AM mark. At this point, peak hour was
achieved and both stations were expected to form B ≤0.28
extensive passenger lines. It was recorded that the C ≤0.40
maximum number of passengers waiting in the
queue was 394 passengers for the original plan, D ≤0.60
which is higher compared to 209 passengers for the E ≤1.00
new plan. Queuing scenarios are illustrated in Fig.
5. The severe queuing observed was corroborated F Variable
by the level of service, which is expected to be at a Note: average condition for 15 minutes.
low level.
The LOS was categorized based on the pedestrian Table 4 Level of service
level of service formulated by Kardi Teknomo in
2002, as shown in Table 3. The LOS was computed V/C RATIO(LOS)
using the average volume of passengers at each TIME
Original New
time interval divided by the capacity (volume-to- 7:00AM
capacity ratio), which are summarized in Table 4. 0.5922(D) 0.6084(E)
The volume-to-capacity ratio (V/C ratio) for the 7:15AM 0.5637(D) 0.5454(D)
original station at 8:30AM was 0.6061, resulting in 7:30AM 0.5491(D) 0.5236(D)
LOS categorized as E. On the other hand, the LOS 7:45AM 0.5259(D) 0.5173(D)
for the new plan was categorized as D for the same
8:00AM 0.5611(D) 0.5228(D)
time mark with a V/C ratio of 0.5844. The V/C ratio
was computed by taking the average number of 8:30AM 0.6061(E) 0.5844(D)
passengers as the current volume in each 15- 8:45AM 0.6197(E) 0.6152(E)
minute time interval and dividing it by the capacity
9:00AM 0.6137(E) 0.6271(E)
also in each interval. It is evident that the results
support the claim that new plan has a higher
capacity, since it only reached a lower LOS of E at For the utilization of train facilities, only TVM
8:45AM in contrast to an earlier time of 8:30AM for and BOM were analyzed. This resulted in an
the original plan. average of 99.38% utilization of BOM for the
original plan while an average of 99.04% utilization
161International Journal of GEOMATE, Feb., 2020, Vol.18, Issue 66, pp.156-162
for the new plan. High utilization of the BOMs is Pedestrian Simulation, Applications of
essential since the increase or decrease in quantity Advanced Technology in Transportation, 2006,
of this facility depends on its utilization. Moreover, pp. 13-16.
BOMs are more difficult to install since these [4] Ortega G., Groundwork for MRT 7 starts,
occupy more space and are considered structures 2017, Retrieved February 18, 2017 from
that are part of the building. In addition, TVM http://www.update.ph/2016/12/groundwork.
utilization is higher in the original station with a [5] Viray P. L., DOTC breaks ground for MRT-7.
peak of 99.04% compared to 90.70% for the new The Philippine Star, pp. 5.
station. [6] Agoncillo A., 1,858 trees must go for MRT 7.
Inquirer.net., Retrieved February 18, 2017
4. SUMMARY AND CONCLUSIONS from
http://newsinfo.inquirer.net/863807/1858.
Employing the combination of data and [7] Desiderio L., San Miguel starts work on MRT
simulation, the capacity, service time, LOS, and 7. The Philippine Star, pp. 7.
utilization of train facilities for MRT 7 were [8] Schulze T., Hanishch A., Tolujew J. and
obtained based on the original and new plans. Richter K., Online Simulation of Pedestrian
Comparing the two stations, the new plan allowed Flow in Public Buildings, in Proc. Winter
for a higher capacity of 2,507 passengers compared Simulation Conference, 2003, pp. 1635-1640.
to the 2,031-passenger capacity of the original plan. [9] Teknomo K., Application of Microscopic
The service time for the original plan is shorter, Pedestrian Simulation Model, Transportation
however, at 83.01 minutes relative to 117.94 Research Part F: Traffic Psychology and
minutes for the new plan. At the 8:30AM mark, the Behaviour, Vol. 9, Issue 1, 2006, pp.15-27.
LOS in the new plan was rated D, which is better [10] Yang R., Yan H., Xiong W. and Liu T., The
than the E rating of the original plan. Study of Pedestrian Accessibility to Rail
Finally, train facilities were more optimized in Transit Stations based on KLP Model,
the original station, with an average of 99.38% Procedia- Social and Behavioral Sciences, Vol.
utilization compared to 99.04% for the new plan. 96, 2013, pp.714-722.
However, in the context of maximum passenger [11] Gerilla G.P., Hokao K. and Takeyama Y.,
capacity, which is the focus of this study, the lead Proposed Level of Service Standards for
of the original plan in terms of facility utilization Walkways in Metro Manila, Journal of the
can be considered insignificant. Based on the Eastern Asia Society for Transportation
foregoing results, it is evident that the new plan Studies, Vol. 1, Issue 3, 1995, pp. 1041-1060.
proposed for the MRT 7 Station 1-North Avenue [12] Department of Transportation, Datasets.
Station is better than the original plan. Retrieved March 25, 2017 from
http://dotr.gov.ph/index.php/2014-09-02-05-
02-46/2015-03-13-05-20-05
5. REFERENCES [13] Agustin, D.R., Baltao, J., Nocum, A.A. and
Ortiz, F.A., Simulation of Service Window
[1] Jiten S., Guarang J., Purnima P. and Shriniwas Queues in The Metro Rail Transit (MRT)
A, Analysis of Commuter Flow Behavior in North Edsa Station. Unpublished Technical
Stairways at Metropolitan Transit Station in Paper but Accepted, 2015.
Mumbai, India. International Journal for [14] Hyundai Rotem, AFC TVM/BOM Machine
Traffic and Transportation Engineering, Vol. 5, Number Calculation Based on Site Survey in
Issue 4, 2015, pp.451-457. Manila City. Unpublished Report but
[2] Rahman K, Ghani N. A., Kamil A. A., Mustafa Accepted. Rotem-EEI Corporation
A. and Chowdhury M. A., Modelling Consortium, 2016.
Pedestrian Travel Time and the Design of
Facilities, A Queuing Approach, PLoS ONE,
Vol. 8, Issue 5, 2013, pp.e63503. Copyright © Int. J. of GEOMATE. All rights reserved,
[3] Scalici S., O’Mara P. and Dominguez R., including the making of copies unless permission is
obtained from the copyright proprietors.
Enhancing Transit Facility Design Using
162You can also read