Techniques for Precision Validation of Radar System Performance in the Field - TestEquity
←
→
Page content transcription
If your browser does not render page correctly, please read the page content below

Techniques for Precision Validation of Radar
System Performance in the Field
Using FieldFox handheld analyzers
Application Note

This application note provides an overview of field testing radar systems and Line Replaceable
Units (LRU) using high-performance FieldFox combination analyzers having multiple measurement
modes including a peak power analyzer, vector network analyzer, spectrum analyzer and vector
voltmeter. This application note will show several measurement examples of pulsed and secondary
radar signals and also reviews the basics of monopulse radar.

                                                                     Carry precision with you.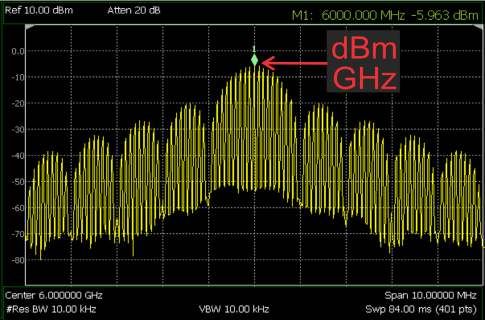
Introduction
Modern radar systems are typically classi-         For example, figure 1a shows a field                 and Line Replaceable Units (LRU) using
fied as ground-based, airborne, ship-based         measurement of a beacon interroga-                   high-performance FieldFox combination
or space borne. Radars have numerous               tion waveform captured using a peak                  analyzers having multiple measurement
applications including civilian air-traffic        power sensor and FieldFox analyzer. The              modes including a peak power analyzer,
control, meteorology, traffic enforcement          waveform includes coded-pulse pairs for              vector network analyzer, spectrum analyzer
                                                                                                        and vector voltmeter. This application note
and military air defense. Key aspects of any       requesting aircraft identity and altitude. This
                                                                                                        will show several measurement examples
radar system include frequency of operation,       time domain measurement display shows
                                                                                                        of pulsed and secondary radar signals and
waveform characteristics and antenna type.         the pulse profile as a function of time and          also reviews the basics of monopulse radar
Unmodulated continuous wave (CW) radars            includes a table for peak power, average             starting in the next section.
can measure target velocity and angular            power, pulse width and rise and fall times.
position. Range information is typically           Figure 1b shows the measured spectrum
extracted using some form of modulation            of a radar transmitter using a rectangular
such as a pulsed waveform. These types             pulsed waveform. This frequency domain
of “primary” radars work by transmitting a         measurement can be used to determine
waveform that is reflected off the target’s        the center frequency of the RF carrier as
surface and then these echoes are mea-             well as the absolute amplitude of individual
sured at the radar’s receiver. There are other     frequency components.
types of secondary or “beacon radars” cre-
ating a two-way data link between a ground         When maintaining and troubleshooting
station and an aircraft. Secondary radar           radar systems and components in the
originated from the Identification Friend or       field, it is often necessary to measure
Foe (IFF) radar system developed during            both the time domain and frequency
                                                   domain performance over a variety of test
World War II and complements the limita-
                                                   conditions. While traditional methods for
tions of the primary radar. Modern beacon
                                                   measuring time and frequency performance
systems, such as the Air Traffic Control           of radar systems included 3-4 different
Radar Beacon System (ATCRBS), separate             benchtop instruments, modern “all-in-one”
the interrogation and reply frequencies            or combination analyzers provide the most
resulting in stronger received signal levels at    convenient and economical solution to
the ground station and improved weather-           field testing. This application note provides
related performance.                               an overview of field testing radar systems

                     (a) Beacon waveform in time                                                     (b) Spectrum of a radar pulse

Figure 1. (1a) Time domain measurement of a beacon interrogation waveform and (1b) frequency domain measurement of a pulsed radar signal

                                                                         2
Monopulse radar basics
One of the most widely used radar tech-            The received signals from the sum and dif-
niques for deriving the angular information        ference antenna ports are downconverted
of a target is the monopulse system. The           and measured by the radar’s signal process-
monopulse technique can estimate these             ing subsystem for target detection. It is very
angles with higher accuracy than compa-            important that amplitude and phase tracking
rable systems while using a single (mono)          is tightly controlled between the sum and
pulse measurement in time. Figure 2 shows          difference channels otherwise errors in
a simplified block diagram of a monopulse          angle calculations will occur. A low-noise
radar with capability for determining target       stable local oscillator, or STALO, provides
angle in either elevation or azimuth. The          the signal source for the downconversion.
transmitter creates a pulsed waveform that
is applied to a duplexing network, such            One issue with this basic monopulse system
as a circulator or switch, which directs           occurs at short ranges when the antenna
the high power signal to the antenna. If           sidelobes may receive signals high enough
the antenna is mechanically rotated, the           to exceed the detection threshold and
connection between the transmitter and the         incorrectly report a target. The next section
antenna is managed through a rotary joint.         reviews a technique for suppressing any
The transmit signal is applied to the “sum”        large amplitude signals that may enter
(sigma) port of the antenna assembly which         through the sidelobes of the antenna pattern.
ideally creates a thin beamwidth pattern
that is perpendicular to the antenna plane.
This beam direction is often called the
boresight of the antenna. This transmitted
signal illuminates the target which returns
a reflected signal. The receive antenna
simultaneously creates two overlapping pat-
terns referred to as the “sum” (sigma) and
“difference” (delta) patterns. As shown in
the figure, the sum pattern maintains a peak
in the boresight direction and the difference
pattern contains a null in the boresight
direction. In this figure, the antenna pattern
sidelobes are omitted for simplicity.

                   Transmitter

           Σ                     Σ                                            Σ
                                                                                                         ∆
                                                                                                               Σ
                                           Duplexer
     IF                  RF                                      Rotary           Monopulse

           ∆                     ∆                                            ∆
  Receiver             Receiver                                  Joint             Antenna

                                                                                                    Antenna
                       STALO                                                                        Patterns

Figure 2. Simplified block diagram of a monopulse radar system

                                                                          3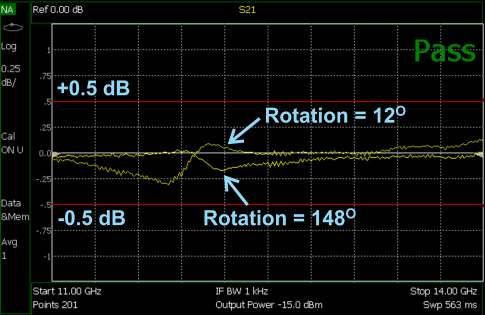
Monopulse radar with sidelobe suppression
When there is a possibility that false detec-        level in the omega channel relative to the
tions can result from energy entering the            sum channel are assumed to be signals
sidelobes in the monopulse antenna pattern,          coming from the antenna’s sidelobe. The
a secondary “omnidirectional” antenna may            total receiver gain of the omega channel
be added to the system to improve the over-          can also be adjusted and also used to
all detection performance. Figure 3 shows            cancel the undesired energy received from
the addition of a secondary receiver which           the sidelobe. The technique of adding the
includes the omnidirectional antenna with            secondary (omega) channel to improve the
pattern labeled with an “omega” symbol.              performance of a monopulse radar system
The antenna gain of the omnidirectional              is called Sidelobe Suppression (SLS). The
antenna is lower than the peak gain of               secondary channel in figure 3 also shows
the sum pattern and this gain difference             a second transmitter connected to the
will be useful when determining if a target          omnidirectional antenna through a separate
is within the boresight of the antenna.              duplexer. This auxiliary transmitter is impor-
Figure 3 includes a representation of the            tant to beacon systems when attempting to
sidelobes in the sum pattern. In the signal          identify the location of an aircraft relative
processor, the outputs from the sum, differ-         to the ground station. The next section
ence and omega channels are compared                 shows an application for using this auxiliary
and those signals having higher power                transmitter in air traffic control radar.

                  Transmitter

          Σ                     Σ         Duplexer                             Σ
     IF                 RF                                    Rotary               Monopulse

           ∆                    ∆                                              ∆
                                                                                                           ∆
  Receiver            Receiver                                Joint                 Antenna

                      STALO                                                              Ω                       Σ
     IF Ω              RF Ω               Duplexer            Rotary
                                                                               Ω     Omni
                                                                                                      Antenna
  Receiver           Receiver                                 Joint                 Antenna
                                                                                                      Patterns

                  Transmitter

Figure 3. Simplified block diagram of a monopulse radar system with sidelobe suppression (SLS)

                                                                           4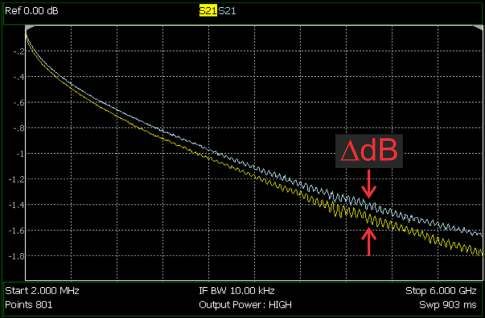
Application of sidelobe suppression to Radar
Beacon System
A typical Air Traffic Control Radar Beacon            a 21 microsecond spacing (Mode C). The           at the boresight of the antenna system
System (ATCRBS) is based on the similar               P1/P3 pulse sequence is transmitted by the       (position #1). When the aircraft is located
block diagram to the monopulse system                 high-gain sum (sigma) antenna.                   off boresight, shown as position #2 in figure
previously discussed in figure 3. The beacon                                                           4, the received P1 amplitude no longer
system is a two-way “data link” between               To avoid undesired replies from aircraft tran-   exceeds P2 and the aircraft transponder will
a ground station and a transponder that is            sponders receiving energy from a sidelobe        not reply to any ground station requests. As
installed onboard the aircraft. The data link         of the sum antenna, the ground station           the antenna system is mechanically rotated
begins when the ground station transmits              transmits a secondary pulse, shown in figure     in azimuth, the aircraft at location #2 will
an interrogation signal requesting the air-           4 as the P2 pulse. This secondary pulse is       eventually enter the main beam and prop-
craft’s identification or altitude. The aircraft      transmitted through the omnidirectional          erly reply to ground station interrogations.
transponder replies with the requested data.          (omega) antenna. The timing relationship
The ground station-to-transponder transmis-           places the P2 pulse between P1 and P3. As        During installation, periodic maintenance
sions occur at a carrier frequency of 1030            all the pulses are transmitted on the same       and troubleshooting of this or any radar
MHz. The transponder-to-ground station                1030 MHz carrier, the aircraft transponder       system, it is often required to field test and
replies are transmitted at a carrier frequency        will receive these waveforms as a single         tune the numerous functional blocks, also
                                                                                                       known as Line Replaceable Units (LRU),
of 1090 MHz. Data is encoded onto the RF              time sequence which can be used to
                                                                                                       that make up the radar. Because of the
carriers in the form of pulsed sequences              compare the relative pulse amplitudes. If
                                                                                                       unique amplitude and phase relationships
[1]. Figure 4 shows the transmitted and               the aircraft is located near the boresight       between the various channels in a mono-
received data sequences for the ground                of the antenna system, the received P1           pulse system, testing LRUs often requires
station-to-transponder link. The pulse pairs,         amplitude will exceed the P2 amplitude, as       coordinating and comparing waveforms in
P1 and P3, are transmitted at specific time           the antenna gain of the sum beam is much         the time and frequency domains. The next
intervals denoting whether aircraft identifi-         higher than the gain of the omnidirectional      section of this application note will review
cation or altitude information is requested.          antenna. Under these conditions, the air-        the various domains and measurements
For example, identification requests (Mode            craft transponder will reply to the ground       required to test the operation of the LRUs in
A) use a relative spacing between P1 and              station. Figure 4 shows the received pulse       the field.
P3 of 8 microseconds. Altitude requests use           sequence when the aircraft is positioned

   P1          P3

                                      Σ
                                          Monopulse
                                                                                                             #1
                                      ∆
                    time                                                   Antenna
                                           Antenna                         Patterns                                    P1             P3
       P2                                                 Ω                           Σ                                       P2

                                      Ω     Omni
                                           Antenna
                    time                                                                   #2
                                                                                                       P2
                                                                                                P1             P3

Figure 4. Block diagram of an Air Traffic Control Radar Beacon System (ATCRBS) showing transmit pulsed waveforms and the respective received wave-
forms at the aircraft transponder
                                                                           5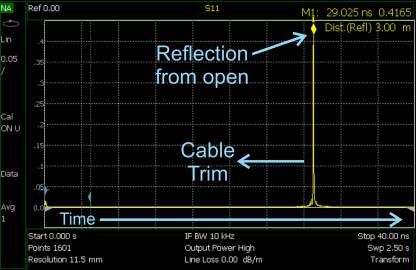
Time and frequency domain measurements
When field testing LRUs of any radar system,                                                                               (a) Absolute time
                                                                                                                           domain measurement
there is typically a set of basic measurements                                                                             using peak power meter
that must be made in both the time and
frequency domains. Time and frequency
measurements result in absolute and relative
type measurements. For example, figure 5a
shows a time domain measurement of the
peak power of a pulsed radar signal. This
measurement was made using a peak power
sensor connected to a peak power meter. A
marker is used to measure the peak amplitude
at a specific point within the pulse. Absolute
measurements may also be made in the fre-
quency domain using a variety of instrument
types including a spectrum analyzer, vector
network analyzer (VNA) and vector voltmeter
(VVM). For example, figure 5b shows the
measured spectrum, the pulsed radar signal
and a marker is used to measure the ampli-
tude at a specific frequency. LRUs that contain
their own signal source are typically measured
                                                      (b) Absolute frequency
using a spectrum analyzer. VNAs and VVMs               domain measurement
are typically used to measure the amplitude          using spectrum analyzer
and phase of transmission paths which may
include cables, filters and amplifiers.                                                                                    (c) Relative time domain
                                                                                                                           measurement using
                                                                                                                           peak power meter
Relative time domain measurements are also
made using a peak power sensor and peak
power meter. Figure 5c shows the relative
measurements between two points in time.
This type of measurement is useful for char-
acterizing timing features such as pulse width,
rise time, fall time and pulse repetition interval
(PRI) to name a few. Relative frequency
domain measurements can be performed
using a spectrum analyzer, VNA and VVM.
Figure 5d shows the relative amplitude
(insertion loss) between two different coaxial
cables. Along with relative amplitude, the
relative phase between multiple channels,
is an important measurement in monopulse
radar systems and will be discussed later in
this application note. It is worth noting that
all the measurements shown in figure 5 were
captured using a single FieldFox analyzer                        (d) Relative
                                                           frequency domain
with multi-function capability. When making              measurement using
measurements in the field and/or challenging         vector network analyzer
test environments, selecting the appropriate
instrument types is critical to successful and       Figure 5. Time and frequency domain measurements of radar signals and radar components
accurate results.
                                                                               6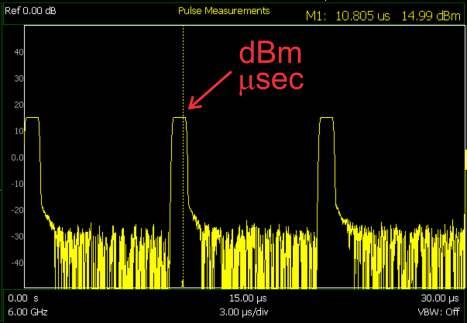
Instrumentation for field testing
With the numerous measurement combina-            Another option for field testing would be to       When using FieldFox as a substitution for
tions required to fully characterize LRUs in      replace the multiple benchtop instruments          benchtop instruments, it is important to note
a radar system, it is important to compare        with a single “all-in-one” FieldFox analyzer.      that technology breakthroughs have enabled
the choices between benchtop and modern           FieldFox was specifically designed for field       high-performance measurement capabilities
handheld analyzers when installing, main-         testing having a fully sealed enclosure that       in the handheld analyzer that are compa-
taining and troubleshooting radar systems         is compliant with US MIL-PRF-28800F Class          rable to benchtop instruments. It has been
in the field. For example, to characterize a      2 requirements to ensure durability in harsh       shown that measurements using FieldFox
commercial aviation radar system, the instru-     environments. FieldFox includes a peak             correlate well to benchtop instruments often
ment list includes a peak power sensor and        power meter, spectrum analyzer, VNA and            within hundredths of a dB. Agilent provides
meter, spectrum analyzer, VNA and VVM. As         VVM all in a six pound instrument. At the          a very informative application note that
most benchtop equipment was designed for          test site, FieldFox includes a unique feature,     details the correlation between handheld
indoor laboratory environments, the test site     named InstAlign, that allows the spectrum          and benchtop instruments [2].
must have the adequate weather protection         analyzer mode to make accurate measure-
to guarantee the safety of the equipment          ments immediately at turn on and also
against harsh weather conditions. For the         automatically corrects the measurements for
highest measurement accuracy, the equip-          any temperature changes over a range of
ment typically requires a minimum of 30           -10°C to +55°C.
minutes of warm-up time.

Measurement examples
The remainder of this application note will       value only. When configured to display the         accuracy of the power sensor. There are
detail several examples for characterizing        pulse timing, an Auto-Analysis feature rapidly     many factors that enter into an uncertainty
and troubleshooting LRUs using a variety          displays the basic pulse parameters such as        calculation for a power sensor and Agilent
of test modes available on the FieldFox           peak power, average power, rise time, fall         provides a spreadsheet to calculate the
analyzer.                                         time, pulse width, duty cycle, PRI and pulse       uncertainty limits [3]. For example, the
                                                  repetition frequency (PRF).                        measurement uncertainty in an average
Basic power measurement of a                                                                         power measurement using the U2022XA
radar transmitter operating at                    When using FieldFox connected to an                40 GHz peak power sensor with a 0 dBm
40 GHz                                            external USB power sensor, such as the             input signal level is +/- 0.18 dB at 1 GHz and
                                                  U2021XA or U2022XA sensors, the accuracy           +0.25/-0.27 dB at 40 GHz.
Figure 6 shows the measured power of an
                                                  of the measurement is directly related to the
unmodulated radar pulse as a function of
time. The pulsed waveform has a measured
pulse width of 994 nanoseconds and a PRI
of 10 microseconds. The measurement was
made with an Agilent U2022XA 40 GHz USB
peak and average power sensor connected
to a 26.5 GHz FieldFox. One benefit to using
an external power sensor is that it allows a
lower frequency analyzer to capture peak
and average power measurements across the
rated frequency range of the sensor. FieldFox
can be configured to display the pulsed
waveform as a function of time, as shown
in figure 6, or it can be configured to display
the peak or average power as a numeric            Figure 6. Peak power measurement of a 40 GHz radar transmitter

                                                                        7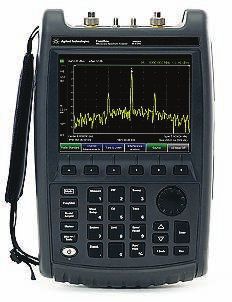
Measurement examples
Measurement of pulse timing
in commercial air traffic control
radar
As previously discussed, air traffic control
radars communicate with sidelobe sup-
pression by using two separate transmitters
having one transmitter connected to a high
gain antenna and the other connected to
an omnidirectional antenna. The sidelobe
suppression control pulse is transmitted
through the omnidirectional antenna as the
single P2 pulse. There is a two microsecond
                                                 Figure 7. Measurement of ATCRBS transmitter P1/P2 timing offset
delay between the P1 and P2 pulses. This
relative timing measurement requires two
separate peak power measurements.                Measurement of amplitude and                           stability. In this figure, the testing begins with
The measurement begins with the power            phase characteristics of a rotary                      the sum (sigma) and omni (omega) channels
sensor connected to the primary transmitter      joint                                                  connected together. The FieldFox, config-
generating the P1 pulse. The power sensor is                                                            ured in the network analyzer (NA) mode,
triggered using a TTL control signal delivered   Rotary joints provide RF continuity to a con-          measures the transmission characteristics
from the radar system. The P1 measurement        tinuously rotating antenna system. During              through this series connection. The rotary
is stored to the memory of the FieldFox.         periodic maintenance of a radar system, it             joint can be manually turned in order to
The power sensor is then moved to the            is important to verify that rotational varia-          observe the amplitude and phase responses
auxiliary transmitter for the P2 measure-        tions in the amplitude and phase through               as a function of rotation angle. If one of the
ment. The same TTL signal is required to         the rotary joint will not affect the system            channels is faulty, the measurement will fail
properly trigger the power sensor for this       performance. Figure 8 shows a typical                  the test. Measurements of the difference
second measurement. Markers are used to          configuration for measuring the rotational             (delta) channel can be made by moving the
measure the timing offset between the P1         variation of a multi-channel rotary joint. In          test cable connections from the sum channel
pulse, which is stored in memory, and the        this configuration the FieldFox is connected           over to the difference channel, as shown by
P2 active measurement. Figure 7 shows the        to one side of the rotary joint. On the other          the dotted lines in figure 8.
measurement of this relative timing offset       side, the antenna ports are disconnected
between P1 and P2. The data sheet for the        and a short jumper cable connects two
U2021XA and U2022XA power sensors                channels of the rotary joint in series. It is
shows a trigger latency of 50 nanoseconds.       important that the jumper cable be high
The trigger latency is specified as the time     quality with good amplitude and phase
when the power sensor begins to record                                                               Disconnect
the measurement from the time the trigger                                                             Antennas

                                                                         Σ             Σ                            Σ
is seen by the sensor. As the measurements
shown in figure 7 are a relative measure-                                     Rotary                                    Monopulse

                                                                          ∆            ∆                            ∆
ment using the same power sensor and TTL                                      Joint                                      Antenna
trigger, the accuracy in the measured offset

                                                                          Ω            Ω                            Ω
time between P1 and P2 will be much lower                                     Rotary                                      Omni
than 50 nanoseconds. It should be noted                                       Joint
                                                                                               Jumper
                                                                                                                         Antenna
that the peak power sensor in triggered
mode is capable of 20,000 measurements
per second.
                                                                     FieldFox
                                                                    VNA Mode

                                                 Figure 8. Configuration for measuring transmission characteristics of a rotary joint
                                                                         8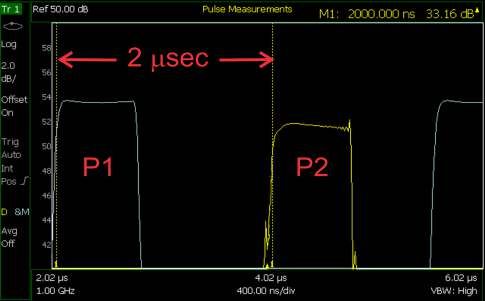
Measurement examples
Measurement of amplitude and                        device was positioned at 117-degrees. As
phase characteristics of a rotary                   this rotary joint did not pass the manufac-
joint continued                                     turer’s operational specification, it would
                                                    need to be repaired or replaced.
Figure 9 shows S21 measurements of a
single-channel coaxial rotary joint over            In some test environments, it may be dif-
the frequency range of 11 GHz to 14 GHz.            ficult to control and observe the FieldFox
The rotary joint was initially lined up at the      display while simultaneously operating
0-degree position and this measurement              some part of the radar system. For example,
was used to normalize the display of                in the monopulse configuration shown
the FieldFox. Ideally, the amplitude and            in figure 8, it is desirable to observe the
phase measurements will not vary as the             S21 variation while the rotary joint is
rotary joint is physically turned around            turned through 360 degrees of rotation.
360-degress. This particular rotary joint is        Unfortunately, the FieldFox connection into
specified at 0.5 dB variation in amplitude          the radar system may be physically located
and 3.5 degree variation in phase. As shown         in a different area from where the rotary
in figure 9, FieldFox was configured with           joint may be manually rotated. In general,
limit lines to quickly identify when the S21        this type of measurement would require two
measurements exceed the specs as the                operators positioned at different locations or
device is rotated. For this example, FieldFox       long cable runs would be required to bring
was also configured with a Pass/Fail                the FieldFox to the user.
indicator that will highlight the portion of the
frequency response that exceeds the limits.         Fortunately, FieldFox includes remote
Figure 9a shows the S21 Log Mag response            operation through an app that runs on an
at two rotation angles, namely 12-degrees           Apple® iOS device. In this way, FieldFox
and 148-degrees of rotation. These angles           would be connected to the equipment while
were chosen as having the worst case per-           a single operator can wirelessly control and
formance. For this amplitude measurement,           observe live measurements from a remote
the 0.5 dB specification was not exceeded.          location. The iOS interface can show the
Figure 9b shows the phase responses at the          same instrument panel as the FieldFox
two worse case positions. In one case, the          allowing the instrument to be directly
phase exceeded the specification when the           controlled from the iOS device [4].

                            (a) S21 Log Mag                                                                 (b) S21 Phase

Figure 9. Measured S21 of a single-channel coaxial rotary joint showing (a) Log Mag response and (b) Phase response

                                                                           9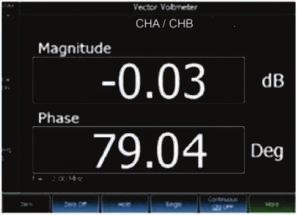
Measurement examples
Phase alignment of a STALO                         In one possible measurement configuration,        the relative amplitude is -0.03 dB and the
                                                   shown in figure 10, the omega channel IF          relative phase is 79.04 degrees. Many radar
When measuring the phase difference                receiver output is connected to port 2 of         systems have phase adjustments along
between the sum and difference channels            FieldFox. This “B” measurement will be used       the STALO transmission path in order to
using the downconverted signals from a             as the reference. The receiver output of the      re-balance the system as part of the routine
monopulse receiver, it is not possible to          sum channel is initially connected to port 1      maintenance.
use a standard network analyzer as there           of FieldFox and will be used as the test, or
is a carrier frequency difference between          “A” measurement. As this phase measure-
receiver input (RF) and the receiver output        ment only requires the relative phase
(IF). To overcome this difficulty, FieldFox is     difference between the sum and difference
configured in vector voltmeter (VVM) mode          channels, this sum channel measurement is
and set to measure the ratio of signals at         used to “zero” the vector voltmeter. Port 1 of
the downconverted IF carrier frequency. The        FieldFox is then moved over to the difference
VVM is configured in an “A/B” measurement          channel of the receiver system, as shown
where port 1 is the “A” measurement and            with the dotted line in figure 10. The relative
port 2 is the “B”. For this measurement, the       amplitude and phase difference between
internal source of FieldFox is not required        the sum and difference channels will be
and should be turned off.                          displayed on the meter. For this example,

                                          Σ
                             IF
                         Frequency

                                          ∆      Receiver

                                                  STALO

                                          Ω
                             IF
                         Frequency

                A              B                 Receiver

 A/B
 Ratio
                                               FieldFox
                                              VVM Mode

Figure 10. Configuration for measuring STALO phase alignment using downconverted receiver outputs

                                                                         10
Cable trimming using network analyzer time
domain mode
As the phase relationship between the sum VVM mode on FieldFox includes a “1-port the cable. For example, the marker shown
and delta channels is very important for cable trimming” feature that aides the in Figure 11 also displays the length of this
monopulse operation, coaxial cables and operator during the trimming operation. The cable as 3 meters. It is important to note that
related transmission lines are typically phased FieldFox User’s Guide [5] will provide addi- the electrical length and physical length are
matched by the radar system manufacturer. tional information regarding this procedure. related by the speed of light and the velocity
It is possible that a cable could become When using the VNA mode, FieldFox can be factor of the coaxial cable [6]. The cable
damaged and a field replacement would configured to display the phase or the time manufacturer’s datasheet should list velocity
be required. The replacement must be domain response. The time domain measure- factor (VF) for the cable and this number
amplitude and phase matched to the other ment on FieldFox is not a direct measurement should be entered into FieldFox. With the
cables already installed in the system. The but a calculation, or “transform”, based proper VF entered, the displayed distance
first step in the process is to cut a section on the measured frequency response of measurement will accurately represent the
of the new cable that is slightly longer than the device under test. For those interested physical length to the cable end. The VF is
the original cable or a test standard. The in learning more about the details of time also needed if the cable length is reported in
replacement cable should be of the same domain measurements using a VNA, Agilent “degrees”. In this case, the electrical length
type and have the same electrical properties provides an application note specific to in degrees is calculated by the following
as the original cable. The replacement will the FieldFox [6]. As an example, figure 11 equation.
then be iteratively trimmed and measured shows the time domain response of a coaxial
Cable length (degrees) = (½)(t)(360)(f)
until it achieves the desired performance. If cable with one end connected to port 1 of
a test standard is available, phase measure- the analyzer and the other end of the cable Where t is the measured electrical length in
ments of the replacement can be compared left disconnected. As this display is a time nanoseconds and f is the frequency in GHz.
to the measurements of the standard. If a test response, the x-axis is time and the y-axis is As this cable trimming procedure relies on
standard is not available, it is most likely that amplitude. The large peak in the plot is the a reflection measurement from the open
the cable length is specified in terms of mea- time to the open discontinuity. The exact ended cable, the displayed electrical length
sured electrical length reported as distance location of the open ended cable can be represents the two-way travel time. Dividing
or time. If the cable is specified in electrical measured using a trace marker. Knowing the this value in half provides the one-way cable
length, then a time domain approach may be target value for the desired electrical length length in degrees.
required. of the cable, the cable can be trimmed until
the electrical length is within a specified Once the replacement cable is properly
There are two ways to measure the phase tolerance. The trace marker in FieldFox will trimmed to the required specification, the
length or electrical length of a coaxial cable, also display the physical length to the end of second connector can be permanently affixed
either through a transmission measurement and a new cable can be installed in the radar
or a reflection measurement. FieldFox can system.
measure transmission and reflection using
the VNA or VVM modes. As the replacement
cable will be physically trimmed from one
end, there is typically only one connector
initially attached to the cable, thus a reflec-
tion measurement will be required. Once the
replacement is properly trimmed, the second
connector is permanently attached to the
cable.
When using FieldFox in VVM mode, it is
expected that a test or master cable is
available to use as a measurement reference. Figure 11 Measured time domain response from an open-ended cable using FieldFox VNA mode
11Conclusion
Modern radar systems are used in a ments including a peak power analyzer,
multitude of applications; from traffic vector network analyzer, spectrum analyzer
enforcement to weather prediction. In order and vector voltmeter. This application note
to assure highest uptime for these systems, reviewed several measurement modes
routine maintenance and occasional trouble- available in FieldFox with specific examples
shooting and repair must be done quickly, to monopulse radar testing. Measurement
accurately, and in any weather condition. examples included time and frequency
Breakthrough technologies have transformed domain testing of radar transmitter and
the way these systems can be tested in the receiver components.
field while providing higher performance,
improved accuracy and capability. It was
shown that a single FieldFox handheld
analyzer can replace four benchtop instru-
References
[1] Orlando, V.A., “The Mode S Radar Beacon System,” The Lincoln Laboratory Journal, Volume 2, Number 3, 1989
[2] Agilent Application Note, Correlating Microwave Measurements between Handheld and Benchtop Analyzers, part number
5991-0422EN
[3] Agilent U2020 X-Series USB Sensor Uncertainty Calculator or http://www.home.agilent.com and search for “USB sensor
uncertainty calculator”
[4] Agilent FieldFox N9916A-030 Remote Control Capability
[5] Agilent FieldFox Analyzers User’s Guide, part number N9927–90001
[6] Agilent Application Note, Techniques for Time Domain Measurements Using FieldFox Handheld Analyzers, part number 5991-0420EN
12Carry precision with you. www.agilent.com
www.agilent.com/find/FieldFox
Every piece of gear in your field kit had to prove its worth. Measuring up and earning a spot For more information on Agilent
is the driving idea behind Agilent’s FieldFox analyzers. They're equipped to handle routine Technologies’ products, applications or
maintenance, in-depth troubleshooting and anything in between. Better yet, FieldFox delivers services, please contact your local Agilent
office. The complete list is available at:
Agilent-quality measurements - wherever you need to go. Add FieldFox to your kit and carry
www.agilent.com/find/contactus
precision with you.
Americas
Related literature Number
Canada (877) 894 4414
FieldFox Combination Analyzers, Technical Overview 5990-9780EN Brazil (11) 4197 3600
FieldFox Microwave Spectrum Analyzers, Technical Overview 5990-9782EN Mexico 01800 5064 800
United States (800) 829 4444
FieldFox Microwave Vector Network Analyzers, Technical Overview 5990-9781EN Asia Pacific
FieldFox Handheld Analyzers, Data Sheet 5990-9783EN Australia 1 800 629 485
China 800 810 0189
FieldFox Handheld Analyzer, Configuration Guide 5990-9836EN
Hong Kong 800 938 693
FieldFox N9912A RF Analyzer, Technical Overview 5989-8618EN India 1 800 112 929
Japan 0120 (421) 345
FieldFox N9912A RF Analyzer, Data Sheet N9912-90006 Korea 080 769 0800
FieldFox N9923A RF Vector Network Analyzer, Technical Overview 5990-5087EN Malaysia 1 800 888 848
Singapore 1 800 375 8100
FieldFox N9923A RF Vector Network Analyzer, Data Sheet 5990-5363EN Taiwan 0800 047 866
Other AP Countries (65) 375 8100
Download additional application notes, watch videos, and learn more:
Europe & Middle East
www.agilent.com/find/FieldFox
Belgium 32 (0) 2 404 93 40
Denmark 45 45 80 12 15
Finland 358 (0) 10 855 2100
myAgilent France 0825 010 700*
myAgilent
*0.125 €/minute
www.agilent.com/find/myagilent Germany 49 (0) 7031 464 6333
A personalized view into the information most relevant to you. Ireland 1890 924 204
Israel 972-3-9288-504/544
Three-Year Warranty Italy 39 02 92 60 8484
www.agilent.com/find/ThreeYearWarranty Netherlands 31 (0) 20 547 2111
Beyond product specification, changing the ownership Spain 34 (91) 631 3300
experience. Agilent is the only test and measurement company Sweden 0200-88 22 55
that offers three-year warranty on all instruments, worldwide. United Kingdom 44 (0) 118 927 6201
Agilent Assurance Plans
For other unlisted countries:
www.agilent.com/find/AssurancePlans www.agilent.com/find/contactus
Five years of protection and no budgetary surprises to ensure (BP-01-15-14)
your instruments are operating to specifications and you can Product specifications and descriptions in
continually rely on accurate measurements. this document subject to change without
notice.
www.agilent.com/quality
Agilent Electronic Measurement Group © Agilent Technologies, Inc. 2014
DEKRA Certified ISO 9001:2008 Published in USA, March 4, 2014
Quality Management System 5991-4107EN
Cover photo courtesy of INDRA S.A.You can also read