Transport Properties of operational gas mixtures used at LHC
←
→
Page content transcription
If your browser does not render page correctly, please read the page content below
Transport Properties of operational gas mixtures used at LHC
                                                          Y.Assran*
                                           Suez Canal University, Suez, Egypt
                                                              and
                                                          A.Sharma
                                          CERN CH1211 Geneve, Switzerland

Abstract
This report summarizes some useful data on the transport characteristics of gas mixtures which are required for detection of
charged particles in gas detectors. We try to replace Freon used for RPC detector in the CMS experiment with another gas
while maintaining the good properties of the Freon gas mixture unchanged. We try to switch to freonless gas mixture
because Freon is not a green gas, it is very expensive and its availability is decreasing. Noble gases like Ar, He, Ne and Xe
(with some quenchers like carbon dioxide, methane, ethane and isobutene) are investigated. Transport parameters like drift
velocity, diffusion, Townsend coefficient, attachment coefficient and Lorentz angle are computed using Garfield software
for different gas mixtures and compared with experimental data.

1     Introduction

     Four main experiments have been designed and constructed for the Large Hadron Collider (LHC)
machine: ATLAS, CMS, LHCb and ALICE. ATLAS and CMS are large general-purpose experiments,
LHCb will study b-quark systems, produced predominantly in the forward direction, and ALICE is
designed specifically for studies of heavy-ion collisions. Figures 1-4 show the schemes of the four
detectors. The muon systems in all these experiments are large-area gas-based detectors (several
thousand m2 of multilayer chambers each in ATLAS and CMS). The chambers are divided into two
sets, one intended for precise measurements of muon tracks and the other dedicated to triggering on
muons. In this paper we will briefly summarize the main characterization of these detectors and
provide a summary of the transport properties of the operation gas mixtures.

2 Gas detectors at LHC
2-1 Gas detectors at CMS

    The CMS muon detector uses three types of gaseous particle detectors for muon identification [1]:
Drift Tubes (DT) in the central barrel region, Cathode Strip Chambers (CSC) in the endcap regions and
Resistive Parallel Plate Chambers (RPC) in both the barrel and endcaps. The DT and CSC detectors
are used to obtain a precise measurement of the position and thus the momentum of the muons,
whereas the RPC chambers are dedicated to providing fast information for the Level-1 trigger. In the
following different types of detector and their use in the CMS Muon Detector will be defined in some
detail.
*
    Corresponding author, Presently at CERN, Geneve, Switzerland,

                                                                                                                           1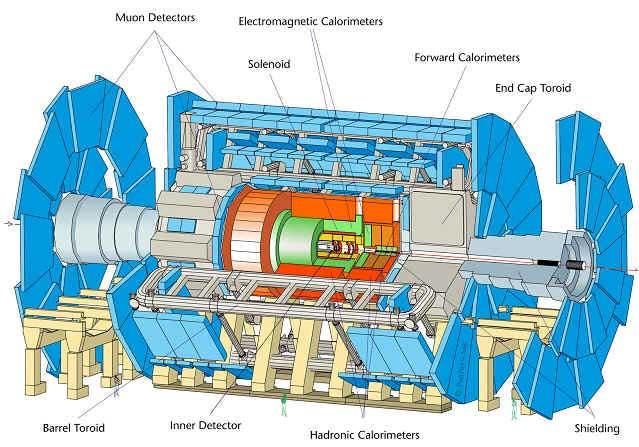
Figure 1. The CMS detector.
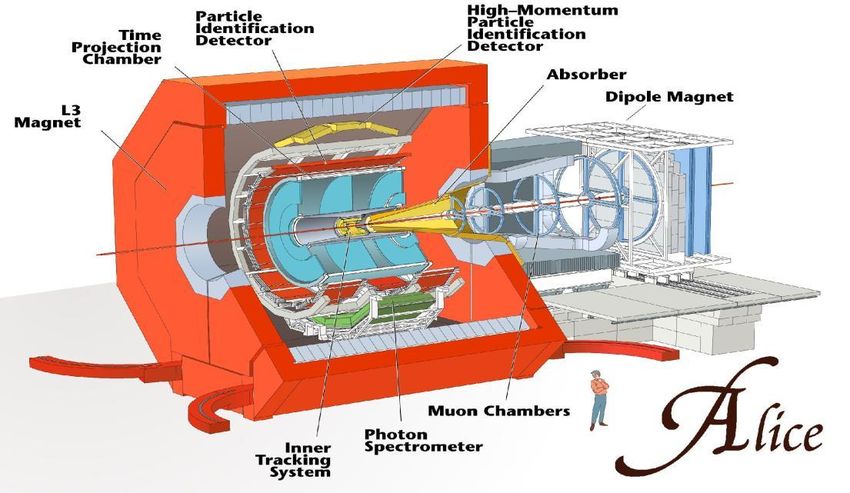
Figure 2. The ATLAS detector
2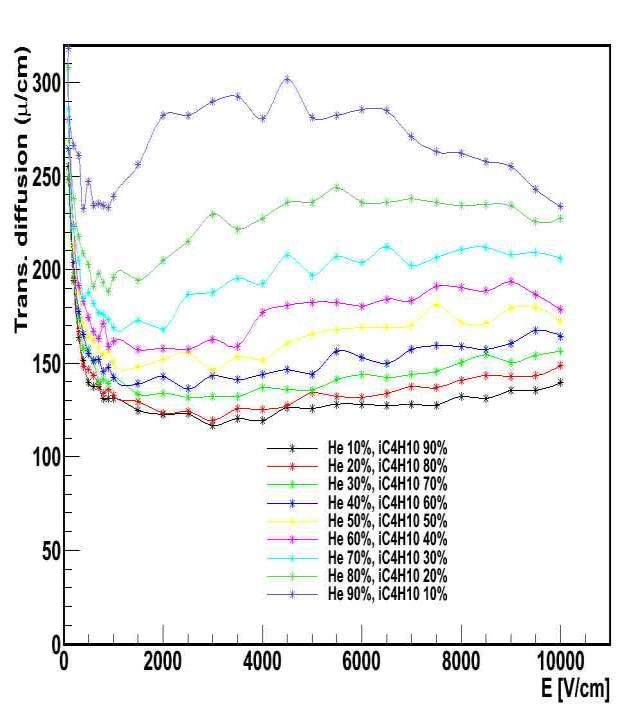
Figure 3. the ALICE detector.

Figure 4. The LHCb detector

                                   3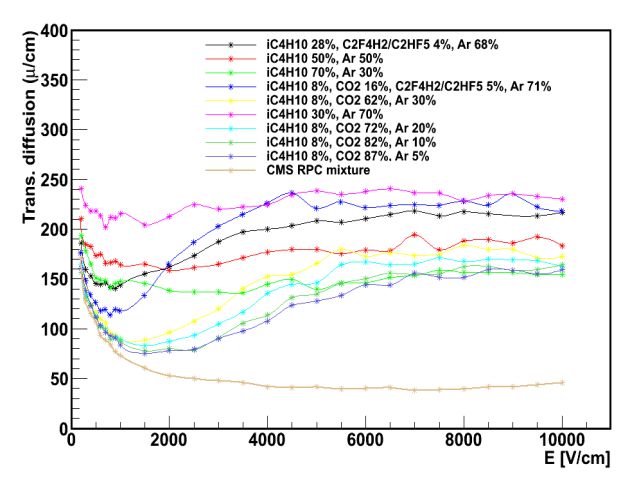
Drift Tubes are used in the Barrel where the magnetic field is guided and almost fully trapped by the
iron plates of the Magnet Yoke. Each tube contains a wire with large pitch (4 cm), and the tubes are
arranged in layers. Only the signals from the wires are recorded - resulting in a moderate number of
electronic channels needed to read out the detectors. When a charged particle passes through the DT, it
forms electron-ion pairs inside the gas mixture (Ar 85% - CO2 15%). The electrons follow the electric
field and end up at the positively charged wire.

        A DT layer is put together by gluing an aluminium plate to a set of parallel aluminium-I beams.
The wires are stretched, held by appropriate end plugs, and the layer is closed by another aluminium
plate. Each DT consists of twelve aluminum layers arranged in three groups of four. The middle group
measure the coordinate along the beam direction and the two outside groups measure the perpendicular
coordinate. Copper strips are previously glued to the Al plates in front of the wire to better shape the
electrostatic field. A full-size final prototype of a DT chamber is shown below. The chamber is 2m x
2.5m in size. The largest DT chambers to be used in CMS will have dimensions of 4m x 2.5m in size.

        Cathode strip chambers are used in the end cap regions where the magnetic field is very intense
(up to several Tesla) and very inhomogeneous to provide precise space and time information. It consist
of positively charged wires (anode) crossed with negatively charged copper strips (cathode) within a
gas volume (Ar 40% - CO2 50% - CF4 10%). When a muon passes the chamber it ionizes the gas and
forms electron-ion pairs inside it. The electrons go to the anode wires creating an avalanche, the
positive ions move toward the copper cathode strips, inducing a charge pulse in the strip. Two position
coordinates for each particle are recorded. The wires give the radial coordinate whereas the strips
measure .

In addition to providing precise space and time information, the closely spaced wires (2mm) make the
CSC a fast detector suitable for triggering. CSC modules containing six layers provide both robust
pattern recognition for rejection of non-muon backgrounds and also efficient matching of external
muon tracks to internal track segments.

        Resistive plate chambers are gaseous detectors which aim to provide a muon trigger in both the
barrel and end cap regions. It has been proposed as a suitable solution to build first level muon trigger
because of its fast response [2], and good time resolution, flexibility in segmentation, robustness and
the relatively low cost of production.

        The RPC is a detector utilizing a constant and uniform electric field produced by two resistive
parallel electrode plates. The 2mm thick gap between these two plates was filled with a gas (Freon
96.2% + isobutane 3.5% + SF6 0.3%) of high absorption coefficient to ultraviolet light. When charged
particles pass through the gas, the gas atoms will ionize and form electron-ion pairs. The electron goes
to the positive electrode and discharge is originated by the electric field. The discharge is prevented
from propagation through the whole gas by the high resistivity of the electrodes.

       The resistive plate chambers used in the CMS experiment consist of two layers of gas gaps with
a sheet of copper readout strips sandwiched between them. Gas gap is made of two sheets of high

                                                                                                       4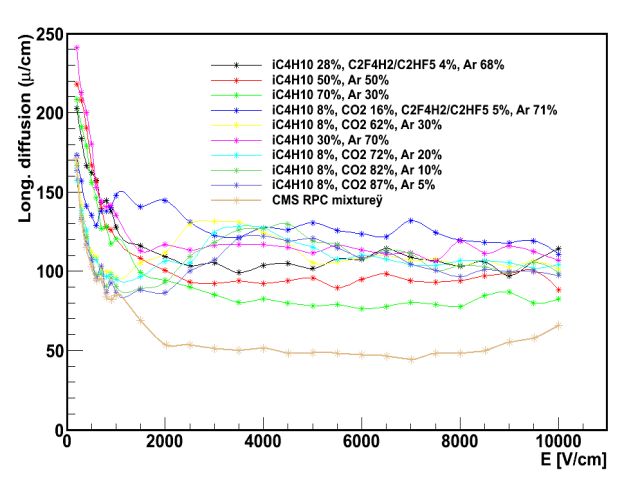
resistive Bakelite which acts as the electrode. Within the resistive plate chamber the electric field is
uniform. The sheet of the readout strips is put in the chamber, centered on the bottom gap. There are 32
strips running the length of the chamber but they are broken up lengthwise into three sections to form
appropriate trigger towers.

2-2 Gas detectors in ATLAS

        The ATLAS experiment uses gas detectors in both the inner detector and muon spectrometer
[3]. In inner detector of ATLAS uses Transition radiation Detectors (TRT) to resolve the inevitable
ambiguities caused by overlapping tracks, secondary interactions, detector inefficiencies and alignment
errors. In muon the spectrometer, ATLAS uses Monitored Drift Tube (MDT) and Cathode Strip
Chamber (CSC) for precision measurements; Resistive Plate Chamber (RPC) and Thin Gap Chamber
(TGC) for triggering.

        TRT provides tracking and contributes to the electron identification over the whole inner
detector rapidity range. Its pattern recognition capability is strong due to the large number of
measurement points (>36 per track), which will be combined to perform momentum measurement
together with the semi-conducting tracking (SCT) detectors. TRT can also provide a stand-alone
momentum measurement, but with a lower precision than the whole inner detector. The detector will
be built in three deferent blocks – two end-cap TRTs with radial straws and one barrel TRT with
axially-oriented straws. So, the barrel TRT measures R ф while the end-cap TRT measures ф and z
directly and R indirectly through the particle entrance and exit positions in the detector.

       The active element of TRT is the Straw which is made of two polyimide films, with 2000A
aluminum covered with 4µm carbon, is wound to form the 4mm diameter straws with a wall thickness
of 60 µm. these straws are then reinforced by gluing four carbon fibers along the straw wall, giving
stable mechanical properties. A 50 µm gold-plated copper/beryllium wire is situated along the straw
axis. The chamber gas is chosen to be 70%Xe + 20%CF4 + 10% CO2. The straw operates with a high
voltage 1780 V giving a gas gain of 2.5*104. The maximum drift time is 38 ns for this gas mixture in a
2T magnetic field.

        The MDTs are employed in both barrel and end cap regions. In the endcap regions it is used up
to rapidities close to η = 2, where the rate approaches 200 Hz/cm2 and occupancies are at the 7-8%
level. An MDT is built from two multilayers of high-pressure drift tubes mounted to either side of a
support structure. Each multilayer consists of three or four layers of tubes. The support structure uses a
minimum of material and provides precise positioning of the two multilayers and alignment
components of the system. The possible distortion of the chambers is monitored with four optical
straightness monitors. A relatively fast drift gas with maximum drift time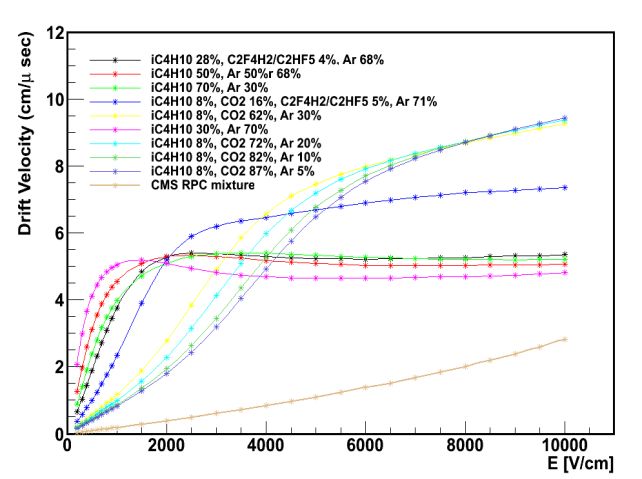
The second precision chamber is the CSC which is used at higher rapidity because of the need
to increase the granularity, also for considerations on chamber ageing. CSC is a multiwire proportional
chamber with a symmetric cell in which the anode-cathode distance equal the anode wire spacing
which is 2.5mm, the cathode is segmented in strips with a readout pitch of 5mm. the transverse
coordinate can be determined by segmented the second cathode in strips parallel to the anode wires or,
by reading the anode wires. The operating gas is a mixture of Ar-CO2-CF4 (30:50:20). This gas
combines a high drift velocity v>60 µm/ns with a small Lorentz angle. The high drift velocity and the
narrow anode wire spacing result in a short total drift time (
2-4 Gas detectors at ALICE

        The ALICE experiment has a central barrel, housed in the L3 magnet, covering in
pseudorapidity the range -0.9 ≤ η ≤ 0.9 with complete azimuthal coverage [6]. This central barrel
comprises an inner tracking system of Silicon detectors (ITS), a large time projection chamber (TPC),
a transition radiation detector (TRD) and a time-of-flight array (TOF). The main goal of the TRD is to
provide electron identification in the central barrel at momenta in excess of 1 GeV/c where the pion
rejection via energy loss measurement in the TPC is no longer sufficient. The gas mixture used in the
TRD chambers is Xe/CO2 in a ratio of 85/15 while that used in TPC chamber is Ne/CO2 with the ratio
of (90:10) and that used for TOF chambers is C2H2F4/iC4H10/SF6 with the ratio of (90:5:5). ALICE
uses also RPC chambers for muon spectrometer, the gas mixture used in those chambers is
C2H2F4/iC4H10/SF6 with the ratio of (89.7:10:0.3).

3 Primary and total ionization

        When a charged particle passing through a gaseous medium, it ionizes atoms and molecules of
the gas and free electrons and ions are produced in amounts depending on the atomic number, density
and ionization potential of the gas, and on the charge and energy of the incident particle. The created
electrons can have sufficient energy to make further ionization and create secondary electron-ion pairs.
The former process is called primary ionization and the number of primary electron-ion pairs per cm is
called Np. the sum of the two processes is total ionization and the total number of electron-ion pairs per
cm is called Nt. Np and Nt are characteristic of a given gas or gas mixture. The spatial resolution of a
chamber depends on various factors, Np and Nt are the most important ones. These numbers have been
measured and computed for a variety of gases [7-14]. Table 1 lists some values for Np and Nt along
with other general properties for some gases and gas mixtures. All numbers are for normal temperature
and pressure (NTP). For gas mixtures a weighted average for Np and Nt may be computed. For equal
gas density, the number of primaries is larger for gases whose molecules comprise light elements. The
numbers given are for minimum ionizing particles; for lower energy particles the larger ionization
density helps improving accuracy.

                                                                                                        7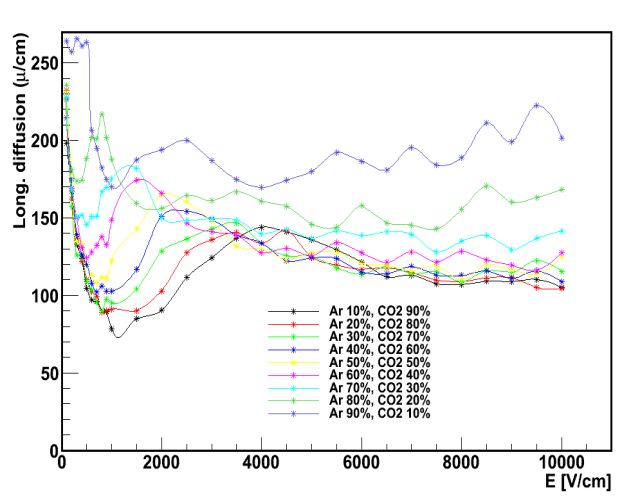
Gas            Ratio           Density*10-3     Radiation    Np       Nt
                                     3
                               (g/cm )          Length (m)   (cm-1)   (cm-1)
He                             o.178            5299         4.8      8
Ar                             1.782            110          24.3     94
Ne                             0.9              345          12       43
Xe                             5.86             15           44       307
CF4                            3.93             92.4         51       100
DME                            2.2              222          60       160
CO2                            1.98             183          35.5     91
CH4                            0.71             646          26.5     53
C2H6                           1.34             340          41       111
i-C4H10                        2.59             169          84       195
Ar-CH4          90-10          1.67             120          24.5     90
                80-20          1.57             132          24.7     85.8
                70-30          1.46             147          25       82
Ar-C2H6         90-10          1.74             118          26       95.7
                80-20          1.69             127          27.6     97.4
                70-30          1.65             138          29       99.1
Ar-iC4H10       90-10          1.86             114          30.27    104.1
                80-20          1.94             118          36.24    114.2
                70-30          2                122.8        42.21    124.3
Ar-CO2          90-10          1.8              114.5        25.42    93.7
                80-20          1.82             119.5        26.54    93.4
                70-30          1.84             124.9        27.66    93.1
He-CH4          90-10          0.237            3087         7        12.5
                80-20          0.285            2178         9.1      17
                70-30          0.355            1683         11.3     21.5
He-C2H6         90-10          0.29             2155         8.42     18.3
                80-20          0.41             1353         12       28.6
                70-30          0.53             986          15.6     38.9
He-iC4H10       90-10          0.42             1313         12.7     26.7
                80-20          0.66             749          20.6     45.4
                70-30          0.9              524          28.6     64.1
He-CO2          90-10          0.358            1396         8        16.3
                80-20          0.538            804          10.9     24.6
                70-30          0.719            565          14       32.9
       Table 1: Parameters of some gas and gas mixtures.

                                                                               8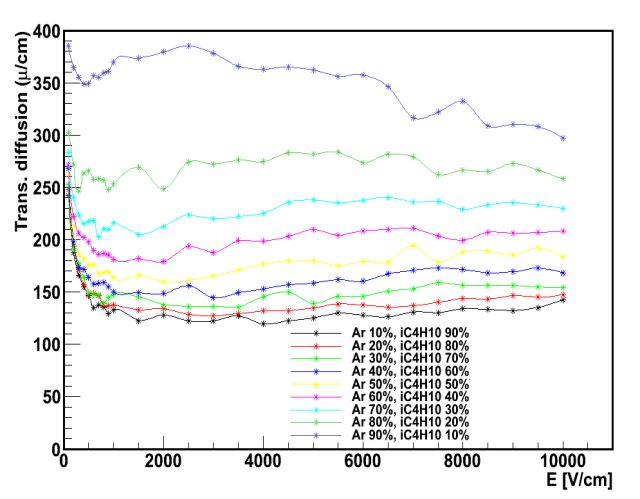
Gas            Ratio         Density*10-3    Radiation     Np         Nt
                             (g/cm3)         Length (m) (cm-1)        (cm-1)
Ne-CH4         90-10         0.881           361.8         13.45      44
               80-20         0.862           380.4         14.9       45
               70-30         0.843           401           16.35      46
Ne-C2H6        90-10         .0944           344           14.9       49.8
               80-20         0.988           343.9         17.8       56.6
               70-30         1.032           343.4         20.7       63.4
Ne-iC4H10      90-10         1.06            312           19.2       58.2
               80-20         1.23            285           26.4       73.4
               70-30         1.4             262           33.6       88.6
Ne-CO2         90-10         1               317           14.35      47.8
               80-20         1.12            293           16.7       52.6
               70-30         1.22            272           19         57.4
Xe-CH4         90-10         5.34            16.6          42.25      281.6
               80-20         4.83            18.6          40.5       256.2
               70-30         4.31            21.2          38.75      230.8
Xe-C2H6        90-10         5.4             16.6          43.7       287.4
               80-20         4.95            18.5          43.4       267.8
               70-30         4.5             21            43.1       248.2
Xe-iC4H10      90-10         5.53            16.5          48         295.8
               80-20         5.2             18.3          52         284.6
               70-30         4.87            20.6          56         273.4
Xe-CO2         90-10         5.47            16.5          43.15      285.4
               80-20         5.1             18.4          42.3       263.8
               70-30         4.69            20.7          41.45      242.2
      Table 1. (Continued) Parameters of some gas and gas mixtures.

                                                                               9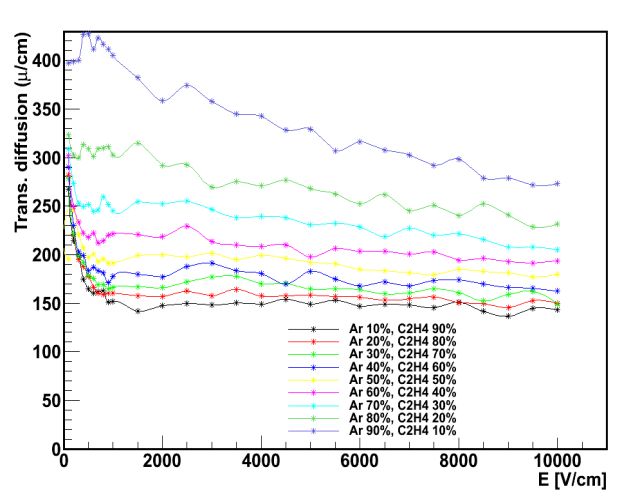
4 What should be the ideal gas mixture?

Particle physics experiments rely heavily on the detection of charged and neutral radiation with
gaseous detectors. A suitable gas mixture enclosed within electrodes with an electric field between
them permits the detection of charged particles. This mixture should fulfill a set of requirements
depending upon the purpose it is used for. The mixture consists of primary gas in which ionization
takes place. The most suitable gas for this are noble gases like helium,neon and argon, it should consist
of another gas which is used as a quencher to prevent secondary effects like photon feedback and field
emission in order to get a stable gas gain well separated from the noise of the electronics. Isobutane
and methane can be used as possible quencher.

4-1 Tracking

For tracking at the high luminosity hadron collider like LHC, an operational gas mixture needs to have
the following requisites: It has to be fast, so that an event can be unambiguously associated to its bunch
crossing which leads to a compromise between having a high drift velocity and large primary
ionization statistics. The drift velocity would ideally be saturated or have a small variation with
modifications in electric and magnetic fields. The mixture needs to be well quenched. Fast ion mobility
for quick clearance of positive ions to inhibit space charge effects which also helps in having small
E B effects.
Experiments at the upcoming high luminosity B-f and t-charm factories require a low mass gas mixture
and a lot of work has been done in this direction. For low mass gas mixtures, used for detection of low
momentum particles by minimizing multiple scattering, it is known that ethane, Isobutane and
dimethyl ether (DME) are good quenchers with helium [15-20] , which help increasing also the
number of primary and total ion pairs per cm for a given density.
Clearly financial constraints also need to be addressed in large gas systems, and a nonflammable, eco-
friendly gas mixture is often a pre-requisite for safety.

4-2 Trigger

The most important characteristic of gas mixtures used for trigger purposes is that, it should be fast
whether it has large primary ionization or not. As example CH4 can be used for this purpose because it
is light and fast but we can’t work at high voltage using pure CH4 so we use mixture of it and one of
the noble gases like helium or argon.

5 Using Garfield for the calculation of transport parameters

Garfield [21] is a computer program for the detailed simulation of two- and three-dimensional drift
chambers. It has interface to the Magboltz [22] program for the computation of electron transport
properties in arbitrary gas mixtures. Garfield also has an interface with the Heed program to simulate
ionization of gas molecules by particles traversing the chamber. Transport of particles, including
diffusion, avalanches and current induction is treated in three dimensions irrespective of the technique
used to compute the fields. In this work we use Garfield to calculate the transport parameters like drift
velocity, longitudinal diffusion, transverse diffusion Townsend coefficient attachment coefficient and
Lorentz angle, and then we compare our calculation with real data from different experiments.

                                                                                                       10
5-1 Drift Velocity.
In the absence of electric field, electrons move randomly in all direction having an average
thermal energy 3/2 KT. In presence of an electric field, the electrons start to drift along the field
direction with mean drift velocity vd (the average distance covered by the drift electron per unit time).
The drift velocity depends on the pressure, temperature and could be affected by the presence of
pollutants like water or oxygen. Electronegative pollutant depletes the gas of electrons. Magboltz
computes the drift velocity using Monte-Carlo techniques, tracing electrons at the microscopic level
through numerous collisions with gas molecules.
5-2 Diffusion
Electrons and ions in a gas are subject only to an electric field and move on average along the electric
field, but individual electrons deviate from the average due to scattering on the atoms of the gas.
Scattering leads to variations in velocity, called longitudinal diffusion, and to lateral displacements,
called transverse diffusion. The scattering process in each direction can to a good approximation be
considered Gaussian on a microscopic scale. In cold gases like carbon-dioxide for example, the
diffusion is small, while the drift velocity is low and unsaturated for values of electric fields common
in gas detectors; this implies a non linear space time relation. Warm gases like argon for instance, have
a higher diffusion; when mixed with polyatomic/organic gases having vibrational thresholds between
0.1 and 0.5 ev, diffusion is reduced in most cases, while the drift velocity is increased.
5-3 Townsend coefficient
The average distance an electron travels between ionizing collisions is called mean free path
and its inverse is the number of ionizing collision per cm α (the first Townsend coefficient). This
parameter determines the gas gain of the gas. If n o is the number of primary electron without
amplification in uniform electric field, and n is the number of electrons after distance x under
avalanche condition. So n is given by n = noeαx and the gas gain G is given by G = n0/n = eαx. The first
Townsend Coefficient depends on the nature of the gas, the electric field and pressure.
5-4 Lorentz angle
Clearly due to the deflection effect exerted by a magnetic field perpendicular to the electric
field and the motion of the electron, the electron moves in a helical trajectory resulting in a lowered
drift velocity and transverse dispersion. Thus the arrival time of electrons in a proportional counter for
example changes and the spread in the drift time increases. The angle which the drifting electron
swarm makes with the electric field is defined as the Lorentz angle of the particular gas or gas mixture
under consideration. This depends on both the electric field and the magnetic field. It is normally large
at small electric fields but falls to smaller values for larger electric fields and is approximately linear
with increasing magnetic field.
116 Simulation and experimental results
The various transport parameters have been computed and compared to the experimental results
from literatures. Drift velocity of various gas mixtures is shown in figures (5-8), longitudinal and
transverse diffusion are shown in figures (9-16), the Townsend and attachment coefficients are shown
in figures (17-23), and Lorentz angle in figures (24-25). The mixtures considered for transport
parameters are mainly Argon, Helium, Xenon and Neon since these are the mixtures typically used in
the various experiments for tracking and triggering.
6-1 Drift velocity
Figure 5 shows the simulation results and experimental measurements for the Drift velocity of
Argon based mixtures for different mixing ratios (start from 10% argon up to 90% with step of 10%);
comparison with experimental results is made as far as possible. Most of the simulation results are
corroborated by the experimental results to within 5-10%. For low electric field applications like the
TPCs, Argon-Methane mixtures exhibit the highest drift velocity. For tracking and triggering
applications which apply high electric field Argon-CO2 Mixtures are equally fast ~10cm/ sec.
Helium based mixtures which are shown in figures 6 exhibit relatively lower drift velocity as
compared to argon based mixtures. Helium-CO2 mixtures are unsaturated while Helium-Isobutene
mixtures are relatively saturated hence space-time correlations using Helium-Isobutene would be
suitable.
In figure 7 are shown the drift velocity of Neon based mixtures. Neon mixtures are particularly
useful for suppressing photon feedback and are used for example in the ALICE TPCs. Neon-CO2
mixtures are unsaturated in drift velocity up to high electric field and this is the same for Neon-
Methane mixtures.
In figures 8 are shown the drift velocity of Xenon based mixtures. Again we see that all Xenon
mixtures have saturated drift velocity at relevant electric field but Xenon-CO2 shows the highest value
of the drift velocity. Xe-CO2 and Xenon-Methane drift velocity measurements match very well with
the simulation as shown in figures 8e and 8f.
6-2 Diffusion
It is evident from figure 9 that the longitudinal diffusion of argon based mixtures is typically
less than 200 /cm of drift. Argon-Methane mixtures have the least longitudinal diffusion followed by
Argon-Isobutene, Argon-Methane and Argon-CO2 mixtures. Measurements and simulation of 50-50
Argon-CO2 and several percentages of methane are shown in figure 9e, the experimental points agree
very well with the data.
Taking a look on helium mixtures in figure 10 we find again that ethane and isobutene with
helium have the lowest longitudinal diffusion. Helium-isobutene in different percentages is shown in
figure 10e with measurements and calculations of longitudinal diffusion in good agreement.
12Longitudinal diffusion of Neon based mixtures in figure 11, they are very similar to the argon
based mixtures. Xenon mixtures in general have a lower longitudinal diffusion coefficient as shown in
figure 12; this is particularly useful for the TRT of ATLAS where they used 70% Xenon based
mixtures. Simulation and measurement are in good agreement.
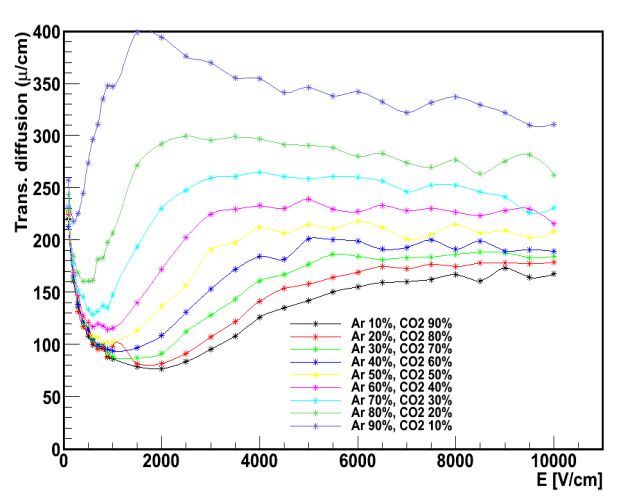
The transverse diffusion of all mixtures mentioned above are shown in figures (13-16) with
some comparison with the measurements. The agreement is to within 5% as shown in figure 13e..
6-3 Townsend and Attachment Coefficient.
The Townsend coefficient is shown in figures 20-23. It increases with high electric field as
expected for all argon based mixtures and the behavior is rather similar. Helium and Neon based
mixtures on the other hand start multiplications at lower electric field. As an example let us take He-
CO2 and He-CH4 mixtures: at 6000 V/Cm the Townsend is 5 in the former case while it is 10 for the
later. Neon mixtures behave very similar. Experimental measurements for Ar-CH4, Ar-C2H4 and Ar-
iC4H10 are shown in figure 23.
Attachment coefficient is very important transport parameter to be understood as due to
electron affinity gain is reduced and hence the efficiency of operation. The simulation and
experimental data for a few gas mixtures are shown in figures (17-19). In figure 17b one can see the
reliable estimate of the attachment coefficient can be made using the simulation package explained
here. The deviation of measurement from simulation is about 15% at high electric field.
6-4 Lorentz angle
Operational magnetic field is very important for measurement of momentum and tracking. A
large lever arm (BL2) is usually employed with several measurement points in order to identify the
charge and sagitta of the passing track. The CMS muon system is such an example. With the help of
the simulation packages and measurements we are able to demonstrate that Lorentz effect can be
precisely estimated. In figures (24-25) we present the data at magnetic field of 0.8 Tesla simply
because measurement exists at this field. For argon based mixtures we see that the Lorentz angle
behavior is very similar. The Lorentz angle of Ar-CH4 is higher than that of Ar-C2H6. In any case the
agreement with experimental data is rather impressive. He based mixtures, although have smaller value
of Lorentz angle compared to Argon mixture behave very similar to each other. In figures 24c and 24d
we see excellent agreement between measurement and simulation. Figures 25c and 25d show the
behavior of Lorentz angle with electric field of 0.8 Tesla for mixtures based on Xenon. Experimental
data are also plotted and the same plot and are in good agreement with calculations. The same is true
for Neon mixtures in figures 25a and 25b.
13(a)
(b)
(c) (d)
(e)
(f)
(g) Figure 5: The drift velocity of Ar mixtures
for different percentages with some
experimental measurements [23, 24, 9]
14(a)
(b)
(c) (d)
(f)
(e)
Figure 6: The drift velocity of He
mixtures for different percentages with
some experimental measurements [25,26]
(g)
15(a)
(b)
(c)
(d)
(e)
(f)
Figure 7: The drift velocity of Ne mixtures for different percentages with some measurements
[24,27,28]
16(b)
(a)
(c) (d)
(e)
(f)
Figure 8: The drift velocity of Xe mixtures for different percentages with some measurements [29,30]
17(a) (b)
(c) (d)
(e)
Figure 9: The longitudinal diffusion of Ar mixtures for different percentages with some measurements
[31,9]
18(b)
(a)
(c)
(d)
(e)
Figure 10: The longitudinal diffusion of He mixtures for different percentages with some
measurements [32].
19(a)
(b)
(c) (d)
Figure 11: The longitudinal diffusion of Ne mixtures for different percentages.
20(a)
(b)
(c) (d)
Figure 12: The longitudinal diffusion of Xe mixtures for different percentages.
21(a) (b)
(c) (d)
(e)
Figure 13: The transverse diffusion of Ar mixtures for different percentages with some measurements
[9,31]
22(a)
(b)
(c) (d)
Figure 14: The transverse diffusion of He mixtures for different percentages.
23(a) (b)
(c)
(d)
Figure 15: The transverse diffusion of Ne mixtures for different percentages.
24(a) (b)
(c) (d)
Figure 16: The transverse diffusion of Xe mixtures for different percentages.
255
4.5
(a)
4 Ar90Co2
Attachment coeff. [1/cm]
3.5 Ar80Co2
3 Ar90exp
2.5 Ar80exp (b)
2
1.5
1
0.5
0
2000 4000 6000 8000 10000
E [V/cm]
Figure 17: Attachment coefficient of Ar-CO2 mixture with some measurements [33]
(a)
(b)
Figure 18: Attachment coefficient of He mixtures.
26(a) (b)
Figure 19: Attachment coefficient of Ne mixtures.
(a) (b)
(c) (d)
Figure 20: Townsend coefficient of Ar mixtures.
27(a) (b)
(c) (d)
Figure 21: Townsend coefficient of He mixtures.
28(a) (b)
(c) (d)
Figure 22: Townsend coefficient of Ne mixtures.
290.07 0.025
(a) 1-0
2 - 1.96 1 - 31.7
0.06
3 - 16.6 0.02
α/p (cm-1 Torr-1)
4 - 32.4 2 - 33.1
α/p (cm-1 Torr-1)
0.05 5 - 44.8
6 - 55.6 3 - 46.9
0.015
0.04 7 - 65.4
8 - 74.0 4 - 72.1
0.03 9 - 82.2
10 - 93.3 0.01 5 - 100
11 - 100
0.02
0.005
0.01 (c)
0 0
0 20 40 60 0 10 20 30 40
E/p (V cm-1 Torr-1) E/p (V cm-1 Torr-1)
0.045
(c)
0.04 2 - 20.7
3 - 41.3
0.035
4 - 47.0
α/p (cm-1 Torr-1)
0.03 5 - 52.7
0.025 6 - 74.3
7 - 79.4
0.02 8 - 90.7
0.015 9 - 100
0.01
0.005
0
10 20 30 40 50
E/p (V cm-1 Torr-1)
Figure 23: Measurements of Twonsend coefficient of (a) Ar-CH4 , (b) Ar-C2H4 and (c) Ar-iC4H10 gas
mixtures [34].
3090 80
80 (a)
70 (b)
70
60
60
50
50
40
40 Ar70CH4
30
measurements Ar70C2H6
30
20 measurements
20
10
10
0 0
0 500 1000 1500 0 500 1000 1500
E V/cm
E V/cm
35 35
(c)
30 30 (d)
25 25
20 20
15 15
He70C2H6
He70CH4 10
10 measurements
measurements
5 5
0
0
0 500 1000 1500
0 500 1000 1500
E v/cm E V/cm
Figure 24: The Lorentz angle of (a,b) Ar mixtures and (c,d) He mixtures and some measurements at
magnetic field of 0.8 Tesla.
3150 25
45 (a) (b)
40 20
35
30 15
25
Xe70CH4
10 ---Xe70C2h6
20
measurements
15
measurements
10 5
5
0 0
0 500 1000 1500 0 500 1000 1500
E V/cm E V/cm
80 80
70 (c) 70 (d)
60 60
50 50
40 40
Ne70CH4
30 30
Ne70C2H6
measurements
20 20 measurement
s
10 10
0 0
0 500 1000 1500 0 500 1000 1500
E v/cm E V/cm
Figure 25: The Lorentz angle of (a,b) Xe mixtures and (c,d) Ne mixtures and some measurements at
magnetic field of 0.8 Tesla [35].
327 RPC gas mixtures
The function of RPCs is trigger, so that gas mixture used should be fast gas. The gas mixture
used for this purpose is Freon based (95.5% Freon, 4.2% isobutane and 0.3 SF6). Since the Freon is
not an environment friendly or green gas its availability is decreasing hence alternative Freonless gas
mixtures should be used. In this work, some gas mixtures were proposed and their transport parameters
like drift velocity, longitudinal diffusion and transverse diffusion were estimated using Garfield
software and compared to that used for RPC.
Figure 26a shows the drift velocity of some gas mixtures in addition to that used for RPC. It is
shown from the figure that mixtures of combination of isobutane, carbon dioxide and argon gives the
highest drift velocity. Adding small amount of Freon has the effect of lowering the drift velocity.
Figure 26b shows the longitudinal diffusion coefficient of some gas mixtures with that used for RPC.
In low electric field, isobutane, carbon dioxide and argon mixtures give the lowest longitudinal
diffusion while in high electric field, isobutane and argon mixtures gives the lowest longitudinal
diffusion. Figure 26c shows the transverse diffusion of some gas mixture and the RPC gas mixture. It
is shown from the figure that isobutane, carbon dioxide and argon gas mixtures give the lowest
transverse diffusion in the whole electric field range.
Figures 26d, 26e and 26f shows the Lorentz angle of some gas mixtures as a function of the
electric field at magnetic field of 1, 2, 3 Tesla respectively. It is shown from these figures that for given
value of the magnetic field isobutane, carbon dioxide and argon mixtures gives the lowest values of
Lorentz angle. For given value of the electric field, the Lorentz angle of all gas mixtures increases as
the magnetic field increases.
8 Conclusions
The main goal of this work is to propose an alternative gas mixture which can be used for
CMS RPC and be freonless. It shown from figure 26 that isobutane, carbon dioxide and argon mixtures
have the highest drift velocity, lowest longitudinal and transverse diffusion and lowest Lorentz angle
so that it full the criteria of gas mixtures used for trigger purposes. So these gas mixtures have been
proposed for use in the CMS RPC system and should be followed up by measurements and
performance evaluation.
Acknowledgement
I wish to express my profound gratitude and indebtedness to Dr. Walter Van Doninck for his
invaluable help during this work.
33(a) (b)
(c) (d)
(e) (f)
Figure 26: Transport parameters for proposed gas mixtures for CMS RPCs. (a) drift velocity ,(b,c)
longitudinal and transverse diffusion and (d,e,f) the Lorentz angle at magnetic field of 1 Tesla, 2 Tesla
and 3 Tesla.
34REFERENCES
1. CMS TDR 3 CERN/LHCC 97-32
2. Abbrescia et al., Nucl. Instr. And Meth. A533 (2994) 102-106; M.Abbrescia et al., Nucl. Instr.
And Meth. A515 (2993) 342-347.
3. The CERN Large Hadron Collider: Accelerator and Experiments, Volume1 (2009)
4. LHCB Collaboration-Second Addendum to The Muon System Technical Design report. Report
no CERN/LHCC/2005-0012
5. A. Bressan et al., Beam test of the gas electron multiplier, Nucl. Instrum. Meth. A 425
(1999)262.
6. TRD Technical Design Report ALICE – DOC – 2004 – 009 V1
7. F. Sauli, Principles of Operation of Multiwire Proportionl and drift chambers. CERN 77-07
(1977).
8. E.N. Lassestre, et al., J. Chem. Phys. 49 (1968) 2382.
9. S.F. Biagi, Nucl. Instr. and Meth. A283 (1989) 716.
10. B. Schmidt and K. Martens, HD-PY 92/02 (1992) (1992).
11. R. Bouclier, et al., Recent developments of the multidrift tube. Nucl. Intr. and Meth.
A283(1989) 509.
12. F.F. Reike and W. Prepejchal, Phys. Rev. D A6 (1972) 1507.
13. D. Denisov, Nucl. Instr. and Meth. A306 (1991) 200.
14. G. Schultz, et al., Rev. Appl. Phys. 12 (1977) 67.
15. A. Sharma and F. Sauli. Operation of drift chambers with low mass gas mixtures. in 1993
Nuclear Science Symposium and Medical Imaging Conference. 1993. San
Francisco,California: IEEE Nuclear and Plasma Science Society.
16. A. Sharma and F. Sauli, Low mass gas chambers for drift chamber operation. Nucl. Instr.and
Meth. A350 (1994) 470.
17. V. Cindro, et al., Nucl. INstr. and Meth. A309 (1991) 411.
18. J. Vav'ra, Nucl. Instr. and Meth. A 324 (1993) 113.
19. S. Uno, et al., KEK Preprint 92-129 (1992).
20. T. Alber, et al., 1994. Nucl. Instr. and Meth. A 349 56.
21. R. Veenhof, Garfield simulation program, http://garfield.web.cern.ch/garfield/.
22. S.Biagi, gas parameter computation program (Magboltz).
23. T.Zhao et al, NIM A 340 (1994) 485-490.
24. F. Sauli et al, NIM 124 (1975).
25. Peisert and Sauli , Drift and Diffusion of electron in Gases (1984).
26. P. Bernardini et al, NIM in Physics Research A 355 (1995) 428-433.
27. Lehrous et al, IEEE Trans, NUcl. Sci. NS-30, 50 (1983).
28. Saudinos et al, NIM 111, 77 (1973).
29. B. Dolgoshein et al CERN-EP (1989) 89-161.
30. Th.Berghofer et al , NIM in Physics Research A 525 (2004) 544-552.
31. X. Bittl et al , NIM in Physics Research A 398 (1997) 249-264.
32. V. Golovatyuk, NIM in Physics research A 394 (1997) 97-102.
33. D.M.Binnie, NIM in Physics Research A 234 (1985) 54-60.
34- A.Sharma and F.Sauli First Townsend coefficient measured in argon based mixtures
at high fields, NIM in Physics Research A 334 (1993) 420-424.
35. http://cyclotron.mit.edu/drift.
3536
You can also read