Learning support software - teaching process for planning and analysis of experiments - SciELO
←
→
Page content transcription
If your browser does not render page correctly, please read the page content below
ORIGINAL
ARTICLE Learning support software – teaching process for
planning and analysis of experiments
Software de apoio ao processo ensino – aprendizagem do método
planejamento de experimento
Karol da Almeida Santos1, Antônio Fernando Branco Costa1 , Antônio Faria Neto1
1
Universidade Estadual Paulista – UNESP, Programa de Pós-graduação em Engenharia de Produção, Campus de
Guaratinguetá, Guaratinguetá, SP, Brasil. E-mail: almeidasantos.karol@gmail.com; fbrancosta@gmail.com;
antfarianeto@gmail.com
How to cite: Santos, K. A., Costa, A. F. B., & Faria Neto, A. (2020). Learning support software –
teaching process for planning and analysis of experiments. Gestão & Produção, 27(2), e4070.
https://doi.org/10.1590/0104-530X4070-20
Abstract: Engineering presents as one of its characteristics, the need of investigating systems,
in order to obtain the maximum results from these. Design of Experiment is a method that can
support this need, but the intrinsic complexity of the method creates barriers to its understanding,
and consequently on its use, with statistics being considered one of the most significant agents,
therefore it is necessary to use more efficient approaches for teaching this method. The traditional
teaching approaches are not enough to favor learning of the essence from Design of Experiment,
since its focus is almost entirely on statistics or, when using technological resources, the tool
becomes an actor due to the fact of being a complex analysis software, and suitable for use by
experts. So, the purpose of this thesis is to propose a software with teaching characteristics,
capable of filling this gap, which was called “The Cake”, a metaphor that refers to the total
variability from an experiment, and whose portions are taken by the controllable and
uncontrollable effects. Thus, this software was developed with the purpose of providing friendly
interfaces, which are similar to text books, to facilitate its use and provide interaction with the
user, apart from presenting the analyses in a gradual way.
Keywords: Design of experiment; Teaching software; Design of experiment software; Statistics.
Resumo: A Engenharia apresenta como uma de suas características, a necessidade de
investigação de sistemas, para se obter o máximo de resultado destes. E Planejamento de
Experimento é um método, que pode suportar esta necessidade, porém a complexidade
intrínseca ao método cria barreiras no entendimento, e consequentemente no uso, podendo se
considerar a estatística um dos agentes mais significativos, portanto faz-se necessário utilizar
abordagens mais eficientes, para o ensino deste método. As tradicionais abordagens
pedagógicas não se mostram suficientes, para favorecer a assimilação da essência do
Planejamento de Experimento, pois ou seu foco se direciona quase que totalmente a estatística
ou, quando se usa recursos tecnológicos, a ferramenta se torna protagonista, por se tratar de
softwares complexos para análises, e adequado ao uso por especialistas. O objetivo deste
estudo foi propor um software com características essencialmente didáticas, o qual foi
denominado “The Cake”, metáfora que faz alusão à variabilidade total de um experimento, e que
tem suas partes tomadas pelos efeitos controláveis e incontroláveis. O “The Cake” foi construído
com interfaces amigáveis baseadas nas Tabelas, Figuras e Gráficos dos livros texto.
Received June 10, 2017 - Accepted Sep 29, 2017
Financial support: None.
This is an Open Access article distributed under the terms of the Creative Commons Attribution License, which permits
unrestricted use, distribution, and reproduction in any medium, provided the original work is properly cited.
Gestão & Produção, 27(2), e4070, 2020 | https://doi.org/10.1590/0104-530X4070-20 1/14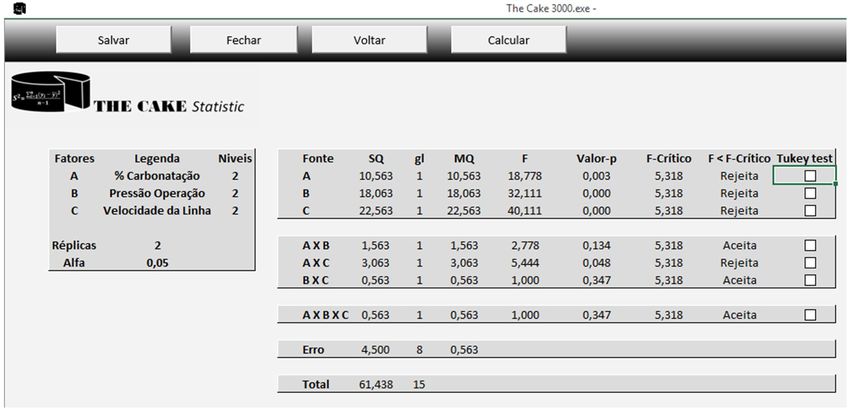
Learning support software...

A interatividade e análise passo a passo do experimento fazem do “The Cake” uma ferramenta
poderosa para o ensino das Técnicas de Planejamento de Experimentos.
Palavras-chave: Planejamento de experimentos; Software de ensino;            Software de
Planejamento de Experimento; Estatística.

1 Introduction
    Research environments, whether a laboratory, a pilot plant or even a factory in
operation, are places, in which, arise many questions, each with its own characteristics,
but all with similar needs of responses, which allow a high degree of understanding,
conception of mathematical models, determination of assertive parameters or even, a
better understanding of what occurs in the system.
    Design of Experiments is an important tool from the engineering sector, because it
improves the performance of manufacturing processes and in the same way, from
being widely applied in the development of new processes. Using the Design of
Experiment in this area results in products whose manufacturing process will be
facilitated, products with better performance and low production cost in a short
development planning time (Montgomery, 2012).
    However, as mentioned by Beauchamp & Youssef (1998), previous experiments
show that, conceptual aspects from Design of Experiment are, somehow, difficult to be
learned by students, in a fast and efficient way.
    “Many engineers do not use Design of Experiment, since statistics, planning and
discipline are required” (Anderson & Kraber, 1999, pp. 39-44). And “Unfortunately,
engineers and scientists rarely use statistics, as they claim it is heavily influenced by
the mathematical methods, rather than the scientific method” (Tanco et al., 2009,
pp. 565-575).
    A teaching reformulation in courses and universities, where will be worked, with
greater emphasis and in clear way, the concepts from the Design of Experiment
method, as Statistics, helps improving the subject understanding, minimizing the
unknown barriers and improving the technique dissemination and appreciation.
    Enns, 2008, emphasizes that, the usual approach when teaching Design of
Experiment is by using text books, and these are essentially statistical, making difficult
to understand the concepts.
    Considering the difficulties seen in Design of Experiment teaching, it is provided the
proposal of designing a software, with teaching characteristics, which aims to promote
interaction and, hence, motivation to students.
    As stated by Malara (2008), the conceptual development is assisted by using
technology tools, which can be used to solve actual issues, because these tools create
a new learning environment.
    By using softwares, interpretation of results acquired is emphasized, allowing all
efforts to be directed to the understanding of concepts and not to the means used, in
order to reach the result, decreasing the complexity to understand and also allowing
data to be viewed and analyzed in different ways.
    There are many categories of statistical software, and there is a capacity
overlapping of these statistical tools, among the several existing categories, but,
apparently, there is no single tool that covers all teaching use possibilities (Ben Zvi,
2000).
    Taking into consideration that using a statistical software in the teaching
environment is not the most adequate, it was proposed the creation of a software with

2/14                                                                   Gestão & Produção, 27(2), e4070, 2020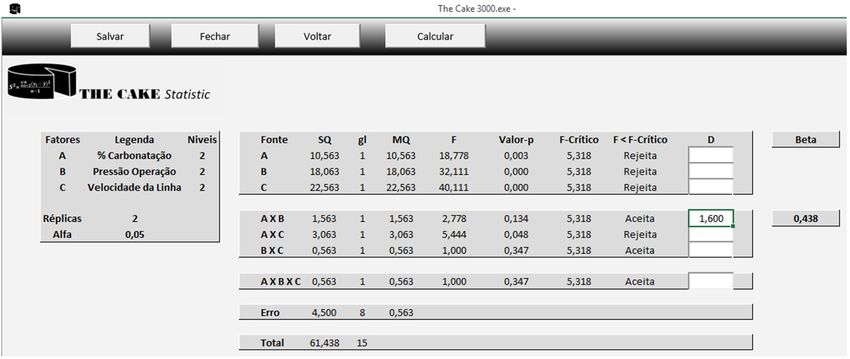
Learning support software...

               characteristics, which allow Design of Experiment to be understood as a data analysis
               tool, showing a balance between the techniques and the concept meanings, and
               preventing students from considering it as a “pile” of mathematical equations. Another
               point that justifies the proposal existence is to simplify using the software, in order not
               to lose the intended focus, allowing students to direct their efforts towards the concepts,
               and enabling them to understand what is occurring in each answer provided, thus,
               avoiding the proposed software to be a black box.
                   The purpose is, then, to present the software “The Cake”, as a study tool, which
               provides a learning environment, allows solving and verifying exercises and stimulates
               interaction and, hence, motivation, thus, supplementing the materials used in a Design
               of Experiment course.
                   According to Moore (1997), the learning process can be more effective, when the
               content ministered, the way it is ministered and technology resources complement each
               other in a balanced way.
                   Ben Zvi (2000) states that, the proper use of technology provides structural changes
               in the system of cognitive activities from students, causing a rearrangement of the
               mental processes, directing the activity to a higher cognitive level.
                   Reinforcing this concept, Tay & Butler (1999) mention that, many softwares are like
               catalogs formed in a standard module, without a logical sequence, being capable of
               leading to improper applications of the statistical method, apart from being weak to
               handle specific technical characteristics, which, actually, refers to their use by the
               layperson, which is seeking knowledge.
                   For Nickerson (1995) technology tools, specifically designed to teaching Statistics,
               can be developed to support the active construction of knowledge; create an
               environment, which allows reflection on the observed phenomenon; develop
               metacognitive capacities, i.e., knowledge on its own thinking process.
                   The creation of “The Cake” aims to promote an environment, which has engaging
               characteristics, with simple interfaces, that provide to the user a perception of the basic
               concepts from the Design of Experiment method.

               2 “The Cake” characteristics
                  This chapter shows the software features, proposed to be used as a teaching
               support tool, called “The Cake”. Each interface will be presented together with an
               example, with descriptions of the teaching characteristics and layout.

               2.1 Analysis flow from “The Cake”
                  Figure 1 shows the flow of steps executed by the software, during the analysis of
               experiments. It is important to mention that the concepts applied in this analysis are
               presented gradually, from the simple ones to those more complex.

Gestão & Produção, 27(2), e4070, 2020                                                                      3/14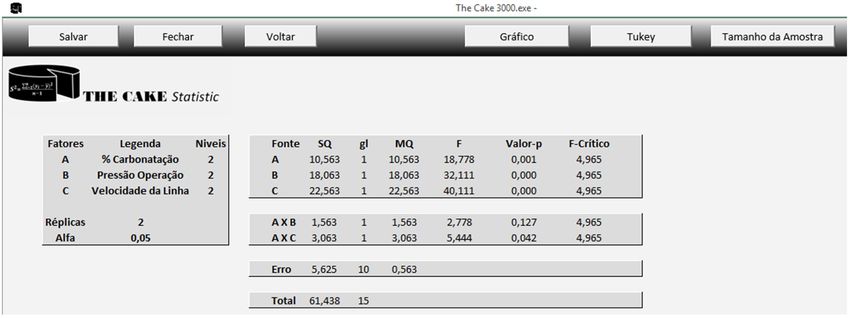
Learning support software...

                       Figure 1. Analysis Flow. Source: Prepared by the author.

   All analyses are started with an experiment identification, determining the factors,
levels, number of duplicates and degree of significance, then are ministered the
variability and variation concepts, using charts and tables, then the residue analyses
are presented, by using the Regression method and, finally, the comparison analyses
are presented, between the averages and sample size adaptation analyses.
   To demonstrate the software application, it was used a case example from
Montgomery (2012).

2.2 Case example used
   The case approaches a soft drink bottling process, in which the goal is to standardize
the quantity of soft drink bottled. The controllable factors are the percentage of
carbonation (Factor A), with low level at 10% and high level at 12%; operating pressure
(Factor B), with low level at 25psi and 30psi and line speed (Factor C), with low level at
200 bottled bottles per minute and high level at 250 bottled bottles per minute.
The response is the variation, in millimeters, of the level of the liquid in relation to the
standard height. The experimental matrix for this case is shown in Table 1.

Table 1. Experiment matrix from the bottling process.
                         Factors                                      Duplicates
A                    B                 C              I                     II
         -                     -             -                 -3                        -1
         +                     -             -                 -2                        -1
         -                     +             -                 -1                         0
         +                     +             -                  1                         0
         -                     -             +                 -1                         0
         +                     -             +                  1                         1
         -                     +             +                  1                         1
         +                     +             +                  4                         5
Source: Prepared by the author.

4/14                                                                             Gestão & Produção, 27(2), e4070, 2020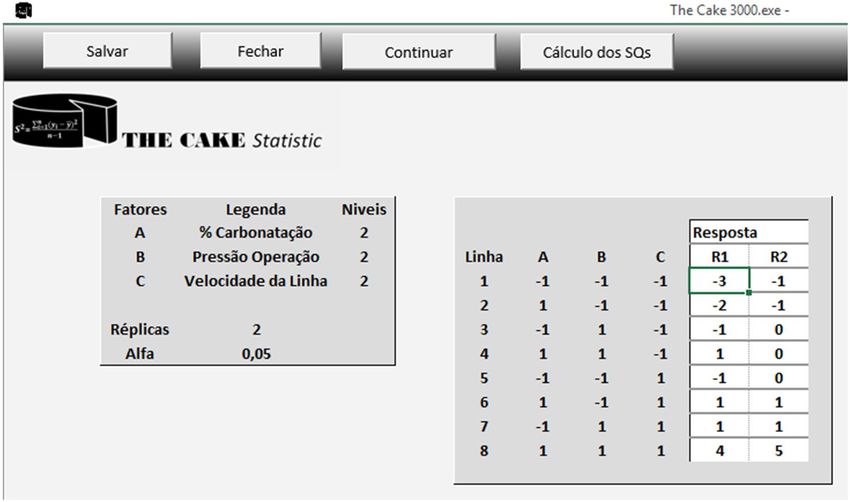
Learning support software...

               2.3 Experiment parameter determination
                  The first interface presented is the parameter determination, for identification of the
               experiment, then each factor will be identified, including its levels, as well as duplicates.
               Also, the degree of significance α will be defined, which can range from 0.01 to 0.99.
               The first interface shows a very simple layout, which makes identification of the
               experiment the actual focus, as demonstrated in Figure 2. This interface provides two
               options: “Data Entry” and “Experiment Matrix”.

                 Figure 2. Interface of Experiment Parameter Determination. Source: Prepared by the author.

                  The option “Experiment Matrix”, as the name suggests, will present the
               Experimental Matrix, which is a table with the factor level combinations, as show in
               Figure 3.

                             Figure 3. Experiment Matrix Interface. Source: Prepared by the author.

                   The interface shows a chart with the experiment parameter determination, which
               will remain in the other screens.

Gestão & Produção, 27(2), e4070, 2020                                                                          5/14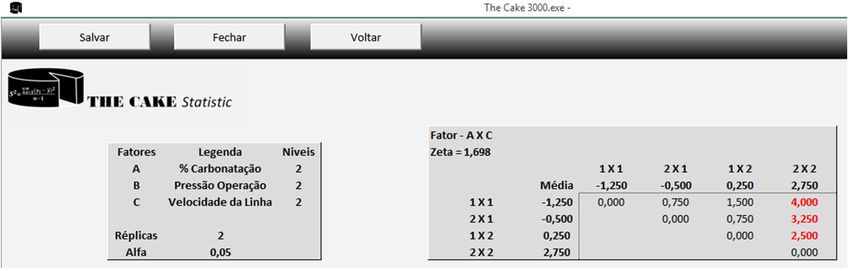
Learning support software...

    The Experimental Matrix, Figure 3, is presented as a table, in which each line
represents a combination of factor levels; low level is represented by number -1, while
high level is represented by the number 1.
    After the identification, press the button “Início” (Start) to return to the screen shown
in Figure 2, next enter the test results, by pressing the “Entrada de Dados” (Data Entry)
button, which will go to the screen shown in Figure 4.

                 Figure 4. Interface of Result Entry. Source: Prepared by the author.

2.4 Experiment result entry
    After the Experimental Matrix view, next is shown the “Entrada de Dados” screen.
This interface allows viewing each experiment line, which shows a combination of the
factor levels. Enter the respective experiment result, and press the button
“Entrar/Alterar” (Enter/Change) to record the result. After pressing this button, the next
experiment line will be shown, until all results are recorded.
    This screen also allows the user to navigate through each line of the experiment in
the standard sequence, by using the buttons “Anterior” (Previous) and “Próximo”
(Next). In case any result entered must be corrected, correct it and press the
“Entrar/Alterar” button.
    Figure 4 shows the first line from the Design of Experiment, used as an example.
    For an overview of the experiment, press the “Visualizar” (View) button to display
the screen with a chart, which includes all experiment lines, according to Figure 5.

          Figure 5. Interface of Result Entry [Overview]. Source: Prepared by the author.

6/14                                                                           Gestão & Produção, 27(2), e4070, 2020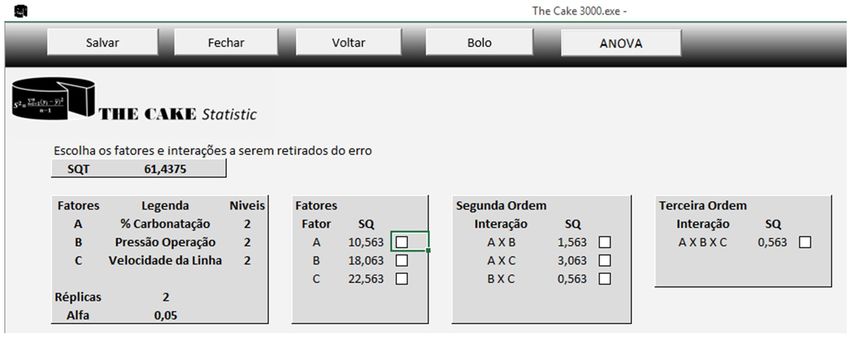
Learning support software...

                  This interface also allows entering and changing results, which can also be copied
               and pasted from an Excel spreadsheet.
                  In both screens, it is possible to go the variability calculation, pressing the “Cálculo
               dos SQs” (SQ Calculation) button.

               2.5 Variability and variation analysis
                  From this point on, it is possible to start navigating by the statistical analyses.
                  In this step, it is possible to view the total variability, and its breakdown in terms of
               handling and error, according to Figure 6.

                           Figure 6. Interface of Sum of Squares. Source: Prepared by the author.
               In this screen is possible to view existing variability in the main effects and interactions. The
               software allows selecting the effects, which are considered significant by the user, by just
               selecting the respective checkbox. It is important to mention that any effects not selected will
               compose the error.

                  Before carrying out the other analyses, it is possible to check through charts, the
               existing variabilities and the impact of all choices made in the error, by pressing the
               “Bolo” button, as shown in Figure 7.

                                        Figure 7. Bolo Interface.Source: Prepared by the author.

Gestão & Produção, 27(2), e4070, 2020                                                                              7/14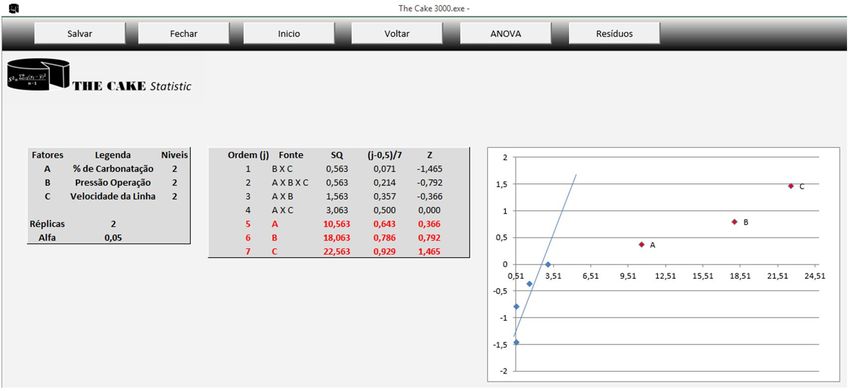
Learning support software...
This screen shows a chart, with the variabilities from the main factor effects, and
from the interactions, as previously selected, as well as the error and the total
variability.
Additionally, the screen in Figure 7 shows a pie chart, which summarizes all
selected variabilities, in order to identify each term effect variability representation, in
relation to the total variability. The chart view clearly shows that the experiment
variability is exclusive, composed by the portions due to the factor effects and error.
The next step of the experiment analysis is to summarize the variabilities in the
classic table, from the Variation Analysis (ANOVA), Figure 8, what can be done by
pressing the ANOVA button in the screen from Figure 6.
Figure 8. ANOVA Interface. Source: Prepared by the author.
A full chart from the variation analysis, with the values from the sum of squares,
freedom degree, variation, Snedecor F values, calculated and critical, with the p-value
shown in this screen.
If the factors and interactions selected are improper, not providing the expected
result in the hypothesis test, it is possible to return to the screen shown in Figure 6, to
select other factors and interactions.
For this example, ANOVA shows that the interactions AB, AC and ABC are not
statistically significant, thus, it is possible to return to the screen shown in Figure 6 and
select only the factors that are truly significant.
The factors and interactions selected now will compose the mathematical model,
shown below.
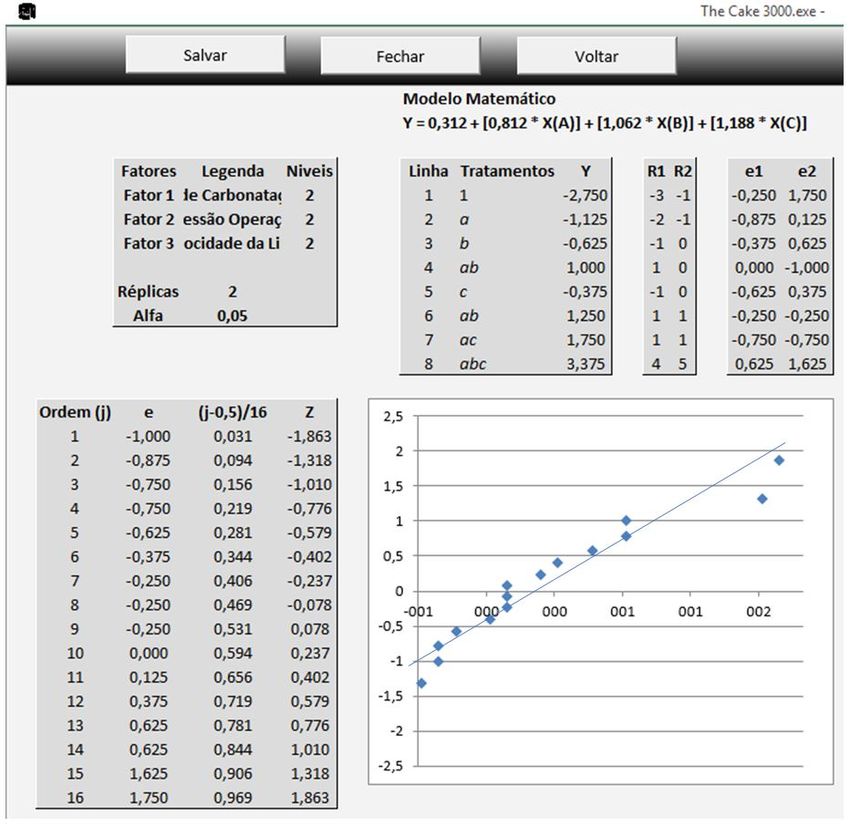
A chart of the z-value from the accrued Probability by the variabilities, as shown by
Figure 9, is a second way of viewing if the factor effects are significant. This option can
be accessed, by pressing the “Gráfico” (Chart) button in the interface shown in Figure 8,
however this can be used only for 2k factor based experiments.
8/14 Gestão & Produção, 27(2), e4070, 2020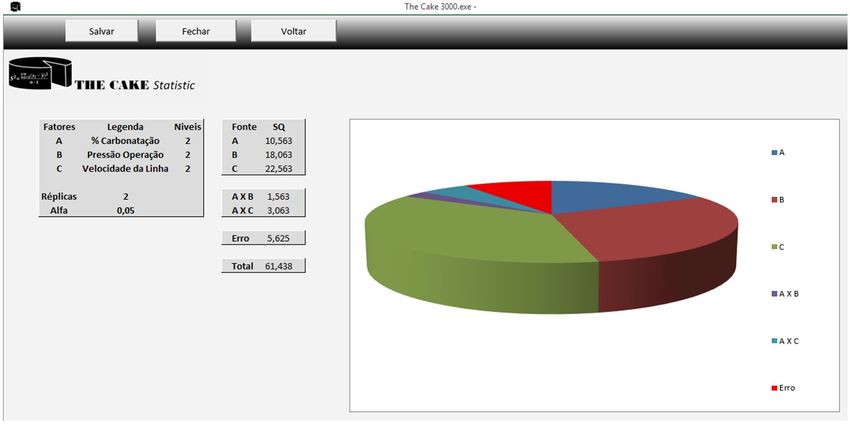
Learning support software...

                              Figure 9. Interface of Chart Analysis. Source: Prepared by the author.

                   Figure 9 shows a table, in which, the first column is “Ordem (j)” (Order), the second
               is the variation sources (factors and interactions), the third shows the respective values
               from variabilities, the fourth the accrued probabilities and, finally, the fifth column shows
               the z-value from the accrued probabilities. The variation source lines, selected by the
               user will be highlighted in red in this chart.
                   This screen also shows the chart with the values from the sum of squares by the
               z-value, from the accrued experiment probabilities, showing how the significant
               values from the experiment differ from others. The points from the variation sources
               selected, in the same way, will be highlighted in red.
                   From the interface shown in Figure 9, it is possible to go to the residue analysis, by
               pressing the “Resíduos” (Residues).

               2.6 Residue analysis
                   Before proceeding to the residue analysis, it is necessary to identify the factors
               related to its qualitative and quantitative nature. This identification process can be
               executed in the interface shown in Figure 10.

                           Figure 10. Factor Classification Interface. Source: Prepared by the author.

Gestão & Produção, 27(2), e4070, 2020                                                                           9/14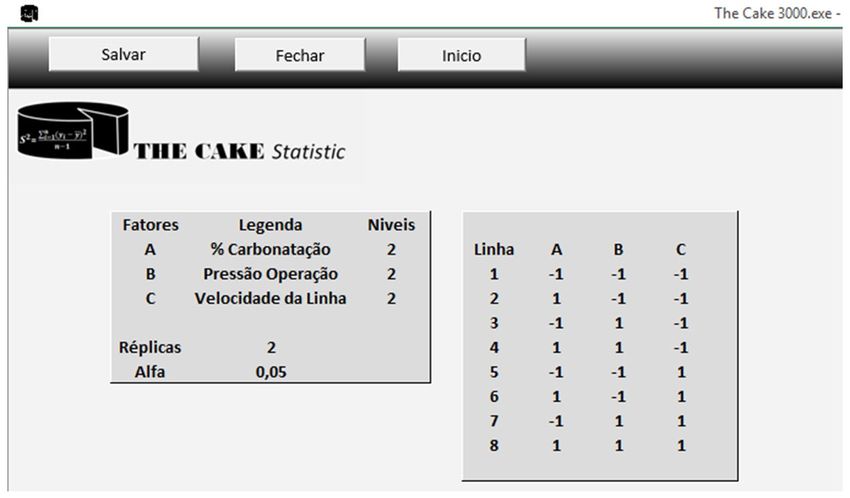
Learning support software...

   After entering the nature of factors, the residue analysis can be executed by using
the “Resíduos” button to go to the screen show in Figure 11.

             Figure 11. Interface of Residue Analysis. Source: Prepared by the author.

    This screen shows the regression model for the response variable, but only if all
factors are quantitative. Below the model, it is provided a chart with the standard
sequence of the experiment, the handling processes represented in accordance with
the Yates standard, and the predicted values by using the proposed model; a second
chart with the values noticed; and a third chart with the residues, which represent the
difference between each result acquired by the predicted value.
    Also, it is provided a chart, in which, residues are organized for plotting the normal
Probability chart. The first column is the “Ordem (j)” from residues; the second shows
the residues, sorted in ascending order; the third shows the accrued probabilities and
the last column shows the z-value from each accrued probability. And finally, it is shown
the residue chart by the normal probability.
    To continue the other analyses, press the “Voltar” (Back) button to return to the
screen shown in Figure 8, in which, there are two more analysis options, the
comparison of the averages by using the Tukey, method and verification of the sample
size adaptation.

10/14                                                                        Gestão & Produção, 27(2), e4070, 2020
Learning support software...
2.7 Comparison of averages by using the Tukey Method
To carry out the comparison of averages by using the Tukey method, press the
“Tukey” button, to display the screen shown in Figure 12.
Figure 12. Interface of Tukey Method. Source: Prepared by the author.
Figure 11 shows the full chart, from variation analysis with checkboxes, which allow
selecting the factors or interactions; to perform the analysis, press the “Calcular”
(Calculation) button.
If a variation source which is not applicable is selected, this analysis will display a
warning, informing that the current factor does not apply to this type of test. Then, after
selecting only the factors and interactions, on which the Tukey test can be applied,
press the “Calcular” button to display the screen shown in Figure 13.
Figure 13. Interface of Symmetric Matrix. Source: Prepared by the author.
This interface shows a chart for each factor or interaction selected by the student.
Each chart presents the factor or interaction, the Zeta value and the symmetric matrix,
with differences between the averages in its absolute value, any values higher than
Zeta value are highlighted in red.
This screen facilitates viewing the differences between the averages and
comparison with the Zeta value, and it is similar to how results are shown by using text
books.
To carry out the last analysis, press the “Voltar” button to return to the screen shown
in Figure 8, which allows verifying the sample size adaptation.
Gestão & Produção, 27(2), e4070, 2020 11/14Learning support software...
2.8 Sample size adaptation verification
By pressing the “Tamanho da Amostra” (Sample Size) button, the screen shown in
Figure 14 will be displayed.
Figure 14. Sample Size Interface. Source: Prepared by the author.
This interface helps checking if the number of duplicates from the experiment is
adequate, for the factors or interactions with minor effect, by using the Probability value
Beta (β).
This interface shows the full chart from variation analysis, in which in front of each
source, there is a field to enter the D value, the minimum difference considered
relevant, between the target factor levels to be analyzed. This value must be assigned
by an expert. Next, press the “Calcular” button, for the probability value Beta to be
calculated and displayed in the adjacent column.
This screen enables the user to directly calculate the Beta value, without relying on
curve verification in complex charts. Therefore, one can focus on analyzing if the Beta
Probability is showing a proper sample size.
3 Conclusion
Carry out experiments, with the purpose of investigating a system is an engineering
principle, which aims to improve or develop the system.
Montgomery (2012) states that, the Design of Experiment is an adequate scientific
method, whose purpose is to improve the productivity of a process, minimizing any
variabilities, and reducing the time and cost spent on development.
However, there are obstacles that prevent using this method, which are mainly
related to the method understanding, being the statistics complexity one of them,
because it is based on mathematics, which complicates the learning process when
applied. Another point highlighted as an obstacle is that, the softwares used as a
teaching resource in courses, do not have the proper features to this end.
Typically, commercial software are used, with the purpose of assisting the teaching
process in courses, and there are many of these softwares, which are capable of
executing very complex statistical analyses related to the Design of Experiment, with a
few examples of software being, the Minitab, JMP, Sigma XL, Statigraphics Centurion
12/14 Gestão & Produção, 27(2), e4070, 2020Learning support software...
XVI, among others. However, the complexity of the analyses executed by these
softwares is too much for a beginner, making it difficult to learn the method by using it.
Other types of softwares found, are those designed for experiment simulation, like
GolferApp and DOE-SIM, which simulate experiments, changing the factors involved,
focusing on the planning and execution, but not supporting the analysis method
understanding.
It is also possible to find electronic Spreadsheets designed for teaching, however
due to the limitations of this resource, these are always used in a specific experiment
type, restricting the subject extent.
Despite being an improvement in education with assistance by softwares, they lack
the essential features to this purpose, like interfaces similar to text books, tool
simplicity, presentation of concepts in a gradual way, among other features capable of
meeting teaching needs.
A revision from the subject literature revealed specific deficiencies, which motivated
the creation of a prototype with teaching characteristics, that enables those interested
in learning Design of Experiment, to use it when studying. Thus, this thesis proposes
developing software with the purpose of filling these gaps.
The software proposed, called “The Cake”, which refers to the total variability from
the experiment, whose portions are deducted by the effects, aimed to provide teaching
principles and its interfaces were designed in a similar way to text books, improving
metacognitive processes and facilitating the navigation, which occurs in a flow, for all
analyses to be displayed in a simple and gradual way, allowing the student to focus on
the method concepts.
When using this software, the user starts by providing the characteristics from his
experiment, taking into consideration the planning and, then entering the results.
The analysis interfaces are navigated by first providing the variability concept, and,
then, carrying out the residue analysis by using the regression method. The comparison
between the averages, by using the Tukey method can be addressed in the sequence,
and within this subject a special care was taken, which was developed in function of
the Studentized extent distribution, in order to not lose the accuracy of this technique
due to interpolations of values from the tables. Finally, the user can analyze the sample
size adaptation, by using the Beta Probability, type II error, value acquired by the non-
central function from distribution F, eliminating the need of using abacuses from the
operating curves to acquire this probability.
This prototype was tested during a class from an Design of Experiment course, was
used for solving some exercises and was also provided for students to study using it,
and many opinions from these students show that, the software facilitates the
understanding of concepts involved with the method, because it provides friendly
screens, which are similar to text books, it is easy to use and provides proper interaction
with the user, what shows that, this thesis accomplished its purpose.
References
Anderson, M. J., & Kraber, S. L. (1999). Eight keys to successful DoE. Quality Digest, 19, 39-
44.
Beauchamp, Y., & Youssef, Y. A. (1998). An effective approach to teach design of experiments
(DOE) using calculation-and-analysis worksheets and computerized spreadsheets.
Computers & Industrial Engineering, 35(3-4), 643-646.
Gestão & Produção, 27(2), e4070, 2020 13/14Learning support software...
Ben-Zvi, D. (2000). Toward understanding the role of technological tools in statistical learning.
Mathematical Thinking and Learning, 2(1-2), 127-155.
Malara, M. B. S. (2008), Os saberes docentes do professor universitário do curso introdutório
de estatística expressos no discurso dos formadores. Rio Claro: Universidade Estadual
Paulista.
Montgomery, D. C. (2012). Design and analysis of experiments. Arizona: John Wiley & Sons,
Inc.
Moore, S. (1997). The Role of the Teacher in Distance Education: The Teacher Perspective.
Canada: Alberta.
Nickerson, R. S. (1995) Can technology help teach for understanding? In. D. N. Perkins, J. L.
Schwartz, M. M. West & M. S. Wiske (Eds.), Software goes to school: Teaching for
understanding with new technologies (pp. 7-22). USA: Oxford Scholarship Online.
Tanco, M., Viles, E., Ilzarbe, L., & Alvarez, M. J. (2009). Barriers faced by engineers when
applying design of experiments. The TQM Journal, 21(6), 565-575.
http://dx.doi.org/10.1108/17542730910995846.
Tay, K. M., & Butler, C. (1999). Methodologies for experimental design: A survey, comparison,
and future predictions. Quality Engineering, 11(3), 343-356.
14/14 Gestão & Produção, 27(2), e4070, 2020You can also read