Soasoa Integrated Watershed Management Plan - The ...
←
→
Page content transcription
If your browser does not render page correctly, please read the page content below
A.1

      Soasoa Integrated Watershed
      Management Plan

      Historic Flood Report
      February 2021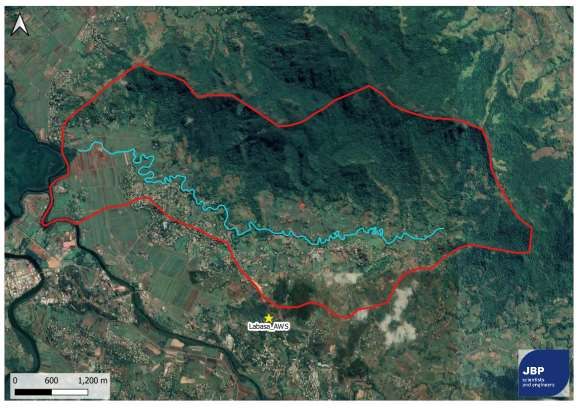
Contract
This report describes work commissioned by Patrick Fong of EcoPacifika Consulting, on behalf of
SPC. Ellie Vahidi, William Prentice and Daniel Rodger of JBP, together with Patrick Fong of Eco-
Pasifika Consulting carried out this work.

Prepared by .................................................. Dr Ellie Vahidi PhD, MEng, BEng
                                                               Hydraulic Engineer

Reviewed by ................................................. William Prentice BEng, CPEng, NER, MIEAust, FMA
                                                              Technical Director

Approved by .................................................. Daniel Rodger BSc MEng CEng CMarEng MIEAust
                                                               Director

Purpose
Jeremy Benn Pacific ("JBP") has prepared this report for the sole use of Eco Pasifika (the “Client”)
and its appointed agents in accordance with the Agreement under which our services were
performed.
JBP has no liability regarding the use of this report except to the Client. No other warranty,
expressed or implied, is made as to the professional advice included in this report or any other
services provided by JBP. This report cannot be relied upon by any other party without the prior and
express written agreement of JBP.
The conclusions and recommendations contained in this report are based upon information
provided by others and upon the assumption that all relevant information has been provided by
those parties from whom it has been requested and that such information is accurate. Information
obtained by JBP has not been independently verified by JBP, unless otherwise stated in the report.
The methodology adopted and the sources of information used by JBP in providing its services are
outlined in this report. The work described in this report was undertaken between October 2020 to
December 2021 and is based on the conditions encountered and the information available during
this period of time. The scope of this report and the services are accordingly factually limited by
these circumstances.
Any assessments of works or costs identified in this report are based upon the information available
at the time, and where appropriate are subject to further investigations or information which may
become available.
JBP disclaim any undertaking or obligation to advise any person of any change in any matter
affecting the report, which may come or be brought to JBP's attention after the date of the report.
Certain statements made in the report that are not historical facts may constitute estimates,
projections or other forward-looking statements, and even though they are based on reasonable
assumptions as of the date of the report, such forward-looking statements by their nature involve
risks and uncertainties that could cause actual results to differ materially from the results predicted.
JBP specifically does not guarantee or warrant any estimate or projections contained in this report.

 5. Historic Flood Report                                                                                    i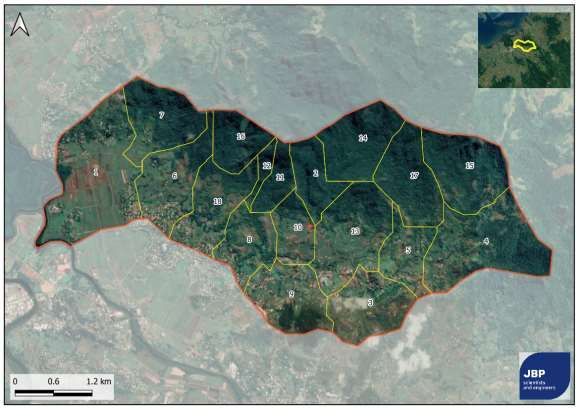
Executive Summary
This historic mapping report for the Soasoa catchment, Fiji, has been undertaken by JBPacific, in
conjunction with Eco Pasifika, on behalf of the Pacific Community (SPC).
SPC and the Ministry of Waterways and Environment (MoWE) is planning to enhance the resilience
of vulnerable coastal communities in Fiji to climate change and natural hazards. This will be
achieved by scaling up of drainage and coastal protection infrastructure with integration of
community and ecosystem-based adaptation. This project will prepare an Integrated Catchment
management Plan for the Soasoa catchment, located within the Macuata Province, on the northern
coastline of Vanua Levu. Historic flood mapping will help support these goals, which can be used
to plan new drainage improvements and catchment management actions
Historic flood mapping has been undertaken for the historical TC Victor (2016) and TC Keni (2018)
events. The mapping shows that the lower reaches of the catchment are more vulnerable to
flooding, which can inundate transport links, government assets and private properties. The upper
reaches of the catchment are less prone to flooding, however given the high velocities may be prone
to scour and erosion.

 5. Historic Flood Report                                                                       ii
Contents
Executive Summary ............................................................................................................ ii
1          Introduction ............................................................................................................ 1
1.1        General .............................................................................................................................. 1
1.2        Objectives .......................................................................................................................... 1
1.3        Structure of the report ........................................................................................................ 1
2          Background on the study area and site inspections .............................................. 2
2.1        Climatology and hydrology ................................................................................................. 2
2.2        Flood infrastructure ............................................................................................................ 5
3          Available data ........................................................................................................ 6
3.2        Topographic data ............................................................................................................... 6
3.3        Tide information ................................................................................................................. 7
3.4        Storm surges ...................................................................................................................... 7
4          Flood modelling ..................................................................................................... 8
4.1        Watershed mapping ........................................................................................................... 8
4.2        Design rainfall estimation ................................................................................................... 8
4.3        Historic rainfall analysis...................................................................................................... 9
4.4        Flood modelling .................................................................................................................. 10
4.5        Historical flood results and mapping .................................................................................. 12
5          Discussion ............................................................................................................. 14
5.1        Limitations .......................................................................................................................... 14

 5. Historic Flood Report                                                                                                                              iii

List of Figures
Figure 2-1: Study area ...................................................................................................... 2
Figure 2-2: Flood images for various TC and rainfall events .............................................. 4
Figure 2-3: Upper Soasoa catchment (Source: Patrick Fong 2020) ................................ 4
Figure 2-4: Lower Soasoa catchment (Source: Patrick Fong 2020) ................................ 5
Figure 2-5: Levee and flood infrastructure at lower catchment (Source: Patrick Fong 2020)
           ........................................................................................................................... 5
Figure 3-1: Closest Automatic Weather Station to the Soasoa catchment ...................... 6
Figure 4-1: Soasoa subcatchment delineation ................................................................... 8
Figure 4-3: GEV L-Moments analysis of historical annual maxima series at Labasa AWS 9
Figure 4-2: Rainfall hyetographs for TC Victor (left) and TC Keni (right) ........................... 10
Figure 4-4: TUFLOW model configuration.......................................................................... 10
Figure 4-5: TUFLOW land use............................................................................................ 11
Figure 4-6: Flood depth in 2016 event (TC Victor) ............................................................. 13
Figure 4-7: Flood depth in 2018 event (TC Keni) ............................................................... 13

List of Tables
Table 2-1: Flood events in Labasa district (adopted from McGree et al 2010) ................ 3
Table 3-1: Extreme sea levels at Labasa (McInnes et al 2014) ....................................... 7
Table 4-1: Sub-catchment parameters ............................................................................. 8
Table 4-2: Extreme daily rainfall estimates at Labasa AWS ............................................ 9
Table 4-3. TUFLOW model hydraulic roughness values .................................................... 11

Abbreviations
AWS ................................ Automatic Weather Station
BoM ................................. Bureau of Meteorology
JBP ................................. Jeremy Benn Pacific or JBPacific
MoWE ............................ Ministry of Waterways and Environment
PCRAFI ........................... Pacific Catastrophe Risk Assessment and Financing Initiative
SPC ................................. The Pacific Community

 5. Historic Flood Report                                                                                                                  iv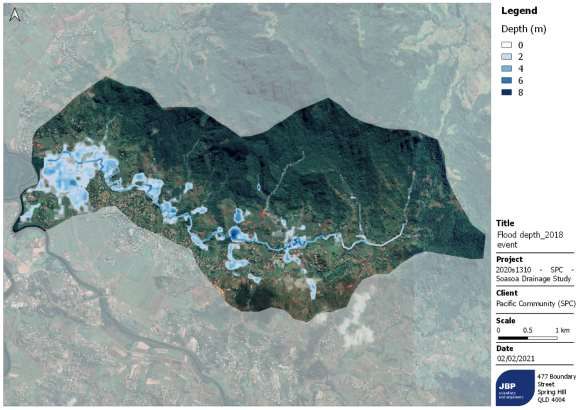
1        Introduction
1.1      General
         This historic mapping report for the Soasoa catchment, Fiji, has been undertaken by JBPacific, in
         conjunction with Eco Pasifika Consulting, on behalf of The Pacific Community (SPC).
         The Republic of Fiji includes over 320 Islands. Fiji is second only to Papua New Guinea as the
         Pacific island country having been most affected by natural disasters since 1990 1. It experiences
         experience a range of extreme weather, from cyclones, monsoons, rainfall, flooding and coastal
         surges. Integrated infrastructure upgrades, disaster management and catchment management is
         seen as an increasingly important step to support local economic activity, to promote and enhance
         biodiversity, and increase resilience to extreme weather.
         The key natural hazards effecting Fiji are due to tropical cyclones and extreme weather. These
         events lead to extreme rainfall, riverine flooding, storm surges and coastal flooding. These effect a
         range of economic sectors, public infrastructure, coastal settlements, and tourist facilities, which
         can be located in flood-prone catchments of in low-lying coastal areas.
         SPC and the Ministry of Waterways and Environment (MoWE) is planning to enhance the resilience
         of vulnerable coastal communities in Fiji to climate change and natural hazards. This will be
         achieved by scaling up of drainage and coastal protection infrastructure with integration of
         community and ecosystem-based adaptation. This project will prepare an Integrated Catchment
         management Plan for the Soasoa catchment, located within the Macuata Province, on the northern
         coastline of Vanua Levu. Historic flood mapping will help support these goals, which can be used
         to plan new drainage improvements and catchment management actions.

1.2      Objectives
         Key objectives of this report are:
              •    Present a desktop review of technical reports, published articles, and policies
              •    Present the information gained from rapid site inspections
              •    Undertake hydrologic analysis of catchment to define the river inflow characteristics for
                   historic flood events
              •    Establish a hydraulic flood model for the study area to determine flood hydraulic behaviour.
              •    Prepare flood mapping for historic flood events.

1.3      Structure of the report
         In addition to this introductory chapter, this report contains the following:
              •    Section 2: Background information on the study area and site inspections
              •    Section 3: Available data
              •    Section 4: Flood modelling
              •    Appendix A: Flood maps

1 ADB (2005) “Fiji Islands: Country Environmental Analysis”, Asian Development Bank.

           5. Historic Flood Report                                                                         1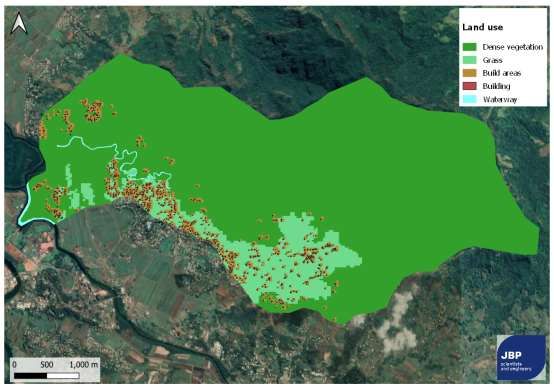
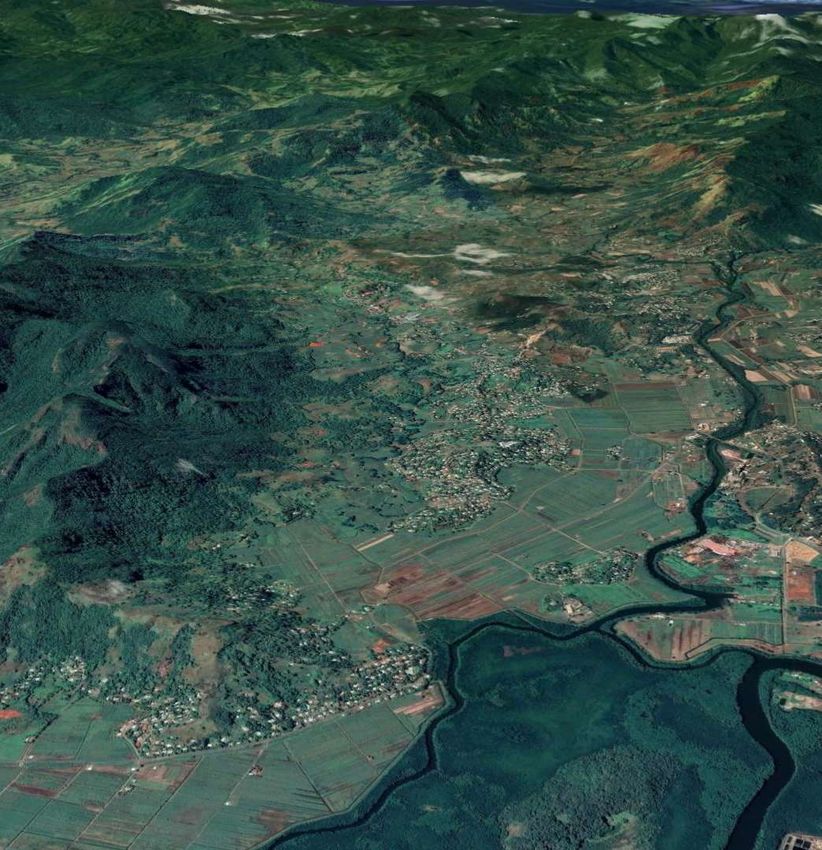
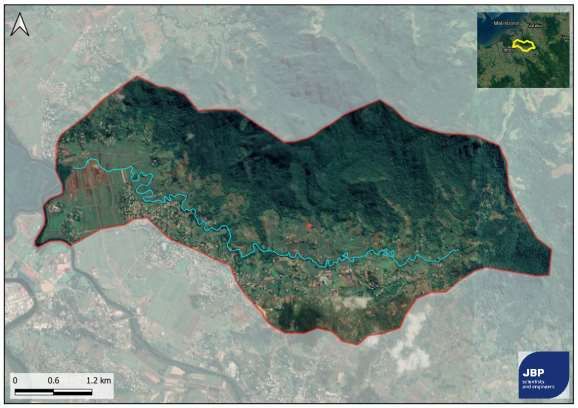
2        Background on the study area and site inspections
         The Soasoa catchment is located within the Macuata Province, on the northern coastline of Vanua
         Levu. The catchment forms part of a major three-river estuary system, which includes the Labasa,
         Qawa and Wailevu rivers, which converge and discharge into the ocean. It has a relatively small
         catchment area, around 20km2, with steep upper regions (see Figure 2-1). The steep upper
         catchments include some of the highest mountains on the island, and face into the common north-
         westerly cyclone direction. This topography creates exceptional orographic rainfalls, which are
         rapidly converted into runoff (Terry & Raj 1999)2. During flood conditions extreme runoff can merge
         within the lower catchment, which has flat alluvial terraces and wider floodplains.

         Figure 2-1: Study area

2.1      Climatology and hydrology
         Fiji is second only to Papua New Guinea as the Pacific island country most affected by natural
         disasters since 1990 (ADB 2005). This is due to the range of extreme weather phenomenon that
         occur throughout the islands, which includes tropical cyclones, monsoons, extreme rainfall, flooding
         and coastal surges.

2.1.1    Cyclones
         Analysis of the historic cyclone tracks show 40 tropical cyclones have passed through Fiji waters
         between 1969 to 2018, each with the potential to make landfall (See Figure 2-2, based on BoM
         2020) 3. Coinciding with the threat of tropical cyclones during the Fiji wet season, which falls between
         November to April. Flooding due to heavy rain typically occurs between January to March and can
         be exacerbated by tropical cyclone precipitation. Significant floods occurred in Labasa district in
         1929, 1938, 1950, 1986, 1988, 1997, 1998, 2000, 2003, 2007, 2009, 2016, 2018 and 2020.

2 Terry, J., and Raj, R. (1999) Island Environment and Landscape Responses to 1997 Tropical Cyclones in Fiji. Pacific Science 53,
257–272.
3 BoM (2020) "Southern Hemisphere Tropical Cyclone Data Portal". Accessed on 20 Oct 2020 from:
http://www.bom.gov.au/cyclone/tropical-cyclone-knowledge-centre/history/tracks/.

           5. Historic Flood Report                                                                                           2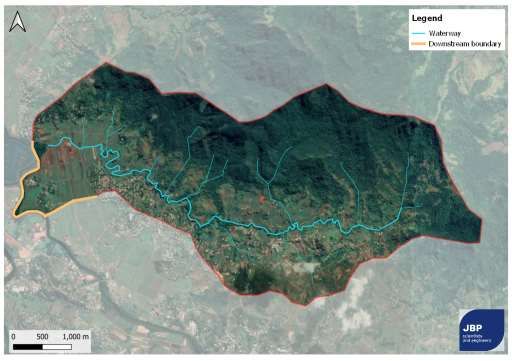
2.1.2     Precipitation and flooding
          A range of historic and recent flood events are described in Table 2-1, with several images shown
          in Figure 2-2. These include investigations undertaken by McGee (2010) 4, which has been
          supplemented by recent data.
          Prior to Tc Yasa, which occurred during development of this study, the most extreme flooding within
          the region is believed to be during TC Ami, which made landfall in January 2003. During this event,
          the three rivers surrounding the Soasoa catchment produced record-breaking flows, which
          coincided with a cyclone-generated storm surge, and caused widespread inundation. The peak
          discharge for the Labasa River was estimated by the Hydrology Division of the Fiji Public Works
          Department soon after flood waters receded.
           Table 2-1: Flood events in Labasa district (adopted from McGree et al 2010)
                 Date of Peak            Reason for High Rainfall                 Flood Description and Areas Affected

                1929 Dec 11-12                   Hurricane                 Qawa River flood peak 3 ft (0.9m) above 1912 peak at
                                                                                               Labasa Mill
                  1938 Dec 22                     Cyclone                    Qawa River rose 4.5 ft (1.4m) above high tide level

                  1950 Mar 30                 Moderate storm                Significant flood damage in Wainikoro and Bucaisau
                                                                            districts; flood 2 ft (0.6m) over Wainikoro office floor.
                1986 Dec 28-30                   Hurricane               Labasa River experienced worst flood since 1929, Labasa
                                                                           town's main street under 1m of water for the first time
                                                                                                since 1929
                  1988 Feb 25                    Hurricane                                   Flooding in the area

                      1997                       TC Gavin                 Extensive flooding of Labasa town (McInnes et al. 2014).

                1998 Dec 24-25                   Hurricane                     Flooding in Labasa and Northwestern Viti Levu

                2000 Apr 14-15                    TC Neil                Flood peak in Qawa River estimated ‘major’ since Labasa
                                                                            Mill flooded, possibly highest event there in 50 years
                  2003 Jan 14                     TC Ami                  Strong storm surge along northern coast of Vanua Levu,
                                                                         combined with severe river floods, led to record flooding at
                                                                                                  Labasa
                 2007 Mar 9-14              Low pressure trough,           The Qawa River burst its banks at about 5pm on 10th.
                                          leading to heavy rainfall
                                        received in the northern and
                                            western parts of Fiji.
                  2009 Feb 20             Trough moved eastward          Flash flooding due to heavy local rain and blocked drains.
                                         than retrogressed across
                                         the country between 18th
                                                 and 24th.
                      2018                        TC Keni                Roads closed due to flooding in Macuata (see Figure 2-2)

                   April 2020                    TC Harold                Roads closed due to flooding in Macuata. Wider impacts
                                                                          included F$100 million of damage across Fiji (FBC 2020)

4 McGree, S., Yeo, S. W., & Devi, S. (2010). Flooding in the Fiji Islands between 1840 and 2009. Risk Frontiers.

           5. Historic Flood Report                                                                                                     3
Flooding in Labasa during TC Ami (2003)            Flooding in Labasa during TC Ami (2003)

            BoM Tropical Cyclone Portal showing historic tracks   Soasoa flats flooding during Cyclone Keni 2018

        Figure 2-2: Flood images for various TC and rainfall events

2.1.3   Site inspection
        Rapid site inspections were undertaken in October 2020 to review catchment conditions. Site
        images are shown in Figure 2-3 to Figure 2-5. These inspections identified the flood levee and gate
        structures in the lower catchment to be important for flood mapping. Detailed structure information
        has been requested for use in this project, however, this information is not available at the time of
        this report. Should this information be made available it is recommended to be incorporated into
        the flood model.

        Figure 2-3: Upper Soasoa catchment (Source: Patrick Fong 2020)

         5. Historic Flood Report                                                                                  4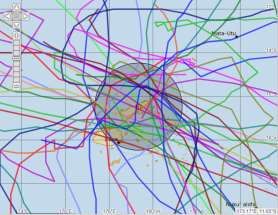
Figure 2-4: Lower Soasoa catchment (Source: Patrick Fong 2020)

         Figure 2-5: Levee and flood infrastructure at lower catchment (Source: Patrick Fong 2020)

2.2      Flood infrastructure
         Number of drainage and flood management actions have been undertaken within the catchment.
         In the late of 1970s a series of levees and floodgates constructed to protect reclaimed areas in the
         lower catchment. These operated relatively well until the last decade, when a reduction in
         performance was observed, considered due to an increased frequency of short-lived extreme
         rainfall events and the effect of sea level rise (GCCAPlus, 2020)5. Structural measures introduced
         in 1980's include dredging rivers and constructing seawalls.

5 GCCAPlus. (2020). The Global Climate Change Alliance Plus – Scaling up Pacific Adaptation (GCCA+ SUPA) Project. Access date:
18/06/2020, from http://ccprojects.gsd.spc.int/gccasupa/.

           5. Historic Flood Report                                                                                        5
3 Available data
3.1.1 Rainfall data
Rainfall data was provided by the Hydrology Unit of the Fiji Department of Meteorology (Fiji Met).
There is no gauging station in the proximity of Soasoa drainage area, therefore the gauging records
of Labasa Automatic Weather Station (AWS) was used (see Figure 3-1). AWS data provided by Fiji
Met was limited to two data series.
• Daily rainfall data from 1959 to 2003 year at Labasa DE, Vatunibale
• Hourly rainfall data from 2016 to 2020 year at Labasa AWS.
Figure 3-1: Closest Automatic Weather Station to the Soasoa catchment
3.2 Topographic data
Topographic data for the catchment is variable, with only the Shuttle Radar Topography Mission
(SRTM) 1 second (~30m grid resolution) topographic data available consistently across the
catchment. The data is limited to integer values (1m, 2m, 3m etc), which limits its performance near
coastline, where small variations in elevation may change flood results. However, in the absence
of more detailed elevation data, the SRTM 1 second data was used as the basis in this study.
The elevation datum has been assumed as Above Sea Level (ASL). A degree of uncertainty exists
within the SRTM datum. Digital Elevation Models are often referenced to a global model of the
geoid – a model of global mean sea level. Analysis of the observed height difference between the
geoid and local definitions of mean sea level varies in the order of ±1.0m across the globe. Typically,
coastal or flood inundation studies neglect to correct for this misalignment, and as such may
significantly under or overestimate the magnitude (depth and extent) of inundation when calculated
by numerical modelling. This is especially important for low lying islands such as the Soasoa
catchment, where an error in the absolute vertical reference between sea levels and terrain will
significantly affect the validity of the calculated hazard. This error, when propagated to the risk and
economic calculations can cause significantly misleading outputs. This may be corrected through
analysis of local survey information, or engaging new topographic survey within the catchment, both
of which is not within the current scope of this project.
5. Historic Flood Report 63.3 Tide information
The main river in Soasoa drainage catchment is Nababuabua Creek, which discharges into the
intertidal mangrove area. Due to lack of data and measurements in this area, the tidal range was
estimated based on studies undertaken for the Labasa River for the Labasa Bypass Project
(3SProspect, 20206). This study referenced the maximum tidal range for the Labasa River, which
based on the reading from the Labasa Civic Centre Gauge. The maximum tidal range was found
to be up to 1.8 m above sea level (ASL).
3.4 Storm surges
Extreme sea levels were estimated for Fiji by McInnes et al (2000) 7, which included statistical
analysis and modelling to estimate cyclone-induced storm surges for a range of return periods
without wave effects. Table 3-1 shows the estimated extreme sea levels. Whilst not specifically
stated, this is assumed to be reported to a mean sea level datum (ASL).
Table 3-1: Extreme sea levels at Labasa (McInnes et al 2014)
Return period Level
20-year 0.91
50-year 1.16
100-year 1.32
200-year 1.46
500-year 1.60
1000-year 1.68
6 3SProspect (2020) 1D-2D Flood modelling for the Labasa By Pass Project. Prepared for Fiji Roads Authority, Revision 1 – Date-
27/07/2020 by K. Wyborn.
7 McInnes K., Walsh K., Hoeke R., O'Grady J., Colberg F., Hubbert G. (2000) Quantifying storm tide risk in Fiji due to climate variability
and change. CAWCR Centre for Australian Weather and Climate Research, CSIRO Marine and Atmospheric Research, Aspendale
3195, Australia
5. Historic Flood Report 74 Flood modelling
Watershed mapping, rainfall analysis and flood modelling was undertaken to produce historic flood
maps.
4.1 Watershed mapping
Catchment analysis and hydrological modelling was undertaken to understand how runoff flows
through the catchment. Catchment delineation has been undertaken using the SRTM 1 second
(~30m grid resolution). It was used to determine the Soasoa catchment, which was split into 18
discrete watersheds. All subcatchments were analysed to identify key statistics, including hill slope,
catchment slope, flow route, stream network, gradient and catchment area. The drainage basin
area was found to be 17.5 km2, with steep upper regions with a hill slope gradient of 0.24, and a flat
lower channel with a 0.12 gradient.
Table 4-1: Sub-catchment parameters
Number of sub- Maximum sub-catchment Minimum sub- Average sub-catchment
catchments area (ha) catchment area (ha) area (ha)
18 212 48 102
Figure 4-1: Soasoa subcatchment delineation
4.2 Design rainfall estimation
A frequency analysis was applied to the 50 years of annual maximum daily rainfall provided by Fiji
Met, which was used to estimate design rainfall for the standard return periods. The design rainfall
was obtained based on the Annual Maxima Series, using the Generalised Extreme Value (GEV)
fitted by probability weighted moments (see Figure 4-2). A summary of the design maximum daily
rainfall for a range of return periods are provided in Table 4-2. For design flood modelling, temporal
patterns have been based on TC Keni, which produced a worst flooding in the catchment.
5. Historic Flood Report 8Figure 4-2: GEV L-Moments analysis of historical annual maxima series at Labasa AWS
Table 4-2: Extreme daily rainfall estimates at Labasa AWS
Design event (year ARI) Design daily rainfall (mm)
1 63.9
5 162.2
10 198.9
50 290.8
100 321.4
200 382.1
500 450.2
4.3 Historic rainfall analysis
Historical flood mapping was undertaken for events where hourly rainfall records were provided by
Fiji Met (which spanned 2016 to 2020). The two most significant events selected within this data
set were TC Victor (2016) and TC Keni (2018). Their daily rainfall totals were compared against
the design return periods shown in Table 4-2 to estimate their magnitude in terms of Average Return
Interval (ARI):
• 2016 (TC Victor) - 170 mm maximum daily rainfall: ~5 year ARI
• 2018 (TC Keni) - 226 mm maximum daily rainfall: ~20 year ARI
Rainfall hyetographs for these events are shown in Figure 4-3.
5. Historic Flood Report 9Figure 4-3: Rainfall hyetographs for TC Victor (left) and TC Keni (right)
4.4 Flood modelling
The TUFLOW hydrodynamic software was used to develop a two-dimensional (2D) hydraulic model
over the full study area. This was as an appropriate approach due to the absence of detail
topographic data to model 1D channels. TUFLOW is an industry-standard flood modelling platform,
which was selected for this assessment. The model was developed and ran using TUFLOW 2018-
03-AE-iDP-w64 version and TUFLOW “Classic” computation scheme were selected for the study.
4.4.1 Configuration of Hydraulic Model
4.4.1.1 Spatial configuration and grid cell size
The model covers an area of 18.8 km2 of the catchment. The downstream boundary has been
established at the outlet of Qawa River, where flood infrastructure has been observed (See Figure
2-5). The 2D modelling domain has a 10m grid resolution (i.e. it uses 10m x 10m cells), which
reflects the catchment topography, with overland flow roughness based on land use. Watercourses
were represented in model domain using lowered grid cells connecting lowest ground elevations
along the watercourse. The model domain is shown in Figure 4-4.
Figure 4-4: TUFLOW model configuration
5. Historic Flood Report 104.4.1.2 Model Topography
The digital terrain model is based on the global SRTM data (see Section 3.2). The topography
ranges from 540m in the north of the model domain, to approximately 1m to the south west of the
site near the downstream boundary. The town levee was defined using breaklines, which was cut
from the SRTM as a raised levee.
4.4.1.3 Surface Hydraulic Roughness
All parts of the study area within the TUFLOW model were assigned hydraulic roughness
(Manning’s n) values in the TUFLOW material file according to the river form, floodplain land use
and ground cover. Model roughness was defined using the Fiji spatial dataset obtained from
PCRAFI. The adopted Manning’s n values are based on widely-used parameters from literature
(Chow, 1959),which are shown in Figure 4-5 and summarised in Table 4-3.
Table 4-3. TUFLOW model hydraulic roughness values
Material Manning n value
River channel, watercourse, ocean bed 0.025-0.035
Floodplain 0.035
Light vegetation 0.06
Medium density vegetation 0.08
Heavy vegetation and mangroves 0.12
Grass areas 0.03
Buildings 1
Figure 4-5: TUFLOW land use
5. Historic Flood Report 114.4.2 Model Boundaries
4.4.2.1 Inflow Hydrographs
A rainfall hyetograph was applied for each sub-catchment area for historical (2016 and 2018) and
design (100-year ARI) rainfall events. Knowing the sub-catchment area, initial and continuous
losses values, the inflow hydrograph was estimated for each river branches in the Soasoa
catchment area using TUFLOW model. The initial loss (IL) was estimated based on the empirical
relationship between the initial loss and potential maximum retention (S) developed by Soil
Conservation Service (SCS). The maximum retention is related to the curve number, CN. The CN
for a watershed can be estimated as a function of land use, soil type, and antecedent watershed
moisture, using tables published by the SCS. The CN value in this study was defined based on the
recent flood modelling study for Labasa (3SProspect, 2020) as 81.5. The zero continuing loss was
considered as a most conservative scenario.
4.4.2.2 Outflow Boundaries
The Labasa River is tidal up to 3 km inland (3SProspect, 2020). The Nababuabua Creek outlet is
located in 1.4 km distance from the Labasa River, therefore, it is a logical to state similar to Labasa
River. The downstream boundary of Nababuabua Creek is believed to be controlled by the flood
infrastructure observed in Figure 2-5. This will influence the downstream flood levels, and is
important for flood mapping. Detailed structure information has been requested for use in this
project, however was not provided. Should this information be made available it is recommended
to be incorporated into the flood model.
Given the conflicting information on tidal range (up to 1.8m ASL - see Section 3.3), extreme sea
levels (up to 1.68m ASL for a 1000-year event - see Section 3.4) and the unknown influence of this
flood infrastructure, a constant downstream sea level of 2m has been applied as a conservative
estimate.
4.5 Historical flood results and mapping
Figure 4-6 and Figure 4-7 show flood mapping for the historical TC Victor (2016) and TC Keni (2018)
events. Full details are shown in Appendix A, which includes information on depth, water level and
velocity.
Due to limited historical data and images of flood extent, the model calibration for the two historical
events was not possible. As discussed throughout this report, flood levels will be influenced by the
flood infrastructure observed within the bottom of the catchment, which could not be incorporated
within the model due to a lack of data. Should this information be made available it is recommended
to be added into the flood model.
The flood extent for the two historical events shows that the lower reaches of the Nababuabua
Creek are more vulnerable to flooding. Flooding in this area can inundate transport links,
government assets and private properties. The upper reaches of the catchment are less prone to
flooding, however given the high velocities may be prone to scour and erosion (see Appendix A).
5. Historic Flood Report 12Figure 4-6: Flood depth in 2016 event (TC Victor) Figure 4-7: Flood depth in 2018 event (TC Keni) 5. Historic Flood Report 13
5     Discussion
      This historic mapping report for the Soasoa catchment, Fiji, has been undertaken by JBPacific, in
      conjunction with Eco Pasifika Consulting, on behalf of The Pacific Community (SPC).
      In order to enhance the resilience of vulnerable coastal communities in Fiji to climate change and
      natural hazards, a new flood study was carried out in Soasoa catchment, Macuata Province. The
      historic flood mapping can be used to plan new drainage improvements and catchment
      management actions.
      Historic flood mapping has been undertaken for the historical TC Victor (2016) and TC Keni (2018)
      events. The mapping shows that the lower reaches of the catchment are more vulnerable to
      flooding than the upper reaches, which can inundate transport links, government assets and private
      properties. The upper reaches of the catchment are more prone to scour and erosion due to high
      velocities areas.

5.1   Limitations
      Due to limited historical data and images of flood extent, model calibration was not possible. Flood
      mapping has been based on 30m SRTM elevation data only. No detailed survey was provided for
      the catchment. During site inspections flood infrastructure was identified in the lower catchment
      which is believed to influence tides, coastal surges, and flood levels. However, no information could
      be provided for the structures, and they could not be incorporated into the model. Uncertainty exists
      within the downstream tide and storm surge levels, with different sources quoting a range of levels.
      Uncertainty within the Local Vertical Elevation Datum, which will influence sea level estimates and
      coastal flood extents.

       5. Historic Flood Report                                                                        14
Offices in Australia Cambodia Ireland Romania Singapore UK USA Registered Office 477 Boundary Street, Spring Hill QLD 4000 Australia t: +61 (0)7 3085 7470 e:info@jbpacific.com.au JBA Pacific Scientists and Engineers Pty Ltd 2021 ABN: 56 610 411 508 ACN: 610 411 508 Visit our website www.jbpacific.com.au
You can also read