Journal of Applicable Chemistry
←
→
Page content transcription
If your browser does not render page correctly, please read the page content below
Available online at www.joac.info
ISSN: 2278-1862
Journal of Applicable Chemistry
2018, 7 (5): 1238-1251
(International Peer Reviewed Journal)
Biosorption of Cu(II) from Aqueous Solution by
Gokarna Leaves Powder as a Low Cost Adsorbent
Dipali Mahajan and Nilima Rajurkar*
Department of Chemistry, Savitribai Phule Pune University, Pune-411007, INDIA
Email: Mahajan.dips@gmail.com, rajurkar@unipune.ac.in
Accepted on 28th June, 2018
__________________________________________________________________________________________
ABSTRACT
Adsorption capacity of Cu(II) ions onto acid treated gokarna leaves powder was investigated using
batch adsorption method by optimizing various parameters like pH, contact time, adsorbent dosage,
particle size, concentration and temperature. The biosorbent was characterized before and after
adsorption by SEM, EDX, FTIR, DLS, CHNS and BET. Thermodynamic studies revealed that the
adsorption process has been found to be exothermic in nature. The Langmuir, Freundlich, Temkin, D-
R and Jovanoic isotherms were used to describe the adsorption equilibrium studies of acid treated
gokarna leaves powder at different concentrations. D-R isotherm shows better fit than Langmuir,
Freundlich, Temkin and Jovanoic isotherm in the concentration range studied. Experimental data
were analyzed in terms of three kinetic models such as pseudo 1st order, pseudo 2nd order and
intraparticle diffusion model and the result showed that the biosorption process of Cu (II) followed
well pseudo 2nd order kinetics. Desorption studies show Treated gokarna leaves powder (TGLP)
possesses an excellent reusability.
Graphical Abstract
Highlights:
Maximum removal (95.52%) of copper ions (0.01M) was observed at pH 5, contact time 90 min,
adsorbent dosage 0.5g and particle size 105 μm.
1238Nilima Rajurkar et al Journal of Applicable Chemistry, 2018, 7 (5):1238-1251
SEM, EDX and FTIR studies clearly indicated adsorption on cu(II) ions on ATGLP
Adsorption kinetics followed pseudo 2nd order rate equation.
Adsorption of Cu(II) ions follows D – R and Freundlich isotherm
Adsorption process was found to be spontaneous and thermodynamically favorable
The acid treated gokarna leaves powder have been easily recovered
Keywords: Adsorption, Desorption, Gokarna leaves, Isotherms, Kinetics, Thermodynamics.
__________________________________________________________________________________
INTRODUCTION
Disposal of industrial waste water is one of the most pressing problems in the world, because such
effluents usually contain considerable amount of heavy metal ions such as Cu(II), Ni(II), Co(II),
Cd(II), Cr(VI), Pb(II) and Hg(II) [1-3]. These heavy metals are highly toxic and can damage the
aquatic environment and human beings. Hence the removal and recovery of these metals from waste
water streams is important. Copper is one of the most widely used heavy metals. It is mainly
employed in electrical, smelting, mining, metal plating, electroplating, pigment and metallurgical
industries in large amount, Cu is toxic to living organisms. Water polluted with Cu (II) ions affect the
human health and leads to anaemia, it also affects liver, kidney, pancreas, stomach, myocardium,
dizziness, diarrhea and causes intestinal irritation, neurotoxicity and Wilson’s disease [4]. Therefore,
there is a growing need for the development of new innovative and cost effective methods for removal
of heavy metal ions. A number of techniques are being used for the removal of metal ions from
aqueous solutions such as chemical precipitation, evaporation, ion exchange, solvent extraction,
electrolysis, reverse osmosis and membrane filtration which are expensive and non-environmental
friendly as compared to adsorption [5]. Adsorption is considered to be one of the most suitable, easy
handling, cost effective with availability of different adsorbents. Recently, many researchers have
used low cost adsorbents from agricultural waste materials for removing heavy metal ions. Plant
leaves and agriculture by-products are among the adsorbents that have been widely applied for
removing heavy metal ions and other pollutants; these include leaves of maize leaf [6], neem leaves
[7], solanum tuberosum [8], imperata cylindrica leaf [9], mango leaf [10], soyabean hulls [11],
Chitosan [12], chestnut shell [13], spent mushroom [14], opuntia biomass [15], Spirodela polyrhiza
[16], mixed waste activated carbon [17], Couroupita guianensis[18], Hibiscus cannabinnus kenaf
[19], sugaecane baggase [20], eucalyptus seeds [21], Neurospora crass [22], Sacchromyces cerevisiae
[23], dried cactus [24], Biochar herb residue [25] and C. Camphora [26]. In the present investigation,
we have used acid treated gokarna powder for the removal of Cu(II) ions from its aqueous solution.
The biosorbent was characterized by Fourier transform infrared (FTIR), SEM with Energy dispersive
X-ray (EDX), Brunauer- Emmett- Teller (BET), Carbon, Hydrogen and Nitrogen (CHN) and
Dynamic light scattering (DLS) analysis. The influence of operating parameter such as pH, adsorbent
dose, contact time, particle size, concentration and temperature on the biosorption of Cu(II) onto
TGLP was investigated.
MATERIALS AND METHODS
Preparation and activation of the adsorbent: The leaves of gokarna were collected from home
garden. These waste materials were washed with double distilled water to remove dusts and
impurities. Initially leaves are kept for drying at room temperature for 6h and then in an oven at 80°C
till they turn dark grey. Then they were pulverized and passed through mesh screens. The dried
material was subjected for acid treatment (ratio 1:1) and kept at room temperature overnight. The
treated leaves were washed with double distilled water to remove free acid. Finally, the adsorbent was
dried at 100°C for 5h. The dried TGLP was then stored in a desiccator for further studies.
www. joac.info 1239Nilima Rajurkar et al Journal of Applicable Chemistry, 2018, 7 (5):1238-1251
Chemicals: All the chemicals like copper sulphate, Sulphuric acid, orthophosphoric acid and sodium
hydroxide were of analytical grade. The aqueous solutions were prepared in distilled water.
Characterization of adsorbent: TGLP was characterized before and after adsorption using different
techniques. Surface morphology of the adsorbent was studied using scanning electron microscopy
(FET Nova nano SEM-450) EDX was used for quantitative determination of the elements present in
the sample. The Fourier transforms IR (FTIR) spectra of the samples were recorded using a
spectrophotometer (Shimadzu 8400) in the range of 4000-400 cm-1 using KBr disk for reference.
Determination of surface area, average pore size and pore volume was performed using a BET surface
analyzer model Auto IQ-2 (Quantachrome instruments), while carbon, hydrogen and nitrogen content
was determined using a CHN analyser (Thermofinnigan instrument). Determinations of particle size,
polydispersity and diffusion coefficient were performed using a DLS (Brookhaven).
Adsorption Experiment: In order to get effective removal of metal ions, various parameters viz; pH,
contact time, adsorbent dosage, particle size and concentration were optimized. For each experiment,
25mL of metal ions solution of known concentration was introduced in a 100 mL round bottom flask.
The pH of the solution was adjusted using 0.01M NaOH and 0.01M H2SO4. Solution was
continuously stirred on magnetic stirrer, and after specific time it was centrifuged and supernatant
solution was filtered and analyzed.
The concentration of copper ions in aqueous solutions was determined by UV-Visible
spectrophotometer. The percentage adsorption was determined using the following equation:
–
% = × 100 (1)
The adsorption capacity of the adsorbent was evaluated by using the following equation:
= × (2)
Where, qe is the amount of metal ions adsorbed by TGLP (g g-1); Co is the initial metal ions
concentration in contact with TGLP (g L-1); Ce is the final metal ions concentration in aqueous
solution (g L-1) after adsorption; m is the mass of the adsorbent (g) and V is the volume of metal ions
solutions (L).
Desorption of metal ions: TGLP loaded with copper ions at optimized conditions were treated with
various volumes (4-20 mL) of 0.1M HNO3 with contact time 60 min. Concentration of desorbed metal
ions was measured by UV- Visible spectrophotometer. % Recovery of metal ions calculated using the
following equation:
% = × 100 (3)
Where, Cd is amount of metal desorbed (g L-1) and Ca is amount of metal adsorbed (g L-1).
RESULTS AND DISCUSSION
The proximate analysis of the raw materials and the physicochemical properties of the prepared TGLP
were determined by standard methods (Table 1).
Adsorption studies:
Effect of pH: pH of the solution was varied between 3 to 7 and the results are shown in figure 1. The
% removal of Cu(II) increases with pH and then decreases as observed from figure 1 . This is
www. joac.info 1240Nilima Rajurkar et al Journal of Applicable Chemistry, 2018, 7 (5):1238-1251
attributed to the competition of hydrogen ions with Cu(II) ions for active sites on the adsorbent
surface. Increase in deprotonation results in the increase of negatively charged sites which enhanced
attractive force between surface of adsorbent and copper ions resulting into higher adsorption
capacity. Further decrease in adsorption capacity was due to the formation of precipitate of copper
ions at higher pH.
Table 1. Characterization of adsorbents
S. No. Properties Values
Proximate analysis
1 Density (g cm3 ) 0.4406
2 pH 4.58
3 Moisture content (%) 6.95
4 Ash content (%) 3.92
5 Volatile matter (%) 68.72
6 Fixed carbon (%) 20.41
Physico-chemical properties
1 BET Surface area (m2 g-1) 4.13
2 Total pore volume (cm3 g-1 ) 1.32 10-2
3 Average pore Diameter (A 5.84 102
CHN Analysis
1 Carbon (%) 75.48
2 Hydrogen (%) 2.35
3 Nitrogen (%) 4.40
Effect of Contact time: The effect of contact time for adsorption of copper ions was studied by
varying the time between 10 to 120 min (Figure 2). As contact time increased, efficiency of removal
also increased (Figure2). The adsorption rate was rapid at the beginning of the adsorption process, and
then the rate became constant after the equilibrium time. The saturation point is nearly reached at 90
min, at this point the metal ions amount being adsorbed onto the materials is in a state of dynamic
equilibrium with the metal ions amount desorbed from the adsorbent.
90 100
4 .6
90
4 .4
80
4 .2 80
% Removal
4 .0
% Removal
70
70
3 .8
qe
60
3 .6
50
60 3 .4
% R em oval
qe 40
3 .2
50 3 .0 30
2 3 4 5 6 0 20 40 60 80 100 120
pH C o n ta c t tim e ( m in )
Figure 1. Effect of pH on copper adsorption onto TGLP. Figure 2. Effect of contact time on copper adsorption onto
TGLP.
Experimental conditions: Contact time: 60 min, adsorbent Experimental conditions: pH: 5, adsorbent dosage: 0.5 g,
dosage: 0.5 g, particle size: 250 µm, concentration: 0.01 M. particle size: 250 µm, concentration: 0.01 M.
Effect of Adsorbent dosage: Adsorbent dose has a large influence in adsorption process and it
determines the potential of biosorbent during the number of binding sites accessible to remove metal
ions at a specified initial concentration. Adsorbent dosage varied in to range of 0.1-0.6 g. As can be
seen from this figure, the percent removal of Cu(II) increased with an increasing adsorbent dosage
(Figure 3). It can be explained as on increasing the adsorbent dose, the active sites available for
sorption of Cu(II) ions also increase and as a result more sorption take place. However, the adsorption
capacity showed an opposite trend. As the adsorbent dosage was increased from 0.1 to 0.6 g, the
adsorption capacity reduced to 4.9 to 3.8 (g g-1) respectively. The decrease in adsorption capacity is
basically due to sites remaining unsaturated during the adsorption process.
www. joac.info 1241Nilima Rajurkar et al Journal of Applicable Chemistry, 2018, 7 (5):1238-1251
Effect of Particle size: Surface area of the adsorbent is an important parameter for adsorption. The
effect of particle size on the percentage removal of metal ions is shown in figure 4. This figure
indicates that the percentage removal of metal ions decreased with the increase in particle size. As the
particle size is smaller, the surface area per unit weight of adsorbent is larger and consequently the
higher percentage of metal ions removal is noted.
90 5 .0
90
4 .8
85
80
4 .6 80
% Removal
75
% Removal
4 .4
70
q
70
e
4 .2
65
60 4 .0 60
% R em ova l
q 55
e 3 .8
50 50
0 .1 0 .2 0 .3 0 .4 0 .5 0 .6 0 -1 0 5 1 0 5-25 0 2 5 0-42 0 4 2 0 -6 1 0 6 1 0 -7 0 0
A d s o r b e n t d o se (g m ) P a r tic le S iz e
Figure 3. Effect of adsorbent dosage on copper adsorption Figure 4. Effect of particle size (µm) on copper
onto TGLP. adsorption onto TGLP.
Experimental conditions: pH: 5, contact time: 90 min, particle Experimental conditions: pH: 5, contact time: 90 min,
size: 250 µm, concentration: 0.01 M. adsorbent dosage: 0.5 g, concentration: 0.01 M
Effect of Concentration: The concentration of metal ions plays an important role in the adsorption
capacity. The effect of concentration on the adsorption of copper ions has been studied over the range
of 0.002 to 0.01M at 25°C and the results are shown in figure 5. It was observed that the % removal of
metal ions decreased with increasing concentration. The metal ions concentration provides the
necessary driving force to overcome the resistance of mass transfer from the aqueous phase to the
solid phase. The increase in concentration also enhances the interaction between copper ions and
treated gokarna leaf powder. The adsorption capacity increased from 9.2 to 8.1 g g-1 by increasing the
metal ion concentration from 0.002 to 0.01M. This could be because of the split in the flux or the
concentration gradient between solute concentration in the solution and the solute concentration on
the surface of the adsorbent.
94 2 .0 100
92 1 .8
80
90 1 .6
60
88
% Removal
% Removal
1 .4
e
86 40
q
1 .2
84
1 .0 20
82
0 .8
80 0
0 .6
0 .0 0 2 0 .0 0 4 0 .0 0 6 0 .0 0 8 0 .0 1 0 30 40 50 60 70 80 90
C o n c e n tr a t i o n ( M o la r ) T em p r ea t u re
Figure 5. Effect of concentration on copper adsorption onto Figure 6. Effect of Temperature (°C) on copper adsorption
TGLP onto TGLP
Experimental conditions: pH: 5, contact time: 90 min, Experimental conditions: Under optimized parameters
adsorbent dosage: 0.5 g, particle size: 105 µm.
Effect of Temperature: The adsorption of Cu (II) ions was studied at different temperatures (30-
90°C) under optimized conditions. The adsorption efficiency was found to increase with increase in
temperature as shown in figure 6. This may be due to the generation of new adsorption sites on the
surface of the adsorbent and also increased rate of diffusion of the adsorbent which leads to the
increased adsorption
www. joac.info 1242Nilima Rajurkar et al Journal of Applicable Chemistry, 2018, 7 (5):1238-1251
Fe-SEM studies: The morphological and structural characteristics of TGLP were studied using field
emission scanning electron microscope. The micrographs of the virgin and metal ions loaded chitosan
are shown in figure 7.
Figure 7. Scanning electron microscope image of (a) Virgin TGLP, (b) TGLP loaded with Cu(II) ions and
(c) after desorption of 0.01M Cu(II).
It can be seen that the porosity and surface structure of the virgin TGLP changes after loading with
metal ions. The number of available sites decreased after adsorption.
EDX studies: The EDX spectra of the TGLP and TGLP loaded with metal ions are shown in figure 8.
The EDX spectrum of TGLP clearly shows presence of Cu (II) ions after adsorption.
Figure 8. Energy dispersive spectrum of (a) Virgin TGLP, (b) TGLP loaded with Cu(II) ions.
FTIR Studies: The FTIR spectrum of acid treated gokarna leaves powder display a number of
absorption peaks indicating the presence of different types of functional groups in the adsorbent
(Figure 9) the broad and strong peak ranging from 3000-3600 cm-1 represents overlapping hydroxyl
and amine stretching vibrations, which is consistent with the peaks at 1059 cm-1 assigned to C–O and
C-N stretching vibration. The peaks at 2936 cm-1 are assigned to asymmetric and symmetric CH2
groups. The peak at 1626 cm-1 could be assigned to carboxylate and imine groups. The peaks in the
region 1400-1600 cm-1 could be assigned to aromatic skeleton vibration and the peaks around 1150-
1250 cm-1 correspond to phenolic hydroxyl groups in lignin. The peaks observed in the region of 1049
are assigned to acetal groups. Peaks with wave numbers less than 1000 cm-1 indicate the presence of
phosphate and sulphate groups. Some distinct changes in the spectrum can be noted after copper
adsorption. The peak at 3368 cm-1 shifted to 3342 cm-1 , which suggests chemical interaction between
copper ions and –OH and –NH groups. The carboxylate group was also involved in copper adsorption
as the wavenumber shifted from 1618 cm-1. The peak of acetal group shifted from 1049 cm-1 for
copper loaded adsorbent. The peak for phosphate group represented by the wavenumber at 963 cm-1
disappeared after copper adsorption. Therefore, the FTIR study reveals that different types of
functional groups were involved in the binding of copper ions, including hydroxyl, carboxyl, amino,
ether, phenolic and phosphate.
www. joac.info 1243Nilima Rajurkar et al Journal of Applicable Chemistry, 2018, 7 (5):1238-1251
C u (I I )
786 1445
575 2352
% Transmittance
459 1618 3342
2921
1049
V ir g i n A T G L P
605 804
2373
471 1381
2936 3368
1626
1059
0 500 1000 1500 2000 2500 3000 3500 4000 4500
w a v e n u m b e r (c m - 1 )
Figure 9. Spectrum of virgin TGLP and TGLP loaded with Cu(II) ions.
DLS Studies: Dynamic light scattering method is widely used for the determination of particle size.
The TGLP particle size was found to be 20603.57 nm (polydispersity 0.410 and Diffusion coefficient
20382X10-9 cm2 s-1) in methanol solvent while TGLP loaded with copper ion particle size was found
to be 1363.36 nm (polydispersity 0.286 and Diffusion coefficient 3.592X10⁻⁹ cm2 s-1 ). The change in
particle size may be due to the presence of acetal and imine group and to strong interaction between
the anionic group of hydroxyl, carboxyl, amino, phenolic and phosphate group of TGLP and cationic
group of copper ions.
Thermodynamic study for adsorption: The values of thermodynamic parameters like free energy
change (G°), enthalpy change (H°) and entropy change ( S°) of the adsorption process were
calculated by following equation:
∆ ° ∆ °
ln = × + (4)
∆ °= ∆ °+ ∆ ° (5)
Where K, R and T are the equilibrium constant.
The Van’t Hoff plot is presented in figure 10. The plot of ln K versus 1/T was found to be linear
H° and S° are calculated from slope and intercept, respectively.
Figure 10. Thermodynamics study for adsorption of Cu(II) ions onto TGLP.
The thermodynamic parameters studied at different temperature are listed in table 2. As seen from
this table, the positive values of G° confirming the non- spontaneous nature of the adsorption. The
positive values of H° imply that the interaction between the metal ions and adsorbent is endothermic
in nature; while the positive values of S° specify the amplified randomness throughout the sorption
process.
www. joac.info 1244Nilima Rajurkar et al Journal of Applicable Chemistry, 2018, 7 (5):1238-1251
Table 2. Estimated values of G°, H° and S° for adsorption of Cu(II) on
acid treated gokarna leaves powder at different temperature.
Element G° (kJ (mol K)-1 H°(kJ mol-1) S° (kJ (mol K)-1
303 K 313 K 323 K 333 K 343 K 353 K 363 K
Cu(II) 14.56 12.92 11.28 9.648 8.012 6.376 4.739 64.134 163.62
Adsorption Kinetics: To inspect the mechanism of adsorption process, characteristic constant of
adsorption such as mass transfer and chemical reaction, were determined by using a pseudo 1st order,
pseudo 2nd order and intraparticle diffusion model.
Pseudo 1st order kinetics: A linear form of pseudo 1st order model is:
log( − ) = log − (6)
.
Where qe is the amount of metal ions adsorbed at equilibrium (g g-1); qt is the amount of metal ions
adsorbed at time t (g g-1); k1 is the rate constant of pseudo first order kinetics (min-1). The equation is
known as the Lagergren equation. The rate constant k1 was calculated from the linear plot of log (qe-
qt) versus time (Figure 11). The R2 values are very less suggesting that the biosorption of Cu (II) ions
does not follow pseudo 1st order kinetic model.
Pseudo 2nd order kinetics: A linear form of pseudo 2nd order model is as follows:
1 1
= + (7)
Where k2 is the rate constant of pseudo second order kinetics (g. mg-1.min-1); qe is the amount of metal
ions adsorbed at equilibrium (g g-1) qt is the amount of metal ions adsorbed at time t (g g-1) k2 and qe
can be determined from the slope and intercept of the plot t/qt versus time (Figure 12) respectively.
Figure 11. Lagergren plot for removal of copper ions onto Figure 12. Pseudo 2nd order plot for removal of copper
TGLP. ions onto TGLP.
Intraparticle diffusion model: This model describes about the diffusion of the adsorbate from the
outer surface into the pores of TGLP. The Intraparticle diffusion equation is given by
.
= + (8)
Where kid is the particle diffusion rate constant in g.mg-1.min-1; and c is the intercept. A plot of qt
versus t0.5 (Figure 13) gives the value of kid.
www. joac.info 1245Nilima Rajurkar et al Journal of Applicable Chemistry, 2018, 7 (5):1238-1251
Table 3. The parameters of the kinetic constants obtained for Cu(II) ions onto TGLP.
Kinetic Models
Pseudo 1st order Pseudo 2nd order Intraparticle Diffusion
Metal
K1 qe qe kid
R2 K 2 (g mg-1. min-1) R 2
R2
(min-1 ) (g g-1) (g g-1 ) (g mg-1 min-1)
Cu(II) 0.025 0.00043 0.876 8.389 0.00054 0.953 0.517 0.859
The values of R2 for the pseudo 2nd order model were higher than those of the pseudo 1st order and
intraparticle diffusion model. The pseudo 2nd order kinetic model suggests that the rate limiting step of
the biosorption is probably controlled by chemisorption (Table 3).
Adsorption Isotherm: The adsorption isotherms of copper ions were fitted using different isotherm
models; Langmuir isotherm, Freundlich isotherm, temkin isotherm, Javaonic Isotherm and D-R
isotherm.
Langmuir Isotherm: Langmuir Isotherm represents the equilibrium distribution of metal ions
between solid and liquid phase. The linear Langmuir isotherm allows the calculation of adsorption
capacity and Langmuir constant by the following equation
= +( ) (9)
Where qe the amount of adsorbate adsorbed per unit mass of TGLP (g g-1), b the constant related to
the affinity of the binding sites (L g-1), q max the maximum amount of metal ion per unit of TGLP
(g g-1), and Ce the adsorbed metal concentration at equilibrium. Therefore, the plot of 1/qe against
1/Ce (Figure 14) gives a straight line with a slope of 1/ and an intercept of 1/b.
Figure 13. Intraparticle diffusion plot for removal of copper Figure 14. Langmuir Isotherms for removal of Cu(II)
ions onto TGLP. ions onto TGLP.
Freundlich Isotherm: The Freundlich isotherm equation is used for the depiction of multilayer with
the contact stuck between adsorbed molecules. The linear form of Freundlich isotherm model is given
by the equation
log = log + log (10)
Where qe the amount of adsorbed per unit weight (g g-1); K the Freundlich constant; n the Freundlich
constant related to adsorption intensity. Freundlich constants, n and K can determined from linear plot
of log qe versus log Ce (Figure15). The values of n were found to be below unity (Table 4) implies
chemisorption process.
www. joac.info 1246Nilima Rajurkar et al Journal of Applicable Chemistry, 2018, 7 (5):1238-1251
Table 4. Equilibrium parameters for adsorption of Cu(II) ions onto TGLP
Adsorption isotherms Constants Value
Langmuir Isotherm 0.113
(g g-1)
q(max) (L g-1) 50.25
R2 0.923
Freundlich Isotherm K 158.49
N 0.4912
R2 0.975
Temkin Isotherm B 6.078
A 1.497
R2 0.975
D – R Isotherm Q DR (mol g-1) 0.173
0.029
E (kJ mol-1) 4.153
R2 0.980
Jovanoic isotherm qm (g g-1) -7.952
KJ 1.619
R2 0.930
D–R Isotherm: The D-R isotherm equation, distinguish between physical and chemical adsorption.
The linearized form of D-R isotherm model is given by the following equation
ln = ln − (11)
Where qe the amount of adsorbed per unit weight (g g-1), Ce the equilibrium metal ion concentration
(g L-1 ), QDR the maximum adsorption capacity (mol g-1), the activity coefficient of mean free
energy, the Polanyi potential. The value of was calculated from the equation
= ln(1 + ) (12)
A linearized plot of ln qe versus 2 enable to determine the values of and QDR from the slope
and intercept (Figure 16). From the value of activity coefficient, biosorption mean free energy E (kJ
mol-1) is determined as follows
= 1/√(−2 ) (13)
-1
Where E is the mean adsorption energy (kJ mol ) and is the Dubinin-Radushkevich constant. The
calculated D-R constants and mean free energy for adsorption are shown in table 4. The value of
mean free energy E calculated from D-R isotherm model was 4.513 kJ mol-1. If the value of E lies
between 8-16 kJ mol-1 the process is said to follow chemical ion exchange while E< 8kJ mol-1 then the
process follows physical adsorption. In the current study the biosorption process of Cu(II) ions onto
acid treated gokarna leaves powder follows physical adsorption.
Temkin Isotherm: Temkin isotherm based on the heat of adsorption of all the molecules in the layer
decreases linearly with coverage due to adsorbent-adsorbate interactions and characterized by a
uniform distribution of binding energies up to some maximum binding energy can be represented in a
linear form as follows:
= + (14)
www. joac.info 1247Nilima Rajurkar et al Journal of Applicable Chemistry, 2018, 7 (5):1238-1251
Figure 15. Freundlich isotherms for removal of Cu(II) Figure 16. Dubinin-Radushkevich isotherms for removal
ions onto TGLP. of Cu(II) ions onto TGLP.
B = RT/b (15)
Where qe the amount of adsorbed per unit weight (g g-1); Ce the equilibrium metal ion concentration
(g L-1); A the Temkin isotherm constant and b the constant related to heat of sorption. The A and B
can be calculated from the intercept and slope of the linear plot of against ln Ce (Figure 17).
Jovanoic Isotherm: The Jovanoic isotherm which is based on the same assumptions of the Langmuir
isotherm also considers the possibility of some mechanical contacts between the adsorbing and
desorbing molecules on the homogeneous surface and can be represented in a linear form as follows:
(16)
Where qe the amount of adsorbed per unit weight (g g-1); Ce the equilibrium metal ion concentration
(g L-1); qm is the maximum amount adsorbed (g g-1); KJ is the constant related to the energy of
adsorption. The qm and KJ can be calculated from the intercept and slope of the linear plot of
against Ce (Figure 18).
Figure 17. Temkin isotherms for removal of Cu(II) Figure 18. Jovanoic isotherms for removal of Cu(II)
ions onto TGLP ions onto TGLP.
The theoretical parameters of isotherms along with regression coefficient are listed in table 4.
According to R2 values in this table, copper biosorption follows the five isotherm models in the order
D-R isotherm > Jovanoic isotherm > Freundlich = Temkin > Langmuir isotherm for acid treated
gokarna leaves powder at the experimental circumstances investigated.
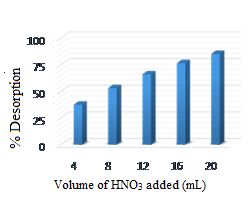
Desorption: Desorption of metal ions (0.01M) loaded on TGLP under optimized conditions was
carried out with 0.1M HNO3 as an eluent. As can be seen from figure 19, the maximum desorption
(85.32%) was observed by using 20 mL of HNO3. The result shows that the disbursed copper ions can
be effectively recovered.
www. joac.info 1248Nilima Rajurkar et al Journal of Applicable Chemistry, 2018, 7 (5):1238-1251
Figure 19. Desorption of Cu(II) ions loaded on TGLP using 0.1M HNO 3.
Comparison of various adsorbents: The obtained results are compared with the literature reports
where in removal of Cu(II) ions was studied using various adsorbents. A comparative data is shown in
table 5.
Table 5. Comparison of adsorption capacity of Cu(II) with various adsorbent.
Adsorbent qmax (mg g-1) Reference
Neurospora crassa 12.30 [22]
Saccharomyces cerevisiae 10.72 [23]
Rubber leaves 14.97 [27]
Neem leaf powder 18.29 [28]
C. camphora leaves powder 17.87 [26]
S. tuberosum leaves powder 42.74 [8]
Gokarna leaves powder 50.25 Current study
An examination of above table reveals that the adsorption capacity of adsorbents used in the
present work for removal of Cu(II) ions is greater than the other adsorbents used by different
researchers. Thus adsorbent used in the present study are promising adsorbents for industrial waste
water treatment.
APPLICATION
Acid treated gokarna leaves powder can be effectively used for the removal of Cu(II) ions from
aqueous solution. The developed method is cost effective, efficient and can be applied to other metals
also.
CONCLUSIONS
Gokarna leaves modified with acid solution demonstrated a satisfactory ability to adsorb copper ions
from aqueous solutions. The optimum conditions for Cu(II) adsorption were: pH 5, contact time
90min, adsorbent dose 0.5g, particle size 105µm concentration 0.002M and temperature 90°C The
thermodynamic study showed that adsorption of copper ions on TGLP was non-spontaneous and
exothermic in nature. The kinetic study revealed that the pseudo 2nd order equation provided the best
correlation, suggesting a chemisorption process. The results obtained from the equilibrium isotherms
adsorption studies of copper ions indicated to be well fitted to the D-R isotherm equation under the
concentration range studied. The results from the present study showed that gokarna leaves powder
may be used as an economical, environmentally friendly and effective adsorbent to remove copper
ions from industrial waste water.
www. joac.info 1249Nilima Rajurkar et al Journal of Applicable Chemistry, 2018, 7 (5):1238-1251
ACKNOWLEDGMENT
One of the authors, Dipali R. Mahajan is thankful to the Department of Science and technology, New
Delhi, India for providing financial assistance under DST Inspire Fellowship programme.
Declaration of interest: The authors declare that they have no competing financial interests.
REFERENCES
[1]. Y. Xie, B. Yan, H. Xu, J. Chen, Q. Liu, Y. Deng, H. Zeng, Highly regenerable mussel-inspired
Fe3 O4 polydapamin-Ag core shell microspheres as catalyst and adsorbent for methylene blue
removal, ACS Appl. Mater. Interfaces, 2014, 6, 8845-8852.
[2]. H. Yan, H. Li, X. Tao, K. Li, H. Yang, A. Li, S. Xiao, R. Cheng, Rapid removal and separation
of iron(II) and manganese(II) from micropolluted water using magnetic grapheme oxide, ACS
Appl. Mater. Interfaces, 2014, 6, 9871-9880.
[3]. E. Unuabonah, C. Gunter, J. Weber, S. Lubahn, A. Taubert, Hybrid clay: A new highly
efficient adsorbent for water treatment, ACS Sustainable Chem. Eng., 2013, 1, 966-97.
[4]. I. Jones, K. Ogden and F. Jia, Comparative study of biosorption of copper(II) by lipid
Extracted and Non Extracted Chlorella Sorokiniana, Clean- Soil Air Water., 2015, 43(1), 73-
78.
[5]. S. Zhang, Y. Zhang, G. Bi, J. Liu, Z. Wang, Q. Xu, H. Xu and X. Li, Mussel-inspired
polydopamine biopolymer decorated with magnetic nanoparticles for multiple pollutants
removal, J. Hazard. Mater., 2014, 270, 27-34.
[6]. N. Babarinde, J. Babalola and R. Sanni, Isotherm and thermodynamic studies of the
biosorption of Cd (II) from solution by maize leaf, Int. J. Phys. Sci., 2002, 2(8), 207-211.
[7]. B. Babu and S. Gupta, Adsorption of Cr (VI) using activated neem leaves: Kinetic studies,
Adsorption., 2008, 14, 85-92.
[8]. M. Moyo, A. Chirinda and T. Nharingo, Removal of copper ions from aqueous solution using
chemically treated potato (Solanum tuberosum) leaf powder, Clean Soil Air Water., 2016,
44(5), 488-495.
[9]. M. Hanfiah, H. Zakaria, and W. Nagh, Preparation, characterization, and adsorption behaviour
of Cu (II) ions onto Alkali treated weed (Imperata cylindrica) leaf powder, Water Air Soil
pollut., 2009, 201, 43-53.
[10]. V. Sethu, K. Goey, F. Iffah, C. Khoo, A. Andresen, Adsorption characteristic of Cu (II) ion in
aqueous solution using mangifera indica leaf biosorbents, Journal of Environment, research
and development, 2010, 5, 262-278.
[11]. N.S. Rajurkar, D. Mahajan, Removal and recovery of copper ions using chitosan as an
adsorbent, J. Applicable chem., 2015, 4(4), 1206-1217.
[12]. K. Guimaraes, L. Gurgel, T. Melo, C. Carvalho, L. Gil, Adsorption studies of etherdiamine
onto modified sugarcane bagasses in aqueous solution, Journal of Environment management,
2014, 133, 332-342.
[13]. Z. Yao, J. Qi, L. Wong, Equilibrium, kinetic and thermodynamic studies on the biosorption of
Cu(II) onto chestnut shell, Journal of Hazardous mater, 2010, 174, 137-143.
[14]. A. Toptas, S. Demieerge, E. Ayan and J. Yanik, Spent mushroom compost as biosorbent for
dye biosorption, Clean, Soil, Air, Water, 2014, 42(12), 1721-1728.
[15]. M. Rosique, J. Angosto, E. Guilbal, M. Roca, J. Fernadez-lopez, Factorial design
methodological approach for enhanced cadmium ions bioremoval by opuntia biomass, Clean,
Soil, Air, Water, 2016, 44(8), 959-966.
[16]. M. Meitei, M. Prasad, Lead (II) and Cadmium (II) biosorption on spirodela polyrhiza (L.)
schleiden biomass, JECE, 2013, 1, 200-207.
[17]. M. Habila, Z. Alothman, R. Ali, A. Ghafar, M. Hassouna, Removal of tartrazine dye onto
mixed waste activated carbon: Kinetic and thermodynamic studies, Clean, Soil, Air, Water.,
2016, 42(12), 1824-1831.
www. joac.info 1250Nilima Rajurkar et al Journal of Applicable Chemistry, 2018, 7 (5):1238-1251
[18]. N. S. Rajurkar, N.S. Walvekar, Removal of methylene blue and indigo carmine from aqueous
solutions using couroupita guianensis leaves as an adsorbent, J. Applicable Chem., 2014, 3(6),
2602-2610.
[19]. Borna, M. Pirsaheb, M. Niri, R. Khosravi, B. Kakavandi, M. Zare, A. Asadi, Batch and
column studies for the adsorption of chromium (VI) on low cost Hibiscus cannabinus kenaf, a
green adsorbent, J. Taiwan institute of chemical engineers, 2016, 1-10.
[20]. I. Aloma, M. Lara, I. Rodriguez, G. Blazquze, M. Calero, Removal of nickel ions from
aqueous solution by biosorption on sugarcane baggase, J. Taiwan institute of chemical
engineers, 2012, 43, 275-281.
[21]. U. Kiruba, P. Kumar, C. Prabhakaran ,V. Aditya, Characteristic of thermodynamic, isotherm,
kinetic, mechanism and design equations for the analysis of adsorption in Cd(II) ions surface
modified eucalyptus seeds system, J. Taiwan institute of chemical engineers, 2014, 45, 2957-
2968.
[22]. I. Kiran, T. Akar and S. Tunali, Biosorption of Pb(II) and Cu(II) ions from aqueous solutions
by pretreated biomass of neurospora crassa, Process biochemistry, 2005, 40, 3550-3558.
[23]. M. Lale, Z. Temocin, H. Bag, Sorption behaviour of copper (II), zinc(II) and Nickel(II) on
formaldehyde crosslinked Sacchromyces cerevisiae immobilized on pumice stone, Fresenius
Enviromental Bulletin, 2005, 10, 736-740.
[24]. N. Barka, M. Abdennouri, M. El makhfouk, S. Qourzal, biosorption characteristic of cadmium
and lead onto eco-friendly dried cactus (Opuntia ficus indica) cladodes, JECE, 2013, 1, 144-
149.
[25]. J. Shang, J. Pi, M. Zong, Y. Wang, W. Li, Chromium removal using magnetic biochar derived
from herb residue, J. Taiwan Inst.Chem.Eng., 2016, 1-6.
[26]. H. Chen, G. Dai, J. Zhao, A. Zhong, J. Wu, H. Yan. Removal of copper ions by biosorbent
Cinnamomum camphora leaves powder, J. Hazard. Mater, 2010, 177,228-236.
[27]. W. S. Nagh, M. A. K. M. Hanafiah, adsorption of copper on rubber leaf powder: Kinetic,
equilibrium and thermodynamic studies, Biochem. Eng. J. 2008, 155, 513-522.
[28]. N. Febrina, S.O. Lesmana, F. E. Soetaredjo, J. Sunarso, S. Ismadji, Neem leaf utilization for
copper ions removal from aqueous solution, J. Taiwan. Inst. Chem. Eng. 2010, 41, 111-114.
www. joac.info 1251You can also read