Chorus Roadshow Presentation - October 2017 - AWS

Page created by Salvador Aguilar
 
CONTINUE READING
Chorus Roadshow Presentation - October 2017 - AWS
Chorus Roadshow Presentation   October 2017
Chorus Roadshow Presentation - October 2017 - AWS
TABLE OF CONTENTS

1.   Introducing Chorus               3-7

2.   A fibre future                   8-13

3.   New Zealand’s Broadband Market   14-23

4.   FY18: What we’re focused on      24-28

5.   Financial Highlights             29-34

6.   Appendices                       35-41

                                              Chorus Investor Roadshow - October 2017
                                                                                        2
Chorus Roadshow Presentation - October 2017 - AWS
NEW ZEALAND
>   Land mass of 268,000 square kilometres
        1,600 kilometres long; 400 kilometres wide

>   NZ population approximately 4.79 million
        ~87% live in urban areas
        100,000 record population growth in FY17
        half of population growth in 15-39 age group

>   Market orientated economy
        real economic growth, as measured by changes in
         Gross Domestic Product, has increased annually
         between 2% to 4% since 1993.
        official cash rate 1.75%
        1Euro = 1.66NZD
        1GBP =1.86NZD

                                                           Chorus Investor Roadshow - October 2017   3
Chorus Roadshow Presentation - October 2017 - AWS
KEY CHORUS HIGHLIGHTS
 Leading provider of fixed line communications infrastructure in N.Z. with significant network build experience

 Cornerstone partner in the Government’s Ultra-Fast Broadband initiative, with UFB capex supported by
 Government financing

 Broadband emerging as 4th utility, supported by growing bandwidth demand and streaming video trends

 Majority of revenues regulated or contracted to the Crown to 2020, with an expected shift to a building
 block regulatory framework thereafter

 Highly competitive retail broadband market driving fibre uptake, supported by population/premises growth

 Commitment to maintaining a BBB credit rating (S&P, or equivalent)

 Experienced management team with proven ability in rolling out and operating fixed line communications
 networks

                                                                  Chorus Investor Roadshow - October 2017         4
Chorus Roadshow Presentation - October 2017 - AWS
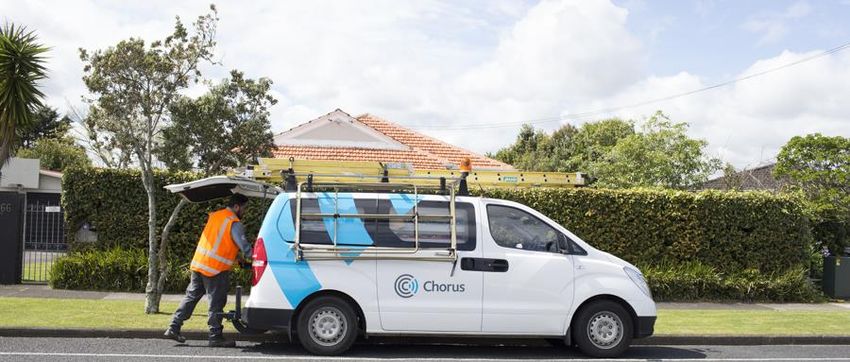
AN OVERVIEW OF CHORUS
             >   New Zealand’s largest fixed line communications infrastructure
                 business
                     established in Dec 2011 following demerger from Telecom NZ
                     listed on NZX and ASX: CNU
                     ~NZ$1.6 billion market capitalisation (at 30 Sept 2017)
                     S&P “BBB” stable; Moody’s “Baa2” stable

             >   A nationwide copper and growing fibre network
                     ~1.58m connections, including ~1.18m broadband
                     halfway through 11-year fibre to the premises rollout
                     streaming video services driving significant data consumption
                     average NZ household consumed 162GB in Sept 2017

             >   ~1,000 employees, 80%+ engagement since 2012
                     supported by ~4,000 contractors and subcontractors
                     first NZ employer to win supreme award in Aon Hewitt Best
                      Employers awards
                                               Chorus Investor Roadshow October 2017   5
Chorus Roadshow Presentation - October 2017 - AWS
Chorus-owned

THE CHORUS NETWORK
>   We operate a nationwide wholesale
    access network of fibre optic and
    copper cables connecting homes and
    businesses
        cables typically connect back to our
            local telephone exchanges, often via
            broadband cabinets
           our fibre also provides backhaul to
            many mobile network sites/towers and
            retail service provider networks

    Common network assets          Our copper network                                Our fibre network
       ~600 local exchanges          ~130,000km copper                                ~46,000km fibre
       ~11,000 cabinets              FTTN broadband footprint to ~90% of lines        FTTP available to ~1.36m customers by Dec 22
       ~280,000 poles                VDSL broadband to ~80% of lines                  point-to-point fibre in CBD areas
       ~30,000km duct network        Vectoring upgrade outside Chorus UFB areas       fibre to multiple mobile provider cellsites

                                                                              Chorus Investor Roadshow - October 2017            6
Chorus Roadshow Presentation - October 2017 - AWS
TRANSITION TO A REGULATED UTILITY MODEL
>   Existing copper regulatory framework uses benchmarking and Total Service Long Run Incremental Cost
>   Government policy preference to introduce a utility-style building block methodology for fibre networks
>   Draft legislation introduced to Parliament in August suggests the following regulatory framework from
    2020:

             87% of population where fibre will be available by end of 2022                         Remaining 13% of population
         Fibre – post 2020 utility framework

                                               Note: Legislative process subject to new
                                               Government, followed by the Commerce
                                               Commission process to set input
                                               methodologies

                                                                                     Chorus Investor Roadshow - October 2017      7
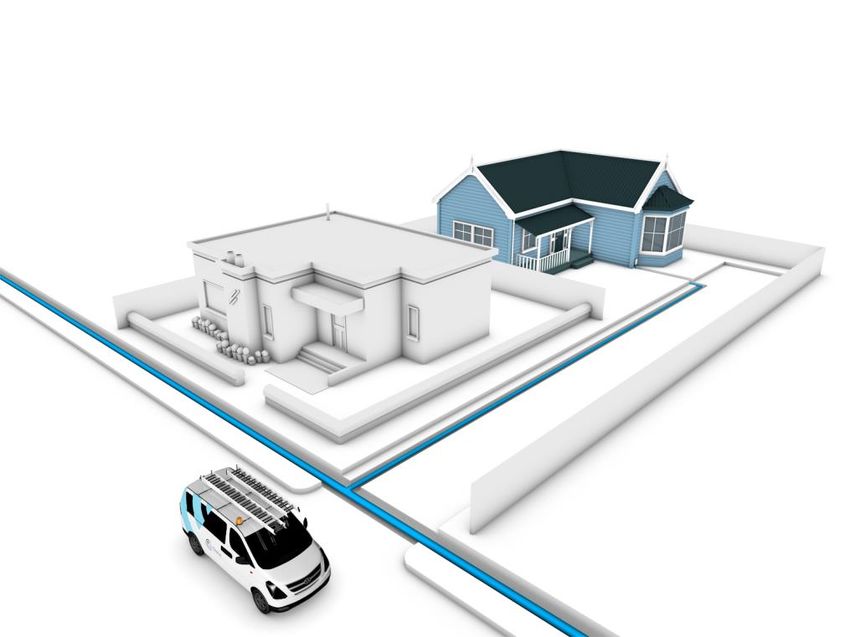
Chorus Roadshow Presentation - October 2017 - AWS
A Fibre Future
Our public private partnership to deploy ultra-fast broadband

                                                                8
Chorus Roadshow Presentation - October 2017 - AWS
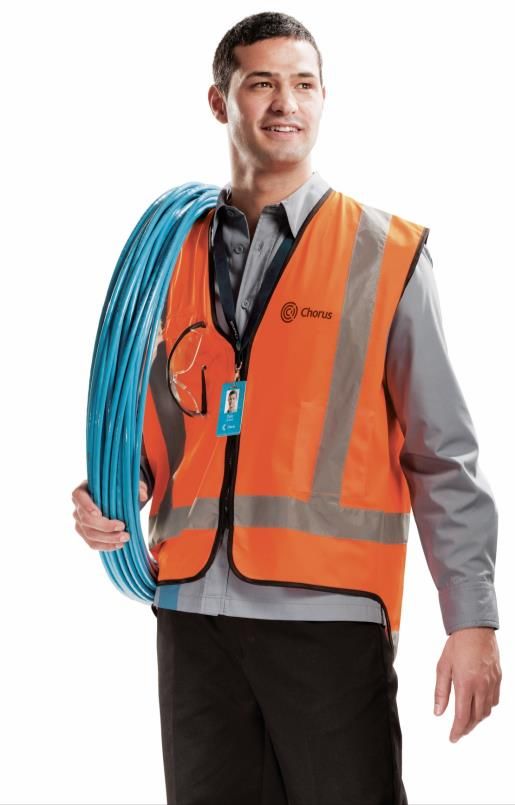
NEW ZEALAND IS TAKING FIBRE FURTHER…
>   Ultra-fast broadband (UFB): a Government objective
    ▪ original objective (UFB1): fibre to premises covering 75% of population by 2020
    ▪ subsequent agreements have extended coverage goal to 87% of population by the end of 2022

>   From Auckland, New Zealand’s largest city    >   To Ahaura, in the South Island’s West Coast
    ▪ population: 1.495m (2016)                      ▪ population: 370 (2013)

                                                          Chorus Investor Roadshow - October 2017   9
Chorus Roadshow Presentation - October 2017 - AWS
A PUBLIC PRIVATE PARTNERSHIP
>   Chorus is a cornerstone partner in the UFB rollout
    ▪ requirement that Chorus split from Telecom NZ to participate: demerger in December 2011
    ▪ Crown partnerships with four fibre companies: Chorus, Enable, Northpower, Ultrafast Fibre
                                         UFB1: to be completed by Dec 2019
                                         Crown investment: $1.345b                     Chorus’ UFB1 role
                                         Premises* covered: ~1.174m                          ~830,900 premises to pass
                                         Homes and businesses covered: ~1.526m                (includes ~44k greenfields)
                                         Population covered: 75%                             estimated communal capex of
                                                                                              $1.75b to $1.8b
                                                                                             Crown funding of up to $929m
                                                                                              (50:50 equity/debt)
                                                                                             connection capex subject to
                                                                                              demand: ~1.1m homes and
                                                                                              businesses
                                                                                             FY18 average cost to connect:
                                                                                              $1,050 - $1,200 (excluding layer 2
                                                                                              and including standard installations and
                                                                                              some non-standard single dwellings and
                                                                                              service desk costs)

                                                                                                                        10

                                                                             Chorus Investor Roadshow - October 2017
FIBRE EXTENDED TO 87% OF POPULATION
   >       The Government announced extensions to the UFB1 rollout in January and September 2017
           ▪ fibre to reach another ~12% of population across ~370 towns and rural communities
           ▪ Chorus has increased its share of these additional UFB phases

                                                                                                                     Premises to be passed by                    ~1,054,000*
                      Chorus rollout schedule – indicative only*
                                                                                                                     Chorus by Dec 2022
             140,000
                                                                                                                     Customers able to connect by                ~1.36 million
             120,000                                                                                                 rollout end
Premises     100,000
passed                                                                                                               Estimated communal capex to                 $2.26 to 2.37 billion
               80,000                                                                                                pass premises
               60,000                                                                                                Crown funding                               Up to 1.33 billion
               40,000                                                                                                                                            (57:43 equity/debt)
               20,000                                                                                                * Includes estimated 43k greenfields premises for UFB1

                      -
                           FY12 FY13 FY14 FY15 FY16 FY17 FY18 FY19 FY20 FY21 FY22 FY23
                                            UFB1               UFB2 & UFB2+
       * UFB1 build ends Dec 2019 and UFB2 build ends Dec 2022. Detailed scheduling for UFB2 & UFB2+ to be completed by end 2017.

                                                                                                                       Chorus Investor Roadshow - October 2017                   11
UFB ROLLOUT STAGES
>      The fibre rollout currently occurs in two stages
       ▪ Stage 1: communal network deployment
          • the fibre network is built along the street to
              enable future connections from each property
              boundary
          • the cost of this work is reported as cost per
              premises* passed (CPPP)
          • Government funding is received for
              premises passed

                                                                                                                                              Stage 2: Connection
        ▪    Stage 2: connection from boundary to               Stage 1:                                                                      2 fibre pairs fully ducted
             premises                                          Communal                                                                       from the street to an
             • the connection to the home is built from the                                                                                   Optical Network Terminal
                                                                                                                                              inside the home
                street to the premises when a request is
                received from the customer, via their retailer
             • this is fully funded by Chorus and is reported as
                cost per premises connected (CPPC)
    * A “premises” for the purposes of UFB contracts includes office buildings or multi-dwelling units that may have multiple tenants
                                                                                                    Chorus Investor Roadshow - October 2017
                                                                                                                                                                12
UFB COSTS
                  Fibre: average cost per premises                                     Total fibre capex: communal vs connections

    $NZ     5000
            4000                                                                500      Fibre connections + layer 2      UFB communal          UFB communal - Crown financing
                                                                                450
            3000                                                                400

                                                                     $NZm       350
            2000                                                                300

            1000                                                                250
                                                                                200
                 0                                                              150

                      FY13 FY14 FY15 FY16 FY17                                  100
                                                                                 50
                      Cost per premises connected                                  0
                                                                                         FY12               FY13         FY14            FY15           FY16                FY17
                      Cost per premises passed

>     FY17 cost per premises passed (CPPP): $1,651                             >       $640m received as Crown financing to 30 June 2017
      vs $1,550 - $1,650 guidance ($41m W.I.P)                                         ($1,118 per premises passed x 572,000 premises)
>     FY17 cost per premises connected (CPPC) of                               >       Communal capex has reduced as build transitioned to less
      $1,122* vs $1,100 - $1,250 guidance                                              costly suburban areas
      *excludes layer 2; includes standard installations and some
      non-standard single dwellings and service desk costs
                                                                               >       Connection capex subject to demand and connection type
                                                            Includes capitalised service desk costs
                                                                                                     Chorus Investor Roadshow - October 2017                           13
New Zealand’s
broadband market

                   14
BROADBAND MARKET OVERVIEW
   >         Demand for broadband continues to grow, helped by continued premises/population growth
   >         The fibre rollout is a churn event with smaller retailers growing their share of overall market
           IDC – Broadband market share by technology                                            IDC - Broadband market share by retailer

1,600,000                                                                            1,600,000

1,400,000                                                                            1,400,000

1,200,000                                                                            1,200,000

1,000,000                                                                            1,000,000

 800,000                                                                              800,000

 600,000                                                                              600,000

 400,000                                                                              400,000

 200,000                                                                              200,000

       -                                                                                    -

            Chorus xDSL                        Chorus mass market fibre
            Chorus premium fibre               Local fibre companies (UFB)
                                                                       Source: IDC
            Other fibre networks               Other xDSL
            Vodafone cable                     Fixed (mobile) wireless                                                                                          15
                                                                                            Spark    Vodafone      Orcon      Vocus     2degrees   Trustpower    ROM
            Legacy fixed wireless, satellite
 Source: IDC                                                                                        Chorus Investor Roadshow - October 2017
MARKET DYNAMICS

                  >       Strong retail competition
                          ▪ 100Mbps fibre as entry level plan
                          ▪ bundled content (e.g. Netflix, Sky TV) and/or
                  Vocus           electricity (e.g. Trustpower, Vocus, Contact)
                          ▪       differentiation based on unlimited data and
                                  product giveaways (e.g. smart TV, Netflix)

                  >       Our network competes with:
                              Vodafone’s HFC network in Christchurch,
                                    Wellington and Kapiti
                                   local fibre companies
                                   other fibre networks typically focused on the
                                    backhaul and business markets
                                   mobile and fixed wireless networks
                          Chorus Investor Roadshow - October 2017           16
CHORUS CONNECTION TRENDS
  >        Total connections 1,582,000 at 30 September
                copper lines with no broadband declining (baseband copper and unbundled copper)
                      Q1 slowdown in decline of broadband connections to 1,184,000

                         30 Sept      31 Dec    31 March     30 June     30 Sept
                           2016         2016        2017        2017       2017     1800000
Unbundled                105,000      99,000      90,000      82,000      76,000    1600000
copper                                                                                                         Baseband copper
Baseband copper          354,000     343,000     328,000     313,000     302,000
                                                                                    1400000
(no broadband)                                                                                                 UCLL
                                                                                    1200000
Fibre broadband          203,000     231,000     259,000     292,000     328,000
(GPON)
                                                                                    1000000
VDSL                     179,000     199,000     224,000     244,000     294,000                              Copper ADSL
(includes naked)                                                                    800000
Copper ADSL              847,000     784,000     716,000     650,000     562,000    600000
(includes naked)

Data services             10,000       9,000       9,000       8,000       7,000    400000                      VDSL
(copper)
                                                                                    200000                    Fibre (GPON)
Fibre premium             13,000      13,000      13,000      13,000      13,000
(P2P)
                                                                                         0
Total fixed line        1,711,000   1,678,000   1,639,000   1,602,000   1,582,000       30-Jun-16     30-Sep-16  31-Dec-16   31-Mar-17    30-Jun-17   30-Sep-17
connections
                                                                                        Data services (copper)                Fibre premium (P2P)
                                                                                        Fibre broadband (GPON)                VDSL
                                                                                        Copper ADSL                           Unbundled copper (no broadband)
                                                                                        Baseband copper (no broadband)
CONNECTIONS DRIVERS
INDICATIVE CONNECTIONS BY ZONE AT 30 SEPT                          Chorus          Non-UFB1 & 2 areas        Local Fibre Company         TOTAL
(note: zones not yet defined to reflect UFB2+ areas)            UFB1 & 2 areas                                 UFB 1 & 2 areas
                            Copper connections – no broadband            241,000                 62,000                        75,000      378,000
                                 Broadband – copper and fibre            866,000                170,000                       148,000    1,184,000
                                                       TOTAL           1,107,000                232,000                       223,000   1,562,000*
                                                                                        *Excludes the 20k business fibre/copper data connections

Growing connections                                                  Reducing connections
Broadband penetration at an estimated 85% and continues to           Growing network competition as local fibre companies (LFCs)
grow. Fibre established as the premium product and our               expand their fibre footprint: ~140k connections at 30 June 2017
expanding fibre footprint is expected to help win customers from     (~85k FY16) out of planned footprint of ~450k customers.
wireless and HFC networks.
Intense retail competition is helping broaden the market by          Fixed wireless (mobile) retailers actively encouraged their
providing customers with attractive plans and pricing (e.g. free     existing low data customers onto their own networks in FY17.
smart TV; free Netflix).                                             Government funded Rural Broadband Initiative will extend
                                                                     wireless coverage to a further ~70k rural addresses.
Population and premises growth is providing underlying market        Continued migration of voice only lines to mobile/wireless and
growth: Auckland city is projected to account for over half of       consolidation of multiple voice lines as technology options
NZ’s expected population growth to 2040 with 400,000 new             become more mainstream and population ages.
homes.
                                                                                    Chorus Investor Roadshow - October 2017
                                                                                                                                                     18
FIBRE UPTAKE HAS EXCEEDED EXPECTATIONS
         39% uptake with 309,000 connections within UFB deployed footprint at 30 September
         73% of mass market fibre plans now 100Mbpsor higher (FY16:54%)

                                                                   Total mass market fibre uptake by plan type
         UFB uptake FY13-FY17                                100
                                        35%          % of
300000                                         35%   plans   90
                                                             80
250000                                         30%           70
                                  24%
                                               25%           60
200000
                                               20%           50                                                                     100/20Mbps
150000                    14%                                40                                                                     $43/month
                                               15%
                                                             30
100000             8%
                                               10%           20                                                                     50/10Mbps
 50000     3%
                                               5%            10                                                                    $40.50/month
                                                              0
     0                                         0%
                                                                     Jun-16    Sep-16     Dec-16     Mar-17      Jun-17   Sep-17
          Jun-13 Jun-14 Jun-15 Jun-16 Jun-17
DEMAND HAS INCREASED EACH YEAR
                                            >     40,000 new fibre connections built in Q1, our highest
       First time fibre orders received           ever quarter for build
      as a % of fibre capable addresses                     Chorus fibre connection activity - all NZ
%              (by rollout year)            25000

60
                                            20000
50
40                                          15000
30
20                                          10000
10
 0                                              5000

                                                  0

      FY12    FY13    FY14   FY15    FY16               Connections built and activated              Additional connections completed
                                                        Orders (net of cancellations and rejections in the month)

                                                                                                                                   20
                                                                  Chorus Investor Roadshow - October 2017
UFB1 UPTAKE BY REGION
                             ROLLOUT COMPLETED IN THESE AREAS
                    50.00%

                    45.00%

                    40.00%                                                                                                      39%
                                                                                                                              AVERAGE
                    35.00%                                                                                                     UPTAKE

                    30.00%
% uptake relative
to capable
addresses
                    25.00%

                    20.00%

                    15.00%

                    10.00%

                     5.00%

                     0.00%

                                                Sep-16   Dec-16   Mar-17   Jun-17      Sep-17

                                                                                                                              21
                                                                                    Chorus Investor Roadshow - October 2017
DATA DEMAND IS GROWING RAPIDLY
 >     Streaming video is becoming mainstream                                       >    Monthly average data usage per
       ▪ 1 in 4 NZers using a streaming service in 2016                                  connection on our network grew 52% in
       ▪ ~50% of Sky TV set-top boxes are now                                            FY17 to 162GB
          internet capable                                                               ▪ we’re forecasting ~680GB monthly average
       ▪ 4K TVs use 7GB per hour                                                            by 2020
       ▪ ~62% households on unlimited data plans                                             300
                                                                                        GB                 Copper           Fibre       Average
                                                                                             250
            Share of residential connections by data cap
100%   6%      5%                                                                            200
                        8%                                              Unlimited
                                   33%
80%                                                                     100GB or             150
                                                  51%
                                                              62%       more
60%                                                                     50GB to              100
                                                                        100GB
                                                                        20GB to
40%                                                                                          50
                                                                        50GB
                                                                        5GB to 20GB
20%                                                                                           0
                                                                        Under 5GB
 0%
   2012       2013      2014       2015           2016          2017

                               Source: Statistics NZ ISP Survey June 2017
                                                                                              Chorus Investor Roadshow - October 2017             22
FIXED LINE NETWORKS DELIVER LOWEST COST PER GB
>   51% increase in Chorus network traffic at ~9pm between June 2016 and June 2017

                       Chorus network traffic by time of day

                                                               Chorus Investor Roadshow - October 2017   23
FY18: What we’re focused on

                              24
BETTER BROADBAND
>   Driving broadband uptake and retention
    ▪ Ask for better campaign continues to raise
       awareness of VDSL and fibre availability
    ▪ targeted incentives for retailers to migrate
       ADSL/UCLL connections to better broadband
       and win back off-net connections

>   Providing customers with a network that is
    fast, reliable and congestion free
    ▪ ~$20m investment in vectored VDSL in FY18 in
       areas outside our planned UFB footprint
    ▪ will significantly improve VDSL speed (e.g.
       ~100Mbps at 600m; 50Mbps at 1km)
    ▪ indicative footprint (outside UFB1 & 2 areas) is:
       •   ~40% would get >30Mbps
       •   ~30% would get >50Mbps
       •   ~20% would get >100Mbps

                                                          Chorus Investor Roadshow - October 2017   25
TRANSFORMING CUSTOMER EXPERIENCE & COST
>   We’re reshaping Chorus to lift customer
    experience and reduce cost
    ▪ new executive structure
    ▪ emphasis on end-to-end customer experience
       to simplify systems and processes
    ▪ trialling new fibre migration methods with the
       aim of reducing customer effort to
DELIVERING THE FUTURE BROADBAND NETWORK

>   Ongoing operational focus on delivering our contracted UFB rollout on time and on budget
>   Continue to work towards a new regulatory framework that supports efficient private sector investment to
    meet network upgrades and increasing consumer demands

                                                                   Opex
     Initial RAB                                                                    ANNUAL MAXIMUM
        value                                                                          ALLOWABLE
                                             Regulatory          Return on              REVENUE
                                               WACC               capital
                           RAB                                                      Anchor and price
                                                                                    capped products:
                                            Depreciation         Return of           voice
                                                                  capital            100/20Mbps fibre
       Capex                                                                         direct fibre
                                                                                   NB. Symmetrical wash-
                                                                Regulatory
                                                                                   up for unders or overs
                                   Asset lives                 tax allowance

                                                               Building block                        27

                                                                 cost stack
CREATING OPPORTUNITIES TO GROW
>   Identifying new open access
    business opportunities

    ▪   fixed line and 5G: we see a
        complementary future

    ▪   strong demand for trial data
        centre; more sites planned

    ▪   national backhaul contract with
        2degrees

    ▪   emerging demand for smart
        locations (non-broadband access
        points)

                                          Chorus Investor Roadshow - October 2017   28
Financial Highlights
Financial overview and capital management

                                            29
FINANCIAL SNAPSHOT
           Revenue ($m)                                            EBITDA ($m)#                                            Senior ND/EBITDA
                         1,073    1,067
                                                                                  669     653
                                                                                                                                             3.1x   3.1x   3.0x
                                                                                                                            2.9x
                                                                                                                  2.7x                2.7x

1,050   1,057   1,058    1,006    1,008    1,040       662      663      649     602                 652
                                                                                          594

FY12    FY13    FY14     FY15* FY16* FY17             FY12     FY13     FY14    FY15* FY16* FY17                 FY12      FY13       FY14   FY15* FY16* FY17
   > Build of UFB network will increase leverage metrics through to completion of UFB1 in 2019
   > FY12 results pro-forma post demerger
        *FY15 and FY16 earnings impacted by benchmarked pricing (effective 1 Dec. 2014 to 15 Dec. 2015). ‘Dotted’ bars reflect the FY revenue / EBITDA
         that would have been recorded if the FPP pricing was applied to these financial reporting periods.
        # EBITDA is a non-GAAP financial measure

                                                                                                Chorus Investor Roadshow - October 2017               30
FY18 GUIDANCE SUMMARY
                         FY18 guidance                                                                               FY17 result
UFB1 Cost Per Premises                                $1,500 - $1,600                                                   $1,651
Passed (CPPP)
UFB2 communal capex                                  $50m - $70m
                         (based on estimated starting premises of 30,000 to 40,000 and premises
                                            handed over of 5,000 to 15,000)
UFB1 Cost Per Premises                               $1,050 - $1,200                                                    $1,122
Connected                  (excluding layer 2 and including standard installations and some non-
(CPPC)                               standard single dwellings and service desk costs)

Fibre connections &      $260 – $290m (based on mass market 152,000 fibre connections, 12,000                           $258m
layer 2 capex               backbone builds and 2,500 premium business fibre connections and
                                              including service desk costs)

FY18 Gross capex                                      $780 – $820m                                                      $639m

FY18 EBITDA                                            $625 – 650m                                                      $652m

                         UFB programme guidance
UFB1 Communal             Tracking toward the top half of this programme guidance, excluding additional splitter investment. As a
guidance: $1.75 - $1.8     result of higher than anticipated fibre uptake, Chorus is bringing forward the investment of additional
billion                  splitters prior to 2020, and expects to spend up to $30 million on this capability by 2020. This additional
                                                                expenditure is growth related.

                                                                           Chorus Investor Roadshow - October 2017
                                                                                                                                 31
CAPEX SUMMARY
> FY18 GUIDANCE: $ 780m - $820m                          Historical gross capex and illustrative FY18 profile

   Fibre $590m-$625m                                                  Common            Copper   Fibre   $780 - $820m
        ~$10m capitalisation (IFRS 15)
        ~$10m pole replacement programme in Chorus    $679m
                                                                                                  $639m
         UFB areas                                                   $597m            $593m
        $50-70m spend forecast for UFB2 communal
        Growth in forecast fibre connections                                                               590-625

                                                        566                                        503
   Copper $125m-$145m                                                  504             486
        ~$50m capitalisation of items previously
         expensed (IFRS 15)
        ~$20m VDSL vectoring investment
                                                                                                   79       125-145
        ~$10m pole replacement programme across the    61              60               67
         balance of the network                         52              33               40        57        50-65
                                                       FY14            FY15            FY16       FY17      FY18
   Common: $50m-$65m                                                                                     GUIDANCE
                                                        Chorus Investor Roadshow - October 2017             32
CAPITAL MANAGEMENT

                        Chorus dividend profile                            >     The Chorus Board considers that a ‘BBB’ credit rating or
                                                                                 equivalent credit rating is appropriate for a company
      30                                                                         such as Chorus. It intends to maintain capital
      25                                                                         management and financial policies consistent with these
cps                                                                              credit ratings.
      20                                                                          ▪   FY18 dividend guidance of 22cps, subject to no material
                                                                                      adverse changes in circumstances or outlook.
      15                                                                             A Dividend Reinvestment Plan has been available to NZ
                                 Dividend                                             and Australian resident shareholders with a 3% discount
      10                                                                              to prevailing market price.
                                 suspended
       5                         during copper                                       The FY17 final dividend was underwritten with 54% DRP
                                 pricing review                                       uptake.
       0
            FY12* FY13 FY14 FY15 FY16 FY17 FY18
       FY12*: prorated for the post        During the UFB build programme to 2020, the Board
       demerger period of seven months     expects to be able to provide shareholders with
                                           modest dividend growth from a base of 20cps per
                                           annum, subject to no material adverse changes in
                                           circumstances or outlook.

                                                                                               Chorus Investor Roadshow - October 2017   33
DEBT PROFILE
                  As at                     $m
              30 June 2017                                                   Term debt profile at 30 June 2017 (NZ$m)
                                                        800
                                                                                                                       CFH debt securities available
    Borrowings                            1,862                                                                        Face value of CFH debt securities issued
                                                        600
                                                          NZ
    + PV of CFH debt                        99                                                                         EUR EMTN
                                                         $M
    securities (senior)                                                                                                NZ Bond
    + Net Finance leases                   154          400                                       785                  GBP EMTN
                                                                             677
    Sub total                             2,115
                                                        200                                                                                                                                   96
    - Cash                                (170)                                     400                                                                                 78
                                                                                                                27                                 46
    Total net debt                        1,945                                                                                                                                              113
                                                                                                                59                                 59                   89
    Net debt/EBITDA                    2.98 times         0

                                                                                                                2025
                                                                                                                       2026
                                                                                                                              2027
                                                               2018
                                                                      2019
                                                                             2020
                                                                                    2021
                                                                                           2022
                                                                                                  2023
                                                                                                         2024

                                                                                                                                     2028
                                                                                                                                            2029
                                                                                                                                                   2030
                                                                                                                                                          2031
                                                                                                                                                                 2032
                                                                                                                                                                        2033
                                                                                                                                                                               2034
                                                                                                                                                                                      2035
                                                                                                                                                                                              2036
       Financial covenants require senior debt ratio
        to be no greater than 4.75 times

    >     At 30 June, debt of $1,862m comprised:
          ▪    Long term bank facilities $350m undrawn
          ▪    NZ bond $400m
          ▪    Euro Medium Term Notes $1,462m (NZ$ equivalent at hedged rates)
                                                                                                     Chorus Investor Roadshow - October 2017                                             34
Appendices

             35
UFB2 & UFB2+ DETAILS
>   The Government announced extensions to the UFB1 rollout in 2017
    ▪ UFB2 announced January 2017
    ▪ UFB2+ announced September 2017
Government UFB rollout
UFB2: to be completed by Dec 2022     Chorus’ UFB2 role
                                          to pass ~168,000 premises = estimated communal capex of $370m to
                                           $410m*
Crown investment: $307m
Premises* covered: ~200k                  Crown funding of up to $298m (65:35 equity/debt)
Homes and businesses covered: ~216k       connection capex subject to demand: ~203,000 homes and businesses
Population covered: 9%                    estimated cost of $1,500-$1,700 per connection (in 2017 dollars and including
                                           layer 2, backbone costs for MDUs and rights of way with 10 or fewer premises)

UFB2+: to be completed by Dec 2022    Chorus’ UFB2+ role
                                          to pass 54,500 premises = estimated communal capex of $135m to
                                           $155m*
Crown investment: $130m                   Crown funding of up to $109m (100% equity)
Premises* covered: ~60k                   connection capex subject to demand: ~60,000 homes and businesses
Homes and businesses covered: ~60k        estimated cost of $1,500-$1,700 per connection (in 2017 dollars and including
Population covered 2%                      layer 2, backbone costs for MDUs and rights of way with 10 or fewer premises)

                                          *includes rights of way with more than 10 premises                        36

                                                                    Chorus Investor Roadshow - October 2017
INCOME STATEMENT
                                          FY17    FY16
                                           $m      $m

Operating revenue                         1,040   1,008
Operating expenses                        (388)   (414)
Earnings before interest, tax,             652     594         > FY16 EBITDA was impacted by five and a
depreciation and amortisation (EBITDA)                         half months of benchmark copper pricing
Depreciation and amortisation             (339)   (327)
Earnings before interest and income tax     313     267
Net interest expense                      (154)   (140)
Net earnings before income tax              159     127
Income tax expense                         (46)    (36)
Net earnings for the year                  113      91

                                                          Chorus Investor Roadshow - October 2017   37
REVENUE                       FY17
                               $m
                                                 FY16
                                                  $m
                                                                 EXPENSES                                   FY17
                                                                                                             $m
                                                                                                                         FY16
                                                                                                                          $m
Basic copper                   450                489*           Labour costs                                74**         78

Enhanced copper                248                242*           Provisioning                                  43         60
Fibre                          198                133            Network maintenance                           87         89

Value Added                     36                 35            Other network costs                           27         34
Network Services                                                 IT costs                                    60**         65
Field Services                  76                83*            Rents, rates and property                     30         28
                                                                 maintenance
Infrastructure                  23                 20
                                                                 Regulatory levies                             13         13
Other                           9                   6
                                                                 Electricity                                   14         14
Total                        1,040               1,008           Consultants                                   10         4
* included ~6 months of the final copper pricing determination   Insurance                                      3         3
                                                                 Other                                         27         26

Note: simplifying revenue categories for FY18                    Total                                        388        414
                                                                 ** These costs are impacted by a changed capitalisation approach in FY17

                                                                               Chorus Investor Roadshow - October 2017          38
FY18 REVISED REVENUE REPORTING CATEGORIES
Category                     Description                                                                                      FY17
                                                                                                                                $m
Copper line (no broadband)   Revenues received for copper lines where no broadband service is provided by Chorus (i.e.          163
                             ‘voice only’ UCLL, SLU, SLES, Baseband IP, UCLFS lines).

Copper based broadband       Revenues received for copper lines where an ADSL or VDSL broadband service is provided by          501
                             Chorus, including the backhaul (tail extension services) relating to these services.

Data services (copper)       Revenues received for the ~8,000 data services connections on copper.                               32
Fibre broadband (GPON)       Revenues for business and residential fibre connections on GPON.                                   123
Fibre premium (P2P)          Revenues for enterprise/network grade bandwidth and direct (dark) fibre point-to-point (P2P)        79
                             connections.
                             Note: Includes regional backhaul previously included in Value Added Network Services and fibre
                             backhaul for copper connections previously included in Basic Copper.

Value added network          Revenues for carrier grade data transport services and aggregation handover links.                  34
services
Infrastructure               No change                                                                                           23
Field services               No change                                                                                           76
Other revenue                No change                                                                                            9
Total revenue                                                                                                                 1,040

                                                                                Chorus Investor Roadshow - October 2017

                                                                                                                                      39
CHORUS WHOLESALE PRICING – KEY SERVICES
Regulated copper pricing: effective 16 December 2015               Key mass market (GPON) fibre product pricing as at 01 July 2017
Copper line only                         Year 1 - $29.75           Voice only               $25.00           UFB contracted products.
                                              Year 2 - $30.22                                                          FY19 pricing applies until end of 2019 with subsequent
                                                                   50/10Mbps                        FY17: $40.50
                                              Year 3 - $30.70                                                          pricing subject to regulatory framework.
                                                                                                    FY18: $41.50
                                              Year 4 - $31.19
                                                                                                    FY19: $42.50
                                              Year 5 - $31.68
                                                                   100/20Mbps                       FY17: $43
Copper line with broadband                    Year 1 - $41.19
                                                                                                    FY18: $44
                                              Year 2 - $41.44
                                                                                                    FY19: $45          Commercial products. Prices subject to change on notice,
                                              Year 3 - $41.71
                                                                   200/20Mbps                       FY17-FY19: $55     but must be within UFB contracted price cap in Chorus
                                              Year 4 - $42.02
                                                                   1Gbps residential                FY17-FY19: $65     UFB areas.
                                              Year 5 - $42.35
                                                                   1Gbps business (SME)             FY17-FY19: $75

                                                                   Business 100/100Mbps             FY17-FY19: $175+ UFB contracted product. FY19 pricing applies until end of
                                                                   to 1G/1G                                          2019 with subsequent pricing subject to regulatory
                                                                                                                     framework.

Fibre premium point-to-point products
High Speed Network Service   100Mbps to 1Gbps over Ethernet.                                        $380+                  Price capped in Chorus UFB areas until end of 2019
Premium/Bitstream 4                                                                                                        with subsequent pricing subject to regulatory
Direct Fibre Access          Layer 1 (unmanaged) dark fibre.                                        $355                   framework.

Bandwidth Fibre Access       Layer 1 bandwidth managed fibre. 100Mbps, 1Gbps or 10Gbps.             $380+
                                                                                                                           Commercial products. Prices subject to change on
Intra Candidate Area         Layer 1 or 2 fibre backhaul, used between local exchanges within UFB   $450+                  notice, but must be within UFB contracted price cap
Backhaul                     areas.                                                                                        in Chorus UFB areas.
Chorus Regional Transport    Connecting New Zealand's major UFB centres with 10Gbps and 100GE       various                                                          40
                             bandwidth options.

                                                                                                              Chorus Investor Roadshow - October 2017
Disclaimer
This presentation:
•    Is provided for general information purposes and does not constitute investment advice or an offer of or invitation to purchase
     Chorus securities.
•    Includes forward-looking statements. These statements are not guarantees or predictions of future performance. They involve
     known and unknown risks, uncertainties and other factors, many of which are beyond Chorus’ control, and which may cause
     actual results to differ materially from those contained in this presentation.
•    Includes statements relating to past performance which should not be regarded as reliable indicators of future performance.
•    Is current at the date of this presentation, unless otherwise stated. Except as required by law or the NZX Main Board and ASX
     listing rules, Chorus is not under any obligation to update this presentation, whether as a result of new information, future
     events or otherwise.
•    Should be read in conjunction with Chorus’ audited consolidated financial statements for the year to 30 June 2017 and NZX and
     ASX market releases.
•    Includes non-GAAP financial measures including "EBITDA”. These measures do not have a standardised meaning prescribed by
     GAAP and therefore may not be comparable to similar financial information presented by other entities. However, they should
     not be used in substitution for, or isolation of, Chorus' audited consolidated financial statements. The EBITDA information used
     in this presentation has been subject to audit. We monitor EBITDA as a key performance indicator and we believe it assists
     investors in assessing the performance of the core operations of our business. Refer to the appendices of Chorus’ 2017 annual
     results investor presentation for further detail relating to EBITDA measures.
•    Has been prepared with due care and attention. However, Chorus and its directors and employees accept no liability for any
     errors or omissions.
•    Contains information from third parties Chorus believes reliable. However, no representations or warranties are made as to the
     accuracy or completeness of such information.

                                                                                                                               41
You can also read