Vaibhav Global Limited - Global Retailer of Fashion Jewelry, Accessories and Lifestyle products on Home Shopping TV and e-Commerce Platforms

Page created by Clarence Fletcher
 
CONTINUE READING
Vaibhav Global Limited - Global Retailer of Fashion Jewelry, Accessories and Lifestyle products on Home Shopping TV and e-Commerce Platforms
Global Retailer of Fashion
Jewelry, Accessories and
Lifestyle products on
Home Shopping TV and           Vaibhav Global Limited
e-Commerce Platforms         Financial Results Presentation – Q3 & 9M FY2019
Vaibhav Global Limited - Global Retailer of Fashion Jewelry, Accessories and Lifestyle products on Home Shopping TV and e-Commerce Platforms
Certain statements in this document may be forward-looking statements. Such forward-looking statements are
subject to certain risks and uncertainties like regulatory changes, local political or economic developments, and
many other factors that could cause our actual results to differ materially from those contemplated by the relevant
forward-looking statements.
Vaibhav Global Limited will not be in any way responsible for any action taken based on such statements and
undertakes no obligation to publicly update these forward looking statements to reflect subsequent events or
circumstances.

                                                                                           Investor Presentation Q3 FY2019   2
Vaibhav Global Limited - Global Retailer of Fashion Jewelry, Accessories and Lifestyle products on Home Shopping TV and e-Commerce Platforms
B2C Success in Developed Markets

    Products Sold                    TV Homes              Avg. Quantity per Customer
   On TV and Web              Directly Accessed (FTE)                  *TTM

Unique Customers *TTM               ROE *TTM                     ROCE *TTM

      Revenue                          PAT                      Free Cash Flow
                                                                Investor Presentation Q3 FY2019   3
Vaibhav Global Limited - Global Retailer of Fashion Jewelry, Accessories and Lifestyle products on Home Shopping TV and e-Commerce Platforms
100 million (FTE) households on TV
                                                                                           shopping in the US and UK; expanding
    End-to-end B2C business model for                                                      online presence
                                                Vertically-
    fashion and lifestyle accessories                            Shop LC and               Positive customer engagement metrics –
    Proprietary TV home-shopping and
                                                integrated
                                                                TJC are brands             customer base, retention rate, repeat
    e-commerce platforms                     fashion retailer
                                                                  with strong              purchases
                                              on electronic
                                                                   customer
                                             retail platforms
                                                                   visibility
Professional, experienced                                                                              Sizeable B2C franchise in
management team having in-                                                                             developed markets – unique
depth knowledge and industry            Strong                                                         achievement for an Indian
experience                                                               Robust customer               Company
                                      management
                                                                           engagement
Talent pool across marketing,            team                                                          Growing recognition of deep
merchandising, operations,                                                                             value fashion products enables
technical and strategy functions                                                                       scaling to adjacent categories

    Investments in customer interface,            Solid         Hybrid supply              Established and efficient manufacturing
    production, warehousing facilities,                             chain                  operations in Jaipur, India
                                             infrastructure
    supply chain and CRM                                        infrastructure             Outsourcing from China, Thailand,
                                               backbone
    Scalable model with limited capex                                                      Indonesia and India; aggressive trend
    requirement                                                                            spotting initiatives
                                                                                                     Investor Presentation Q3 FY2019    4
Vaibhav Global Limited - Global Retailer of Fashion Jewelry, Accessories and Lifestyle products on Home Shopping TV and e-Commerce Platforms
Manufacturing and
                               Consumption Markets                              Souring Markets
                                                                                                                 STS, China
                                                                                                                   Sourcing

USA                                                                                                 STS Hong Kong
 TV channel retail                                                                                    Sourcing
 E-commerce website                          The Jewellery Channel, UK                                Sub-contracting
 & Apps
                                              TV channel retail
 Marketplaces
                                              E-commerce website & Apps
                                              Marketplaces                                                  STS Thailand
                                                                                                              Sourcing
USA
                                                                      VGL India
  B2B Wholesale distribution
                                                                          Group HQ
                                                                          Gemstones & jewelry
                                                                          manufacturing            STS Bali
                                                                          Sourcing                   Sourcing

                                                                          Product Development

                                                                                                   Investor Presentation Q3 FY2019   5
Vaibhav Global Limited - Global Retailer of Fashion Jewelry, Accessories and Lifestyle products on Home Shopping TV and e-Commerce Platforms
Table of Contents

  Q3 & 9M FY19         Financial          Business
    Financial    07   Performance   15   Background                23
   Performance           Trends            Details

                                                Investor Presentation Q3 FY2019   6
Vaibhav Global Limited - Global Retailer of Fashion Jewelry, Accessories and Lifestyle products on Home Shopping TV and e-Commerce Platforms
Q3 & 9M FY19
     Financial
 Performance
Vaibhav Global Limited - Global Retailer of Fashion Jewelry, Accessories and Lifestyle products on Home Shopping TV and e-Commerce Platforms
Key Highlights for Q3 FY19
Home TV Network Reach – 100 Mn Households across US and UK                             Operating Highlights in Q3 & 9M FY19
  100 million households on full time equivalent (FTE*) basis                            Driving forward on its quality journey, Shop LC is preparing to apply
  75 million households in the US                                                        for the Malcolm Baldridge Progress Level Award from Quality Texas
  25 million households in the UK                                                        Foundation after receiving recognition for the Malcolm Baldrige
                                                                                         Commitment Level Award.
Q3 FY19 Retail Volumes at 2.9 Million Units, up 18% YoY and overall                      With the objective of diversifying its revenue profile, Shop LC is
ASP* at $23.43, down 5% YoY                                                              implementing entire days dedicated to non-jewelry products –
                                                                                         resulting in new customer addition, lower sales returns and ASP.
  Home TV shopping volumes at 1.92 million units
  Web shopping volumes at 0.99 million units                                             Shop LC launched Fulfillment by Amazon (FBA) Marketplace, enabling
                                                                                         placement of select inventory at Amazon Fulfillment Centers, which
  Strong volume growth on both platforms
                                                                                         raises brand awareness with customers converting from Amazon to
  Deep customer engagement drives strong repeat purchases                                Shop LC at a low acquisition cost.
                                                                                         TJC focused on better customer targeting through additional slots and
Q3 FY19 – Financial Performance                                                          better channel positioning.
  Total Revenue at Rs. 511 crore, up 11% YoY                                             Shop LC expanded studio operations, adding remote broadcasting
  B2C* Retail revenue up 23% YoY                                                         capability to support HD programming.
  EBITDA at Rs. 71 crore, up 15% YoY                                                     75,000 units were sold on Shop LC’s Birthday Bash along with
  PAT at Rs. 53 crore, up 15% YoY                                                        ongoing support to the One for One program.
                                                                                         Great Place to Work Institute named VGL’s China subsidiary STS
                                                                                         Gems among Greater China’s Best Companies to Work For 2018 for
                                                                                         the third consecutive year. Key operating entities within the group are
                                                                                         receiving greater recognition under the GPTW program.

*ASP = Average Selling Price; B2C = Business to Consumer; FTE = Full Time Equivalent                                       Investor Presentation Q3 FY2019    8
Vaibhav Global Limited - Global Retailer of Fashion Jewelry, Accessories and Lifestyle products on Home Shopping TV and e-Commerce Platforms
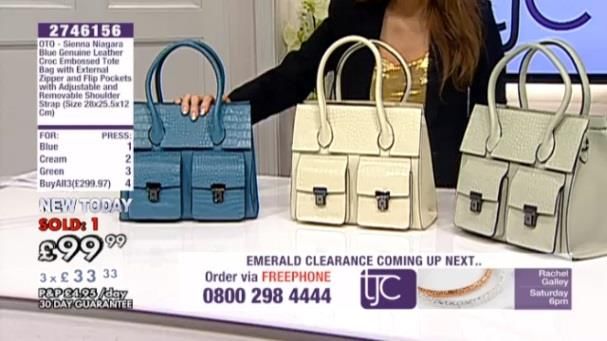
“I am happy to share that Q3FY19 has been a milestone quarter for VGL where
Chairman’s Message                         revenues exceeded Rs. 500 crore and profits exceeded Rs. 50 crore. We have
                                           delivered a strong performance on all key matrices during the holiday season. We
                                           sold close to three million units on our symbiotic omni-channel sales model that
Commenting on Q3 & 9M FY19 performance,    comprises TV and Web platforms backed by strong demand for our fashion jewelry
Mr. Sunil Agrawal, Chairman and Managing   and fashion accessories in both, the US and the UK. On constant currency basis,
Director, Vaibhav Global said:             retail growth was 10% in the US and 25% in the UK, largely driven by strong
                                           volumes.
                                           Retail revenues in INR terms expanded 23% during the quarter and 22% in the
                                           first nine months. Gross margin expanded significantly to 64%, driven by higher
                                           contribution from retail revenues. Our operating and net margins also marked an
                                           improvement on a y-o-y basis. During the quarter, we undertook various measures
                                           towards improving operational efficiency and customer satisfaction metrics. We
                                           expanded non-jewelry contribution to sales by dedicating more TV program time
                                           and expanded our presence on Amazon. We expect these initiatives to keep our
                                           margins at elevated levels over the coming quarters. Sustaining strong returns on
                                           capital, VGL reported ROE and ROCE at 23% and 37% respectively. Free cash
                                           flow, during the first 9 months period, was Rs. 158 crore.
                                           I am pleased to share that, during the quarter, we moved forward on our pursuit of
                                           quality under the Malcolm Baldrige National Quality Award program. We also saw
                                           growing recognition on our employee engagement/satisfaction initiatives under the
                                           Great Places to Work survey, with meaningful progress across regions.
                                           We are focused on delivering joy across our entire ecosystem – our customers,
                                           employees, vendors, communities and shareholders. Success on this front should
                                           allow us to create long term value in the enterprise.”
                                                                                            Investor Presentation Q3 FY2019   9
Vaibhav Global Limited - Global Retailer of Fashion Jewelry, Accessories and Lifestyle products on Home Shopping TV and e-Commerce Platforms
Financials – Q3 & 9M FY19 Performance
(Revenue Breakdown – Rs. crore)

        Revenue                                Jewelry & Lifestyle Products

                      1,352
              1,147
                                    TV Sales                           Web Sales                         B2B
                                                  874                               357                      134
                                                                                                                    122
                                          740                                 273
 462   511
                                                                                               67
                                    335                                148
                              282                               111
                                                                                                      28

 Q3     Q3     9M      9M      Q3 Q3 9M 9M                      Q3 Q3 9M 9M                   Q3 Q3 9M 9M
FY18   FY19   FY18    FY19    FY18 FY19 FY18 FY19              FY18 FY19 FY18 FY19           FY18 FY19 FY18 FY19

                                                                                          Investor Presentation Q3 FY2019   10
Financials – Q3 & 9M FY19 Performance
(Revenue Breakdown - Local Currency)

                  Shop LC (USD million)                       TJC UK (GBP million)
                                           126.0
                               116.1                                                   38.8

                                                                           30.7

         44.5        48.8                                        15.2
                                                     12.2

        Q3 FY18     Q3 FY19   9M FY18     9M FY19   Q3 FY18    Q3 FY19   9M FY18     9M FY19

                                                                           Investor Presentation Q3 FY2019   11
Retail Performance Trends – Q3 & 9M FY19
    (Volume and ASP)

TV Sales                 Sales Volume ('000s)                       Average Selling Price US$
                                                 4,778     26.1                     26.3         26.3
                                      4,342

                                                                         24.6
                1,666      1,919

               Q3 FY18   Q3 FY19    9M FY18     9M FY19   Q3 FY18      Q3 FY19    9M FY18       9M FY19

Web Sales                Sales Volume ('000s)                       Average Selling Price US$
                                                 2,505     21.5
                                      2,086                              21.2

                            992                                                                  20.5
                 792                                                                20.2

               Q3 FY18   Q3 FY19    9M FY18     9M FY19   Q3 FY18      Q3 FY19    9M FY18       9M FY19
                                                                                   Investor Presentation Q3 FY2019   12
Financials – Q3 & 9M FY19 Performance
(Margins)

                                               Gross Profit        Gross Margin (%)
            Gross Profit    Gross Margin (%)
                                                                        62.4%
                                      64.0%
               57.4%                           61.2%

                 265                   327       702                     844

              Q3 FY18                Q3 FY19   9M FY18                9M FY19

               EBITDA      EBITDA Margin (%)     EBITDA       EBITDA Margin (%)

                                     13.9%                              12.6%
                                               10.3%
             13.4%

                62                     71        118                     171

            Q3 FY18                Q3 FY19     9M FY18                9M FY19

                                                                            Investor Presentation Q3 FY2019   13
Financials – Q3 & 9M FY19 Performance
(Profits)

                PAT   PAT Margin (%)                            PAT   PAT Margin (%)
                                10.3%
                                                                                8.9%

             9.9%                                            7.0%

              46                 53                           81                 122

            Q3 FY18           Q3 FY19                       9M FY18           9M FY19

                                            EPS (Rs.)
                                                             37.33

                                                   24.75
                               13.99     16.11

                              Q3 FY18   Q3 FY19   9M FY18   9M FY19

                                                                                       Investor Presentation Q3 FY2019   14
Financial
Performance
      Trends
Financials Performance Trends
         (Revenue breakdown - Rs. crore)
                                                                                        Revenue

                                                                         1,436            1,569
                                                     1,276                                                           1,352
                                                                                                           1,147

                                                     FY16                FY17             FY18            9M FY18   9M FY19

                                                                            Jewelry & Lifestyle Products

                         TV Sales                                                       Web Sales                                    B2B Sales
                                                                                           372                357
       931        972        996                                                 274                273                       190       201
                                                   874              223
                                        740                                                                                                      134
                                                                                                                       122                                 122

      FY16       FY17       FY18     9M FY18 9M FY19                FY16         FY17     FY18    9M FY18 9M FY19      FY16   FY17     FY18    9M FY18 9M FY19

*Previous years numbers have been re-grouped to align with Ind AS 115.                                                          Investor Presentation Q3 FY2019   16
Retail Performance Trends

TV Sales            Sales Volume ('000s)                     Average Selling Price US$

            5,854   5,877   5,737                                      26.9
                                             4,778                                26.3       26.3
                                     4,342
                                                              24.9
                                                      24.4

            FY16    FY17    FY18    9M FY18 9M FY19   FY16    FY17     FY18    9M FY18 9M FY19

Web Sales           Sales Volume ('000s)                     Average Selling Price US$
                            2,840
                    2,353                    2,505                     20.3       20.2      20.5
            2,264                    2,086                    17.5
                                                      15.1

            FY16    FY17    FY18    9M FY18 9M FY19   FY16    FY17     FY18    9M FY18 9M FY19
                                                                              Investor Presentation Q3 FY2019   17
Financials Performance Trends
(Margins)

                    Gross Profit     Gross Margin (%)
                    60%            59%                  62.4%
             63%                               61.2%

             804    865            929         702       844

             FY16   FY17           FY18      9M FY18    9M FY19

                     EBITDA        EBITDA Margin (%)
                                                        12.6%
                                   10%
                    7%                        10.3%
             6%

              75    102            159          118       171

             FY16   FY17           FY18      9M FY18    9M FY19

                                                                  Investor Presentation Q3 FY2019   18
Financials Performance Trends
(Profits)

                             PAT   PAT Margin (%)

                                    7%                   8.9%
                                                7.0%
                      4%
              3%

              40      65           113          81       122

             FY16    FY17          FY18       9M FY18   9M FY19

                                   EPS

             12.27   19.85         34.55       24.75     37.33

             FY16    FY17          FY18       9M FY18   9M FY19

                                                                  Investor Presentation Q3 FY2019   19
Financial Performance Trends
(Balance Sheet - Rs. crore)

               Shareholders’ Equity               Fixed assets including intangibles
                                                129
                                        662                126
                              550
                 434                                                   120
         379
                                                                                     114

        FY16     FY17         FY18    9M FY19   FY16      FY17        FY18        9M FY19

                       Net Debt                          Net Current Assets
         55                                                            417           394
                   6                            305        314
                              (13)

                                       (154)
        FY16     FY17         FY18    9M FY19   FY16      FY17        FY18        9M FY19
                                                                              Investor Presentation Q3 FY2019   20
Financial Performance Trends
(Cash Flow – Rs. crore)

                    Operating Cash flow                                  Free Cash Flow
                                                 171                                               158

                    88                  76                             58                 73
                              36                                                18

          (10)                                                (59)
         FY16      FY17     FY18    Q3 FY19 9M FY19          FY16     FY17     FY18   Q3 FY19 9M FY19

      Operating Cash Flow: PBT+ Depreciation-             Free Cash Flow: Operating Cash Flow – Capital
      (Changes in working capital) + adjustment for non   expenditure
      cash items

      Note: Interest charges have been deducted and
      Interest income have been added while calculating
      operating cash flow.

                                                                                           Investor Presentation Q3 FY2019   21
Financial Performance Trends
(Key Ratios)

                      ROE                                  ROCE
                                    23%                                        37%
                            21%
               15%                                                25%
        11%                                         16%
                                             12%

        FY16   FY17         FY18   9M FY19   FY16   FY17          FY18       9M FY19

                                                                         Investor Presentation Q3 FY2019   22
Business
Background Details
Product Profile

  FASHION JEWELLERY         FASHION ACCESSORIES   LIFESTYLE PRODUCTS
         Bracelets                 Watches             Home Décor
          Bangles                 Handbags              Bed linens
         Earrings                Scarves, etc.        Pillow Covers
    Studded jewelry, etc.                            Beauty products

                                                      Investor Presentation Q3 FY2019   24
Branding Initiative
Developing new brands and brand ambassadors for live presentation of BRANDS

                                                                 Investor Presentation Q3 FY2019   25
Sourcing
    Global supply chain capability of 12 million pieces, continuously expanding

                            China:
                            Guangzhou, Haifeng,
     India:                 Hauadu Shenzhen,                      In-House designers & craftsmen
     Noida, Jaipur,         Dongguan, Zhuji,                                                             Sourcing from appropriate
     Nagaland, Kashmir      Wenzhou, Wuzhou,                              No middlemen                   micro-markets in China/Asia
                            Yiwu, Hunan, Hong                Access to latest manufacturing technology
                            Kong
                                                                         Scale Flexibility               Focus on best price to
                                                                                                         customer through bottom
                                                                         Low Investment                  price discovery
                                       Thailand:
                                       Bangkok, Chang Mai,              Rapid turnaround
                                       Mae Sai,                      Mapping Latest Fashion
                                       Kanchanaburi,                                                     Vendor evaluation process
                                       Chanthburi                       Competitive Pricing

               Indonesia:
                                                                                                         Assessing value perception –
               Bali, Yogyakarta, Sumatra,                                                                design / fashion trend / price
               Madura Surabaya                                                                           in target markets

                                                                                                          Investor Presentation Q3 FY2019   26
Manufacturing
  Four ISO 9001:2008 facilities in Jaipur, with capacity of
  producing 6 million units annually
  Commenced operations at new 100,000 sq. ft., fully-integrated,
  LEED certified ‘Gold Level’ building at SEZ, Jaipur
  Diamond manufacturing and sourcing unit of the company is also
  present in Mumbai
  Over 2,800 people in India across corporate, manufacturing,
  design, sales & marketing, customer service, logistics etc.
  Low-Cost operations with one of the lowest levels of wastages in
  the industry

                                                                     Investor Presentation Q3 FY2019   27
TV Networks – USA
(Consumption Markets)

Shop LC, USA
  75 million households shopping (FTE, out of 120 mn)
  Based out of Austin, Texas USA
  Almost 500 people in sales & marketing, customer service, logistics, TV
  production, e-commerce and support functions
  Successfully re-branded Liquidation Channel to Shop LC
  ‘Deep Discount’, Auction based retail model
  Expert hosts attract and engage customers, driving repeat sales
  Improved product presentation by investing in new Studio facility
  New warehouse facility operationalized

                                                                            Investor Presentation Q3 FY2019   28
TV Networks – UK
(Consumption Markets)

The Jewellery Channel (TJC), United Kingdom
   25 million households shopping(FTE, out of 25 mn)
   Based out of London
   Over 150 people in sales & marketing, customer service, logistics, TV
   production, e-commerce and support functions
   State-of-the-art auction/scheduling system; Launching Budget Pay
   Targeted behavioural marketing through IBM Unica platform
   TjC live stream available on multiple platforms like Youtube, Facebook
   Long standing relations with TV distributors such as SKY, Virgin, FreeView
   etc.

                                                                                Investor Presentation Q3 FY2019   29
E-Commerce
(Consumption Markets)
E-commerce presence in our chosen retail markets…

      www.ShopLC.com USA
        Launched Mobile App for Shop LC
        Launched Budget Pay EMI option
        Better website optimization on mobile devices
        Migration of Web Hosting to Amazon Web Services
        Enhanced customer engagement on all social platforms;
        targeted marketing

      www.TjC.co.uk UK
        Launched Budget Pay EMI option
        Launched Mobile App for TjC                                                    USA                        UK

                                                                   Retail Format
                                                                                   •   Rising Auction         •   Rising Auction
        Latest DemandWare Platform
                                                                                   •   Catalogue Price        •   Live TV
        Better Website optimization for all devices                                •   Collections            •   Web Exclusive
        Enhanced customer engagement                                               •   Live TV                •   Sale
        Europe delivery started through E-commerce platform                        •   Clearance              •   Outlet
        Engaging customers through different sales channels like
        Facebook Shop, Ebay store etc.                                                              Investor Presentation Q3 FY2019   30
Early Adopters And Cord Cutters

High Definition And Ip   Expansion Into Over The    Smart Tv And Streaming
Broadcast                Air Presence (Ota)         Devices (Iptv)

   High Definition          Cord Cutters don’t         We already have
   Broadcast                want to pay for any        presence on
    o Charter               channel or satellite       following Smart
       Communication        fees, the can catch        TV’s:
    o AT&T                  the feed directly via       o Samsung SMART

   Adoption of new          antenna                         TV
   technology of            We are already              o LG Smart TV

   Broadcasting             present part time in        o Android TV

    o Reducing
                            some Areas                 We also have apps
       dependency on                                   on streaming devices
                                                        o ROKU
       Infrastructure
                                                        o Google
    o Minimizing
       downtime as IP                                       Chromecast
                                                        o Amazon Fire HD
       would broadcast
       it via internet

                                                                              Investor Presentation Q3 FY2019   31
Management Team

  Mr. Sunil Agrawal                                                                   Puru Aggarwal
  Chairman & Managing Director                                                        Group CFO
     An MBA from Columbia University, NY (USA), Sunil                                      Over 25 years of rich experience in business modeling,
     established Vaibhav in 1980 as a first generation                                     financial strategy & planning, business development,
     entrepreneur and has led the company’s transition into a                              procurement, supply chain & distribution, budgeting, taxation,
     leading brand for fashion jewelry and lifestyle accessories                           cost control, legal compliances and mergers & acquisitions
     Travels extensively across the world, overseeing operations,                          Previously worked with Teva Pharmaceuticals India as
     sourcing raw material globally and representing the company                           Director & Country CFO for 11 years. Has also worked with
     at major trade shows and jewelry fairs in the US, Europe and                          Coca-Cola India and E&Y India
     Asia

                                              Kevin Lyons
                                              President- Shop LC, USA
                                                   Over 20 years of strong expertise and a proven track record
                                                   in delivering Omni channel growth in retail and e-commerce
                                                   Previously Senior Vice President of E-Commerce with HH
                                                   Gregg inc., a $2 bn, 227 store chain
                                                   Also worked with leading retailers such as Sears and Best Buy
                                                   in areas like Operations, Merchandising, Loss Prevention,
                                                   Customer Driven Supply Chain, Customer Centricity and
                                                   Channel/New Business Innovation
                                                                                                                      Investor Presentation Q3 FY2019       32
Management Team

  Jeff Allar                                                                         Raj Singh
  Group Senior Vice President, HR                                                    Vice President, Supply Chain, VGL Group
     Over 30 years of work experience at major international                             Mr. Raj Singh is a graduate in Chemistry and trained in
     companies including IBM, Unilever and the Stonyfield Farm                           Mechanical Maintenance. He began his career with Shrenuj &
     unit of Groupe Danone                                                               Company Ltd. In his career of over 22 years, he has gone
     Tremendous Organization development and senior level HR                             strength to strength improving and innovating businesses. His
     experience having worked with brands like ACS, Stonyfield                           initiatives like Gems Studded Stainless Steel Jewellery, Ion
     and Good Humor – Breyers Ice Cream                                                  Plating, etc., are ground-breaking in the Jewellery industry.
                                                                                         For an industry that is type cast as labor intensive, Mr. Singh
                                                                                         has led many automation drives and is successful in grinding
                                                                                         out cost efficiencies.
                                      Vineet Vashist
                                      Group Chief Technology Officer
                                           Previously worked with Aritzia, a leader in women's fashion in
                                           Canada, as Director of E-Commerce Technology.
                                           Prior to Artiza, worked at various roles with Abercrombie &
                                           Fitch (A&F) for 8 years, his last role was Director IT
                                           eCommerce
                                           Managed a portfolio with an annual budget of over $20
                                           million to deliver new strategic capabilities and operational
                                           enhancements to Aritzia and A&F.
                                                                                                                    Investor Presentation Q3 FY2019        33
Management Team

  Amit Agarwal                                                                     Vivek Jain
  Managing Director – TJC, UK                                                      Senior Director, Finance – VGL Group
     MBA marketing with over 16 years of experience with                               A Chartered Accountant with over 16 years’ experience in
     different companies like BSL Ltd , Siddhartha Marble and                          Finance, Banking, Accounts, Budgeting, MIS, Taxation, Costing,
     VGL group in Sales and product merchandising in Jewellery                         Internal Audit, Systems Implementation, Company Secretarial
     and Textile category .                                                            and Legal mattersPart of core team that successfully
     Managing product merchandising , planning for TV and E-com                        implemented organizational turnaround strategies
     platform along with handling retail sales at TJC UK.                              Appointed TJC UK Finance Director in September 2016
     Part of core team who successfully launched life style                            responsible for both the finance function and a number of
     category and turnaround TV retail sales growth in last few                        operational functions including Content Distribution, Customer
     years                                                                             Solutions and Fulfilment through a period of significant growth
                                                                                       and change

                                                 Pushpendra Singh
                                                 Vice President , Human Resources, Asia
                                                     Over 19 years of experience in HR with a range of Indian
                                                     companies such as NTPC, Jindal Steel and Power, Kalpataru
                                                     and Reliance Communications, successfully implementing many
                                                     talent acquisition, management and retention initiatives

                                                                                                                   Investor Presentation Q3 FY2019       34
Contact Information

For more information on    Puru Aggarwal     Vaibhav Global Limited
Vaibhav Global Limited,                      +91-141-2770648
                              Dipti Rajput
         please contact:                     Puru.Aggarwal@vglgroup.com
                                             Dipti.Rajput@vglgroup.com

                              Shiv Muttoo    CDR India
                                             +91 22 6645 1207/1220
                               Karl Kolah
                                             shiv@cdr-india.com
                                             karl@cdr-india.com

                                                              Investor Presentation Q3 FY2019   35
Thank You
You can also read