Spotlight Japan retail - May 2018 Savills World Research Japan
←
→
Page content transcription
If your browser does not render page correctly, please read the page content below
Savills World Research
                                Japan

Spotlight
Japan retail         May 2018

                   savills.com.jp/research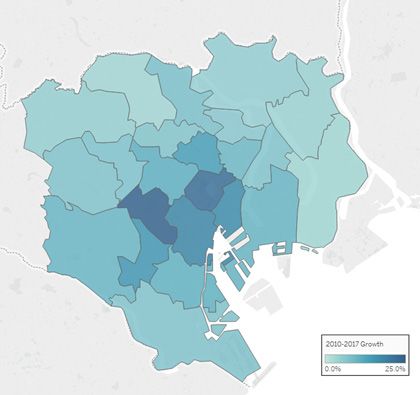
Spotlight | Japan retail May 2018
Savills World Research
Japan
Spotlight
Japan retail May 2018
Spotlight
Japan retail savills.com.jp/research
“Positive macro conditions such as growing
tourism and a mild uptick in consumer SUMMARY
confidence appear to be improving retail rents
in some submarkets. Investment interest, Tokyo’s average 1F retail rent has generally
remained stable since 2016.
notably in Japanese prime retail assets as core
assets, remains strong, leading to further cap Non-1F rents continue their steady trend
upward.
rate compression.”
1F Ginza rents have improved 14.1% YoY,
possibly due to increasing overseas tourist
Tokyo submarket rents Ginza 1F rents sat at JPY58,100
expenditures and positive luxury product sales.
According to a semi-annual survey per tsubo, remaining the highest
by Japan Real Estate Institute (JREI) among the surveyed submarkets.
1F rents in Ginza grew 14.1% YoY Consumer confidence is mildly improving
and BAC Urban Projects, Tokyo’s
while non-1F rents fell 1.0% YoY. 1F with high-income households seeing the largest
retail rents have on average held
rents in Ginza had been declining improvement.
fairly steady since 2016. Non-1F
since 1H/2015, concurrent with a
rents continue their steady march
decrease in average spending per Drugstores and daily goods stores sales
upward as 1F rents edged up year-
overseas tourist. As discussed later continued to increase in 2017, growing 5.8% YoY.
on-year (YoY), although with diverged in this report, the spending decline
performance between submarkets. has halted and total shopping Investment volumes in retail have increased to
The largest growth was seen in expenditures by overseas tourists JPY771 billion in 2017. Q1/2018 has not seen many
Ginza, which could be resulting have been increasing due to the
from consistently strong tourism transactions because of limited opportunities, but
growing number of visitors. Luxury
and improving luxury retail sales. investment interest appears to remain sound.
retail sales are also on the rise, which
The opening of Ginza Six is also may have contributed to the rental
increasing footfall in the submarket. increases. Furthermore, Ginza Six
On the other hand, a slowdown of appears to have had a solid first year,
fast fashion might have led to store and it is expected to reach its goals,
closures in some submarkets. namely 20 million visitors and JPY60
GRAPH 1 GRAPH 2
Tokyo 1F rents, 2008 – 2H/2017 Tokyo non-1F rents, 2008–2H/2017
Ginza 1F Omotesando 1F Shinjuku 1F Shibuya 1F Average asking rent: 1F Ginza Non-1F Omotesando Non-1F
90 Shinjuku Non-1F Shibuya Non-1F
Average asking rent: Non-1F
80 45
70 40
Thousand JPY / tsubo
60 35
Thousand JPY / tsubo
30
50
25
40
20
30
15
20
10
10 5
0 0
1H 2H 1H 2H 1H 2H 1H 2H 1H 2H 1H 2H 1H 2H 1H 2H 1H 2H 1H 2H 1H 2H 1H 2H 1H 2H 1H 2H 1H 2H 1H 2H 1H 2H 1H 2H 1H 2H 1H 2H
2008 2009 2010 2011 2012 2013 2014 2015 2016 2017 2008 2009 2010 2011 2012 2013 2014 2015 2016 2017
Source: JREI, BAC Urban Projects, Savills Research & Consultancy Source: JREI, BAC Urban Projects, Savills Research & Consultancy
savills.com.jp/research 02Spotlight | Japan retail May 2018
billion in sales. Considering these YoY to JPY22,200. According to JREI, shopping expenditures by overseas
positive factors, the rental growth in reconstruction of existing buildings is tourists increased by JPY214 billion,
Q1 could be the beginning of another tightening vacancy, thereby resulting or 15% YoY, to JPY1.6 trillion. While
gradual upward trend. in rental increases. Although 1F rents Chinese tourists account for over
decreased 29.5% YoY to JPY19,800 50% of the spending, expenditures by
1F rents in Omotesando/Harajuku in Shinsaibashi, an abnormally large tourists from other countries also saw
rose 7.7% YoY to JPY48,900 per decline in Q3 affected the 2H average. a rapid increase of JPY119 billion yen
tsubo while non-1F rents fell 1.7% In Q4, 1F rents rebounded to around or 19% YoY. Notably, Korean tourist
YoY to JPY28,700 per tsubo. While JPY24,000, and top rents along spending increased by about JPY40
apparel stores such as Forever 21 Midosuji and Shinsaibashisuji appear billion, or 40% YoY, due to increased
and Harajuku’s iconic Spinns closed, to remain stable. It also appears that visitation.
new stores continue to open in the the limited sample size is making
area. Tenant movements are rapid as the trend look volatile. Although the The shift in tourist spending from
many lease spaces for a short period Mikigakki Shinsaibashi Building is luxury goods to daily necessities such
of time for advertising purposes. currently closed for reconstruction, as cosmetics and health products
For example, after Urban Research it is scheduled to reopen in autumn appears to be responsible for
closed its Harajuku store, the 2018 and will house Mikigakki stores decreases in shopping expenditure
space was used as a pop-up store and GAP. With the opening of the new per person, as unit prices are low.
by Jack & Marie, a lifestyle brand Daimaru Shinsaibashi Main Tower in
newly launched by automotive parts 2019, as well as the opening of Parco
company Autobacs. The Harajuku and W Osaka, a luxury Marriott hotel, GRAPH 3
Takara Estate Building, which housed planned for 2021, the dynamism of 1F rents in retail districts of regional
Forever 21 until October 2017, is the area, which is currently dominated cities, 2008 – 2017
currently under renovation. by drugstore openings, might change.
Nikkei has recently reported Louis Shinsaibashi 1F Nagoya Sakae 1F
Sendai 1F Fukuoka Tenjin 1F
In Shinjuku and Shibuya, 1F rents Vuitton’s plan to build a B1/7F retail Sapporo 1F Average asking rent 1F
declined 18.8% to JPY35,400 and building by November 2019 on a 35
4.8% to JPY33,500 YoY, respectively. vacant site next to Prada. 30
However, the rental declines can
be largely explained by a decrease Although growing e-commerce
Thousand JPY / tsubo
25
in survey samples. Vacancy is tight is a threat especially for regional
20
and there appears to be limited retail stores, as discussed in the
availability in high-rent areas. Since previous retail report, the impact 15
these areas are popular destinations from e-commerce appears to have
10
among overseas tourists, expanding been limited due to constraints
tourism should benefit the submarkets. such as a labour shortage in the 5
According to a 2016 survey by the logistics industry, a relatively older
conservative Japanese population, and 0
Tokyo Metropolitan Government, 1H 2H 1H 2H 1H 2H 1H 2H 1H 2H 1H 2H 1H 2H 1H 2H 1H 2H 1H 2H
comparatively low credit card usage. In 2008 2009 2010 2011 2012 2013 2014 2015 2016 2017
Shinjuku is the most visited ward in
Japan, retail space per person is about
Tokyo while Shibuya is in fourth place: Source: JREI, BAC Urban Projects, Savills Research & Consultancy
half of that in the U.S. and Japanese
57% and 44% of inbound tourists
regional malls mainly function as
coming to Tokyo visit Shinjuku and supermarkets selling fresh food as GRAPH 4
Shibuya, respectively. Although the
old GAP site in Shibuya is yet to find a
opposed to department stores in the Overseas tourist shopping expenditure,
U.S., which also mitigates the impact
tenant, Louis Vuitton opened a pop-up from growing e-commerce – which
2014 – 2017
store in April that featured Kim Jones’ has had little influence in the fresh China Other Per Person
Fall-Winter 2018 Men’s Precollection food sector so far. Enhancing in-store 500 80,000
on the site, highlighting the area’s experience, especially in regions 450
70,000
attractiveness. lacking in entertainment venues,
Shopping expenditure (JPY billion)
400
Shopping expenditure per person
should also help as consumers 60,000
Regional cities increasingly value experience over
350
50,000
300
Overall, regional 1F rents have not material goods.
been performing well. The average 1F 250 40,000
rent across prime districts outside of Inbound tourism 200
30,000
Tokyo sat at JPY19,483 based on the Although a rapid increase of Chinese 150
latest survey, down 8.3% YoY. On the tourist spending due to “bakugai” 20,000
100
other hand, non-1F rents registered (“explosive buying”) abruptly ended
10,000
positive growth of 1.6% YoY to in 2015, expanding tourism continues 50
JPY12,617. to have a large positive impact on 0 0
Q1 Q2 Q3 Q4 Q1 Q2 Q3 Q4 Q1 Q2 Q3 Q4 Q1 Q2 Q3 Q4
the Japanese retail sector as total 2014 2015 2016 2017
At the submarket level, 1F rents in expenditures by overseas tourists
Tenjin saw positive growth of 15% are steadily growing. In 2017, total Source: Japan Tourism Agency, Savills Research & Consultancy
savills.com.jp/research 03Spotlight | Japan retail May 2018
Unlike the short-lived shopping sprees GRAPH 5
surrounding certain electronics and Overseas tourists to Tokyo and Osaka, 2006 – 2017
luxury items, however, the popularity
of daily necessities is likely to be more
Tokyo Osaka
sustainable. According to the Ministry 16,000
of Economy, Trade, and Industry
(METI), drugstore sales nationwide in 14,000
2017 have grown 5.8% from 2016. 12,000
Food and cosmetics have led the Thousand visitors
10,000
growth, increasing sales by 8.7%
and 6.8%, respectively. Additionally, 8,000
according to the Japan Department
6,000
Store Association (JDSA), duty-free
sales at department stores have 4,000
soared to JPY270 billion in 2017, a
2,000
whopping 46% growth YoY.
0
2006 2007 2008 2009 2010 2011 2012 2013 2014 2015 2016 (Est.)
Osaka is an especially popular 2017
destination among overseas tourists
due to its unique culture, proximity Source: Tokyo Metropolitan Government, Osaka Metropolitan Government, Savills Research & Consultancy
to Kyoto, and access to a major
international airport with large low GRAPH 6
cost carrier (LCC) capacity. When Luxury item sales at department stores (12-month
compared to Tokyo, the area has
more room for growth in tourism.
moving average), 2016 – Feb 2018
Kansai International Airport was 9.5 30
served by about 18,000 LCC flights
in 2016, which made travels from 9.1 20
neighbouring Asian cities affordable.
Although the figure is more than
Sales (JPY billion)
8.7 10
the combined number of LCC
YoY (%)
flights to Narita and Haneda, Kansai
International Airport is still running 8.3 0
around 80% of its capacity, unlike
the two Tokyo airports at almost full
7.9 -10
capacity. Additionally, visitation to
Universal Studios Japan (USJ) in
FY2016 grew 5% YoY. The number 7.5 -20
Jan
Mar
May
Sep
Oct
Feb
Jun
Nov
Jan
Mar
May
Sep
Oct
Apr
Jul
Aug
Feb
Jun
Nov
Jan
Feb
Dec
Apr
Jul
Aug
Dec
of international visitors to the park is
2016 2017 2018
rapidly growing, doubling the 2014
figure to reach 2 million in CY2017. Source: JDSA, Savills Research & Consultancy
In contrast, Tokyo Disney Resort
(TDR) experienced a slight increase GRAPH 7
of 0.3% in FY2017, indicating that
TDR is reaching full capacity. The
Japan consumer confidence by income level, 2006 –
pace of growth in visitation to Osaka Apr 2018
Below JPY3 million JPY5.5-7.5 million Over JPY12 million
is likely to continue to exceed that of
60
Tokyo, likely resulting in increases in
tourist retail spending. According to 55
JDSA, sales in Osaka grew 6.8% YoY
Consumer Confidence Index
50
in 2017. In Shinsaibashi in particular,
Daimaru increased its total sales by 45
14% and duty-free sales by 71% YoY.
40
Department store sales 35
According to JDSA, department
30
store sales in ten major cities grew
by 1.7% YoY, with Osaka leading the 25
growth at 6.8% YoY. 20
In addition to cosmetics, JDSA
reported that sales of luxury items Source: Cabinet Office, Savills Research & Consultancy
savills.com.jp/research 04Spotlight | Japan retail May 2018
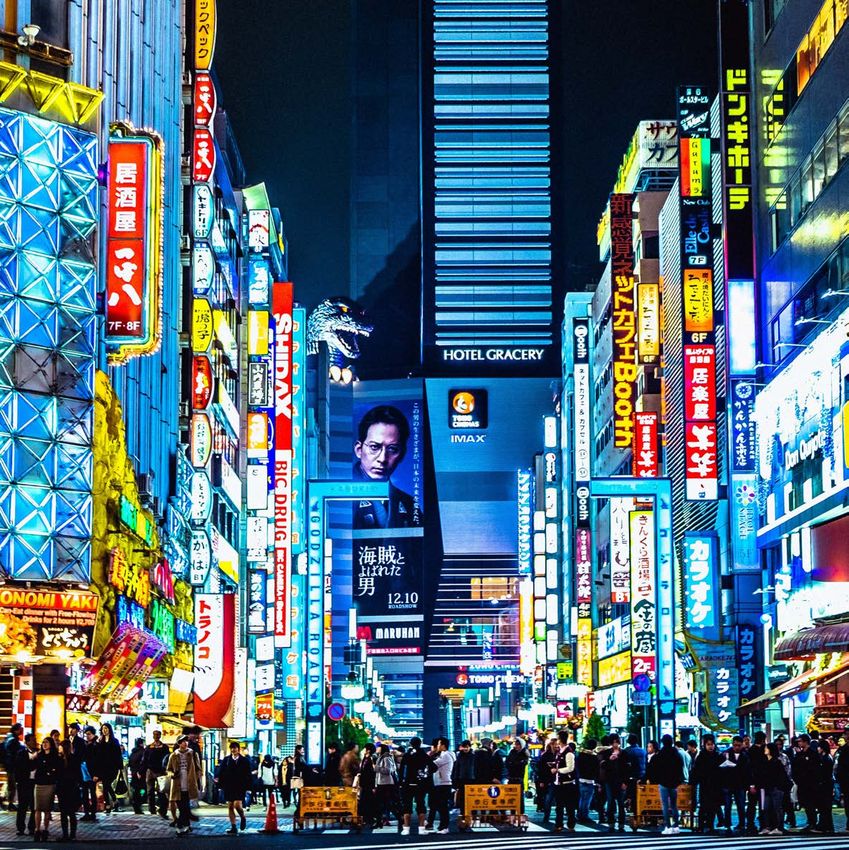
MAP 1 High asset prices should increase
Taxable income growth, 2010 – 2017 income levels among high-income
households as they typically own
multiple assets including equity and
real estate, which can generate large
capital gains upon sale. Moreover,
according to the Ministry of Health,
Labour and Welfare, wage growth in
Tokyo in 2017 was 1.2% YoY, much
higher than the national average of
0.1% growth.
At the store level, some chains appear
to be outperforming others. In FY2017,
the Hankyu/Hanshin, Takashimaya,
and Daimaru/Matsuzakaya chains have
increased sales by 5.4%, 2.9% and
2.7% YoY, respectively. Meanwhile,
sales of major Sogo/Seibu stores have
only marginally increased at 0.4% YoY,
and Isetan/Mitsukoshi has registered at
-2.7% YoY.
Examining the top performing stores
of each chain, overseas tourists are
playing a major role in increasing
sales, as the top performers are
located in popular destinations such
Source: MHLW, @OpenStreetMap (www.openstreetmap.org/copyright), Savills Research & Consultancy
as Shinsaibashi, Ginza, and Shibuya.
GRAPH 8 Daimaru Shinsaibashi registered at
Comparison of store sales growth of major the highest growth of 14% YoY in
2017, as a result of actively going after
department store chains, FY2017 vs FY2016 inbound tourist demand by setting
up two cosmetics spaces, promoting
through social networking services,
Hankyu Umeda and expanding the use of a mobile
Hankyu Hanshin
billing method.
Osaka Takashimaya
Takashimaya
Daimaru
New projects in 2018
Shinsaibashi Tokyo Midtown Hibiya fully opened
Daimaru
Matsuzakaya
to the public in March 2018. The
Seibu Shibuya 35-storey mixed-use tower has 60
Sogo Seibu retail stores and 13 movie screens.
Ginza Mitsukoshi The new iconic building overlooking
Isetan Mitsukoshi the Imperial Palace attracted 100,000
visitors on its opening day. Mitsui
Chain total Fudosan, the developer of the tower,
-20.0% -15.0% -10.0% -5.0% 0.0% 5.0% 10.0% 15.0% 20.0% is targeting JPY13 billion in revenue
YoY
for the first year of its operation. The
Source: Company disclosures, Savills Research & Consultancy introduction of this new retail venue
may change the dynamism of footfall
such as art, jewellery, and precious In addition to increasing tourist in the western part of Ginza.
metals are on the rise at department spending, mild improvement in
stores. Although luxury item sales consumer confidence of domestic Shibuya Stream is slated to open in fall
largely declined after the Chinese shoppers, with high-income 2018. The mixed-use tower will have
government imposed new tariffs in households recording the largest 3,000-sq-m retail spaces, a multi-
2016, they started posting positive improvement, may be contributing purpose space, a 180-room hotel, and
growth in May 2017. 2017 was also a to the growth. Despite slow wage a 14,000-tsubo office component. The
strong year for luxury brands such as growth across the nation, taxable retail space will target adult customers,
LVMH and Kering, with sales of LVMH income levels in the central five reflecting Shibuya’s transformation
and Kering brands in Japan increasing wards, where average household from a pop-culture mecca to a more
12% and 11%, respectively. incomes are high, are increasing. matured city appealing to a wider
savills.com.jp/research 05Spotlight | Japan retail May 2018
range of clientele. Additionally, GRAPH 9
Google is leasing the entirety of the Retail property investment volume by buyer type,
office space in Shibuya Stream. More
2007 – Q1/2018
high-earning office workers in the
area should result in growing footfall Overseas Equity & Institutional Listed Companies & REITs Private Unknown Other
1.4
and will likely have a positive impact
on retail sales. 1.2
Investment trends 1.0
In 2017, investment in retail property
Trillion yen
0.8
picked up compared to 2016. Total
volumes amounted to JPY771
0.6
billion through 2017 according to
preliminary data from Real Capital 0.4
Analytics (RCA). This is up 45%
compared to 2016, mainly due to 0.2
two large portfolio transactions by
0.0
Blackstone and Norges Bank. In
Q1/2018, transaction volumes have
significantly decreased compared to
the same period in 2017. However, Source: RCA, Savills Research & Consultancy
investment interest in the Japanese
retail market appears to remain 3.7%, respectively, in October 2017, cities. In Nagoya and Osaka, retail
sound, as illustrated by Norges a tightening of 10 basis points from six buildings housing international
Bank and Tokyu Land Corporation’s months prior. Actual transaction cap fashion brands such as Prada,
acquisition of five prime retail assets rates appear much tighter, however. Dolce & Gabbana, and Zara
in Tokyo. In Ginza and Shinsaibashi, cap rates were transacted. Prime Square
could now be in the mid 2% to 3% Shinsaibashi was reportedly sold for
A semi-annual survey by JREI range. JPY22 billion by Elliott Management,
revealed that expected cap rates about 70% appreciation from the
for prime retail property in Ginza In Q4/2017 and Q1/2018, large price the seller paid to acquire the
and Omotesando sat at 3.6% and transactions were seen in regional building in 2014.
TABLE 2
Selected retail transactions, announced Q4/2017—Q1/2018
GFA Price
Announced Property Location NOI cap rate Buyer
(sq m) (JPY billion)
Dec 2017 Prime Square Shinsaibashi Chuo, Osaka 9,414 Approx 22.0 NA Marubeni
3.3%
Nov 2017 G Bldg Midosuji 02 Chuo, Osaka 1,390 15.0 Japan Retail Fund
(Appraised)
3.7%
Mar 2018 Sakae Globe (60%) Sakae, Aichi 4,596 9.3 Frontier REIT
(Appraised)
4.4%
Nov 2017 Summit Store Mukodaicho Nishi Tokyo, Tokyo 10,660 5.1 Nomura Master Fund
(Appraised)
Costco Wholesale Sapporo 4.5%
Mar 2018 Sapporo City, Hokkaido 24,000 4.2 Kenedix Retail REIT
Warehouse (Appraised)
Source: RCA, Nikkei RE, Savills Research & Consultancy
savills.com.jp/research 06Spotlight | Japan retail May 2018
OUTLOOK
The prospects for the market
Retail rents are broadly flat at As the line between winners and available in regional cities, investment
high levels, though they look to losers materialises, it is increasingly volumes in such areas may increase
be fluctuating because of small important to gain a competitive as investors look outside of Tokyo
sample sizes resulting from advantage through capturing in search of new opportunities and
limited available space. The inbound tourist demand, identifying better yields.
overall steady trend appears to advantageous locations, and
continue while increasing inbound enhancing in-store experience.
tourism encourages increases in
average rents, especially in areas
Investment volumes in 2017 have
popular among visitors.
picked up from 2016. Although
volumes in Q1/2018 declined
Consumer confidence has been
improving with high-income compared to the prior-year period,
households seeing the largest small transaction volumes are due
uptick. Although wage growth to limited availability. Investment
is limited across Japan, income interest, especially for prime retail
levels have steadily increased in property, remains strong as illustrated
the Tokyo central five wards and by acquisitions made by Norges
major regional cities in recent Bank and Tokyu Land Corporation.
years. With more acquisition opportunities
Please contact us for further information
Savills Japan Savills Research
Christian Mancini Tetsuya Kaneko Simon Smith
CEO, Asia Pacific Director, Head of Research Senior Director
(Ex Greater China) & Consultancy, Japan Asia Pacific
+81 3 6777 5150 +81 3 6777 5192 +852 2842 4573
cmancini@savills.co.jp tkaneko@savills.co.jp ssmith@savills.com.hk
Savills plc
Savills is a leading global real estate service provider listed on the London Stock Exchange. The company established in 1855, has a rich heritage with unrivalled growth. It is a company
that leads rather than follows, and now has over 600 offices and associates throughout the Americas, Europe, Asia Pacific, Africa and the Middle East.
This report is for general informative purposes only. It may not be published, reproduced or quoted in part or in whole, nor may it be used as a basis for any contract, prospectus,
agreement or other document without prior consent. Whilst every effort has been made to ensure its accuracy, Savills accepts no liability whatsoever for any direct or consequential loss
arising from its use. The content is strictly copyright and reproduction of the whole or part of it in any form is prohibited without written permission from Savills Research.
savills.com.jp/research 07You can also read