The 2011 Social Shopping Study - Brief I: Consumer Research Dynamics, Mobile and User-Generated Content

Page created by Valerie Harmon
 
CONTINUE READING
The 2011 Social Shopping Study - Brief I: Consumer Research Dynamics, Mobile and User-Generated Content
The 2011 Social Shopping Study
Brief I:
Consumer Research Dynamics,
Mobile and User-Generated Content

June 2011
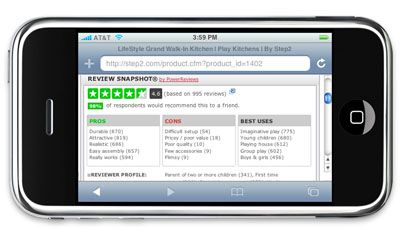
The 2011 Social Shopping Study - Brief I: Consumer Research Dynamics, Mobile and User-Generated Content
Table of Contents

                                                                                 I.                                                                      Thoughts from the Author
                                                                          II.                                                                            Survey Methodology and Demographics
                                                                    III.                                                                                 Product Research
                                                            IV.                                                                                          User-Generated Content
                                                                   V.                                                                                    Stay Tuned - Brief II: The Facebook Factor
                                                            VI.                                                                                          About the Companies

2	


I. Thoughts from the Author

        Today’s shopper is savvy with almost black belt certification in researching product and pricing. There
        is a method to their madness where they are willing to make a significant investment in time when the
        reward reaped is finding the right product at the right price.

        For the past five years the e-tailing group, with sponsorship from PowerReviews, has investigated the
        role of customer reviews, trending that behavior and social shopping to keep pace with consumer
        activity. 2011 has been a volatile year for ecommerce with a multitude of dynamics in play from social
        media and community to mobile. Aware of these changes, in this year’s survey we explored consumer
        utilization of social media across a range of merchants and channels to understand perception,
        interest, and propensity to buy based on that engagement. Secondly we sought to comprehend the
        consumer’s level of interest in community, at retail and across the web. We wanted to know the
        implications for researching and shopping behavior, particularly as it relates to Facebook, which is the
        beneficiary of much of the community attention. That portion of the study and our findings will be
        shared in Brief II.

        Consumers told us loudly and clearly in our April 2011 Social Shopping Survey that they must receive
        rewards, via price or points, in order to expend time. Despite any perceived loyalty, research fueled
        most shopping. In fact, the groundwork for this two-part brief was based on the web’s capacity to
        provide complete details better than almost any channel. Shoppers’ ability to access information at
        home, in the office or via mobile puts even greater pressure on the retailer to enable that process by
        providing comprehensive information. Consumers are gravitating to powerhouses like Amazon, who
        many see as the defacto retailer for comparison shopping, finding credibility in these destinations
        through problem solving prior to purchasing.

        As in our prior joint surveys, there appears to be several personality types that dominate the 2011
        findings, ranging from heavyweights that invest significant time researching to those who might only
        give limited time and lip-service to such behavior. We see similar social patterns playing out on the
        social front where some consumers are heavily invested while others are more voyeuristic toward that
        approach.

        Within each brief and research component we will note the respondents’ introductory premise. From
        there, food-for-thought questions that we contemplated prior to deploying the study will be served up,
        followed by supporting questions for in-depth insights. The Facebook Factor and a discussion
        surrounding community-related behavior will be uncovered in Brief II and round out the ever-changing
        social landscape.

                                                                                                                                                                                                                                                                                                                                                                             Think Social!

                                                                                                                                                                                                                                                                                                                                                                             Lauren Freedman
                                                                                                                                                                                                                                                                                                                                                                             President, the e-tailing group

3	


II. Survey Methodology & Demographics

        1,004 adults with the following demographic profile completed an online survey:

                                           In what age range do you fall?                                                                                                                                                                                                                                                                                                                Which of the following best
                                                                                                                                                                                                                                                                                                                                                                                      represents your combined annual
                                                                                                                31%
                                                                                                                                                                                                                                                                                                                                                                                         household income from all
                                                      24%                                                                                                                  26%
                                                                                                                                                                                                                                                                                                                                                                                           sources before taxes?
                                                                                                                                                                                                                                      17%
                                                                                                                                                                                                                                                                                                                                                                                         Under $25,000        5%
                                                                                                                                                                                                                                                                                                                                                                                        $25,000-$35,000       6%
          1%                                                                                                                                                                                                                                                                                         1%                                                                                 $35,001-$50,000             13%
                                                                                                                                                                                                                                                                                                                                                                                        $50,001-$75,000                       25%
         18-24                                     25-34                                                      35-44                                                      45-54                                                     54-65                                                       65 or                                                                                   $75,001-$100,000                     20%
                                                                                                                                                                                                                                                                                               older                                                                                More than $100,000                         27%
                                                                                                                                                                                                                                                                                                                                                                                   Prefer not to respond      4%
                                                                                                                                                                                                                                                                                                                                                                                                                                     	
  
                                       What is the highest level of education
                                        that you have completed to-date?                                                                                                                                                                                                                                                                                                                          What is your
             High school graduate                                                                                                                                                                                         8%                                                                                                                                                                       gender?
                                                                                                                                                                                                                                                                                                                                                                                                  51
               Some college, but no
                                                                                                                                                                                                                                                                                   22%                                                                                                            %
                     degree
                                                                                                                                                                                                                                                                                                                                                                                                            49
                                            College graduate                                                                                                                                                                                                                                                              37%
                                                                                                                                                                                                                                                                                                                                                                                                            %
          Some graduate school                                                                                                                                                                               5%

             Post graduate degree                                                                                                                                                                                                                                                                      27%                                                                                       Male      Female
                                                                                                                                                                                                                                                                                                                                                                                                                     	
  
        Respondents shopped online four times or more during the past year, spending at least $250
        online annually for products and services.

                             How often did you shop online for                                                                                                                                                                                                                                                                                                                     How much do you spend on products
                              products during the past year?                                                                                                                                                                                                                                                                                                                          and services online annually?
                                                                                                                 42%
                                                                                                                                                                                                                                                                                                                                                                                            $250-$499                              27%
                                                     30%

                                                                                                                                                                              20%
                                                                                                                                                                                                                                                                                                                                                                                            $500-$749                              24%

                                                                                                                                                                                                                                              8%                                                                                                                                            $750-$999                       16%

                                                                                                                                                                                                                                                                                                                                                                                          $1000-$1499                       16%
                                            Weekly Several Once a 4 times
                                                   times a month per year                                                                                                                                                                                                                                                                                                               $1,500 or more                       17%
                                                    month
                                                                                                                                                                                                                                                                                                                                                                                                                                            	
  
4	


III. Product Research

        Introductory Premise

        “We would like to gain a better understanding of how you decide which product best suits
        your needs; what research tools and channels you find most helpful, regardless of where you
        ultimately buy the product (online, in-store, from a catalog), and regardless of finding the
        best price.”

        Food-for-Thought Questions

        To develop the research methodology, our two companies brainstormed today’s emerging
        dynamics of selling and those that are directly related to user-generated content. They
        included general usage, consumption patterns, and changes that have resulted based on
        the current merchant landscape including brand growth, channel access, and in particular,
        social and mobile influences.

         Does user-generated content consumption continue to play a greater and evolving role
          in consumer behavior relative to researching and purchasing product?
         Does search still dominate the consumer’s path to finding the right product?
         As Amazon’s power and prowess progresses will consumers increasingly seek out their
          efficiency model making Amazon a ”one stop” destination for finding product and
          comparing prices?
         Will comprehensive user-generated content result in greater consumer loyalty towards
          those merchants?
         As broader access to user-generated content across social and mobile channels is seen,
          will it wield greater influence and expand locales for consumer consumption?
         With direct-to-consumer growth among brands, what changing dynamics will be seen
          relative to user-generated content among passion brands such as Converse, Under
          Armor, Burt’s Bees, etc.?

        Top Line Findings: Product Researching

        •   Consumers invest greater time researching but shoppers are on a mission to find the best
            price

        •   Search engines serve as the shopping point-of-origin when researching product

        •   Customer reviews continue to wield the greatest influence on buying behavior

        •   Google Shopping features see strong early adoption

        •   Mobile usage relative to shopping is mostly centered on competitive pricing

5	


Time Spent Researching

        This year, unique to years past, we anticipated that time spent on the higher end of the
        spectrum had likely grown so we added new parameters in the 75%+ arena. Our hunch
        proved correct as one in two respondents spent 75% of their overall shopping time
        researching product as compared to just 21% in 2010. The fact that 15% of respondents spent
        90% or more of their time means they must be receiving the kind of information that
        expedites decision-making with the web world playing a vital role.

                                                                                                                                                What percent of your overall shopping involves
                                                                                                                                                        researching products online?

                                                                                                                                                                        90% or more                                                                                                                                                                                  15%

                                                                                                                                                                                                            75-89%                                                                                                                                                                                35%

                                                                                                                                                                        75% or more                                                                                                                                                                                                 21%

                                                                                                                                                                                                            50-74%                                                                                                                                                                          29%
                                                                                                                                                                                                                                                                                                                                                                                            29%

                                                                                                                                                                                                            30-49%                                                                                                                                                   15%
                                                                                                                                                                                                                                                                                                                                                                                      24%

                                                                                                                                                                                                            15-29%                                                                                                                                   13%
                                                                                                                                                                                                                                                                                                                                                                              17%
                                                                                                                                                                                                                                                                                                                          8%                                                                      2011
                                                                                                                                                                                                                     1-14%                                                                                                8%                                                                      2010

                                                                                                                                                                                                                           None                                                       0%
                                                                                                                                                                                                                                                                                       1%

        Information-Intensive Online Research

        We especially wanted to focus on information-intensive products as we believe, given their
        higher retail price points, these products warrant such scrutiny. This is clearly another instance
        where consumer behavior is split and assumes a heavy/medium/light mentality. Novices and
        seasoned shoppers alike often have a lot to learn as they attempt to make smart decisions
        for new or replacement products they may have owned for long periods of time, contrary to
        impulse purchases conducted across other categories.

6	


When shopping for an information-intensive product (computer, appliance,
                                                                       television, etc.) how much time do you typically spend online researching
                                                                                            prior to completing the purchase?

                                                                                                                                                                                                A few hours                                                                                                                                                                              22%
                                                                                                                                                                                                                                                                                                                                                                                                29%

                                                                                                                                                                                                                                            A day                                                                               7%
                                                                                                                                                                                                                                                                                                                                                              11%

                                                                                                                                                                                                       A few days                                                                                                                                                                                     34%

                                                                                                                                                                                                                                 A week                                                                                                                               12%
                                                                                                                                                                                                                                                                                                                                                                                                29%

                                                                                                                                                                                             A few weeks                                                                                                                                                                           18%
                                                                                                                                                                                                                                                                                                                                                                                         23%

                                                                                                                                                                                                                        A month                                                                                           3%
                                                                                                                                                                                                                                                                                                                           4%                                                                                 2011
                                                                                                                                                                                                                                                                                                                                                                                                              2010
                                                                                                                                                 More than a month                                                                                                                                                        4%
                                                                                                                                                                                                                                                                                                                          4%

        Product Research Orientation

        Each year we wonder if information seeking behavior will begin at different points of entry.
        Since more manufacturers than ever have gone direct to the consumer, our curiosity pushed
        us to explore where shoppers begin their search. Respondents confirmed that search engines
        are still the main starting point for research with retail close behind and manufacturers serving
        as a launch for most others.

                                                                              When researching branded products online prior to purchasing (e.g. HP
                                                                             computer, Panasonic TV, Nike shoes) which of the following most closely
                                                                                        represents where you would begin that process?

           I start with a search engine and look for top search
                                                                                                                                                                                                                                                                                                                                                                                                                     44%
                        results for products I desire
                            I start with retailer sites that sell the product I’m
                                                                                                                                                                                                                                                                                                                                                                                                            33%
                                                  looking for

                                                                                                                         I start with the manufacturer’s site                                                                                                                                                                                                                                  20%

                    I reach out to my social network on Facebook for
                                                                                                                                                                                                                                                                                                                                                                    2%
                                    recommendations

                                                                                                                                                                       I pose a question on Twitter                                                                                                                                                          1%

7	


The Role of Social Sites in Shopping Research

        We introduced the concept of research via social sites given their continued influence and
        time spent by consumers in these communities. I was not surprised that there appears to be a
        divide between community and commerce as just 29% of respondents take advantage of
        social sites for research. Beyond that finding, one in two people do not use social sites for
        research, distinctly choosing to contain their behavior to more traditional shopping tools. It
        will be interesting to monitor and trend this question to see if audiences who grow up with
        social sites rely more heavily on them for researching shopping needs.

                                                                                                         Overall, how often do you use social sites such as Facebook and Twitter
                                                                                                                       for your shopping research to gather ideas?

                                                                          I always read and research on social sites to gather ideas                                                                                                                                                                                                                                         6%

                                                                                      I often read and research on social sites to gather ideas                                                                                                                                                                                                                               10%

                                              I sometimes read and research on social sites to gather ideas                                                                                                                                                                                                                                                                       13%

                                                                                  I rarely read and research on social sites to gather ideas                                                                                                                                                                                                                                            22%

                                                                                   I never read and research on social sites to gather ideas                                                                                                                                                                                                                                                  49%

        Community and Social Influences on Buying Behavior

        Retailers, of course, are interested in where consumer research is being conducted but more
        importantly they need to know what tools and techniques impact buying behavior. Here,
        customer reviews come out strongly on top and their perseverance is a testament to the
        value consumers receive. Q/A, a newer tool, sees strong impact despite what we observe to
        be much more limited deployment across the web. In fact, our 4Q10 Mystery Shopping Study
        of 100 merchants (EG100) revealed that only 18% of sites make this feature available.
        Community forums had impact for one in four individuals where enthusiast categories likely
        pushed this tactic to a higher level. Video is an up and comer that I suspect should grow in
        impact in the coming year and may be the most exciting tactic to watch. Facebook is
        having little influence on buying as is confirmed here and in subsequent discussion that will
        dominate our second brief.

8	


Please indicate the impact of the following Community and Social tools
                                                                                            on your buying behavior. (Top-2: significant/good impact)

                                                        Customer reviews (user-generated product reviews)                                                                                                                                                                                                                                                                                            59%
                              Q&A (customers asking and answering questions about
                                                                                                                                                                                                                                                                                                                                                                                               42%
                                               products on-site)
                                                                                Community forums (for conversations among
                                                                                                                                                                                                                                                                                                                                                                                         26%
                                                                               customers or between you and other customers)
                                 Videos (viewing user-generated videos or creating your
                                                                                                                                                                                                                                                                                                                                                                                   15%
                                                         own)

                                                 Facebook fan page (company fan page on Facebook)                                                                                                                                                                                                                                                                                 13%

                                                       Facebook newsfeed (friends talking about products)                                                                                                                                                                                                                                                                         13%

                                                                                                                                                      Mobile (iPhone application, text alerts)                                                                                                                                                                               9%

                                                                                                    Twitter (monitor, respond to, and post tweets)                                                                                                                                                                                                                           9%
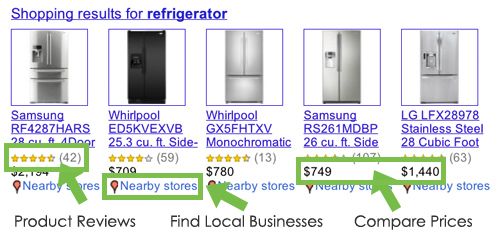
        Google Utilization

        Beyond social networks, Google has expanded their reach further into shopping, warranting
        a question that explores consumer utilization of the search engine. We were careful to
        separate out general Google behavior, which is commonplace for all of us when we view
        shopping results. Given Google’s influence, particularly in searches for specific products,
        SKUs, and almost anything shopping, it was not surprising to see that 57% of respondents had
        compared prices while 58% had read product reviews there and just over half (51%) had
        used Google Shopping to find local businesses. This is noteworthy as greater emphasis is
        being paid to the local market based upon the competitive nature seen among Groupon or
        other local engines.

9	


Over the past year, Google has added more information about local retailers and
                                                                                        their respective inventory. How would you characterize your current Google
                                                                                                   Shopping utilization? (Top-2: all of the time/very often)

                                             I use Google Shopping features to compare prices                                                                                                                                                                                                                                                                                        31%

                                                                   I use Google Shopping to read product reviews                                                                                                                                                                                                                                                                    29%

           I use Google Shopping features to find local businesses
                                                                                                                                                                                                                                                                                                                                                                              22%
                   carrying the products I'm searching for

         Mobile Phone Behavior Prior to Purchasing

         No investigative study would be complete this year without understanding mobile usage,
         one of today’s true game changers for both research and shopping. One-third of people
         have used their mobile phones four or more times to research pricing, promotions, store
         information, and product reviews prior to visiting a physical store. It is here that the notion of
         rewards also becomes apparent with price dominating the top answers.

10	


We would like to gauge recent usage of your mobile phone for product researching.
                                                                                       Thinking about the product purchases you made within the last 3 months, please tell us
                                                                                        about how often you’ve done each of thefollowing activities using your mobile phone.

                                                                                                                                                                                                                   Checked for sales and specials                                                                                                                                            33%

                                                            Looked up store information (hours, location, map, etc.)                                                                                                                                                                                                                                                                         33%

                                                                                                                                                        Checked for product ratings and reviews                                                                                                                                                                                              32%

                                                                                                                                                Looked for competitive pricing at Amazon                                                                                                                                                                                                   31%

                                                                                                                  Browsed an online store for product of interest                                                                                                                                                                                                                          31%
          Looked for competitive prices on products at retailers online other
                                    than Amazon
                                                                                                                                                                                                                                                                                                                                                                                       29%
            Looked for competitive prices on comparison shopping engines
                           (Price Grabber, Shopping.com)
                                                                                                                                                                                                                                                                                                                                                                                     27%

                                                                                Checked a store’s inventory for a product of interest                                                                                                                                                                                                                                            26%
         Looked up prices on the retailer’s mobile site where I was intending
                                        to buy
                                                                                                                                                                                                                                                                                                                                                                               24%

11	


Top Uses of Mobile Phones While In Physical Stores

         We now turn to usage within the retail environment. Customers are no longer captive but still
         on the hunt for deals. This may mean access to promotional coupons for immediate
         redemption or price shopping from an array of competitors. Information seeking is seen in
         both ratings and reviews and potentially the scanning of bar codes. The options are plentiful,
         as one in three shoppers has already taken advantage of their mobile phone within the store
         confines.

                                                                                                                                               How likely are you to do each of the following using your mobile phone
                                                                                                                                                   when researching a product while in a physical store? (Top-3)

                                      Access promotional coupons for redemption at the store                                                                                                                                                                                                                                                                                                 38%

                                                                                                                                                Look for competitive pricing at Amazon                                                                                                                                                                                                      36%

          Look for competitive prices on products at retailers online other
                                   than Amazon
                                                                                                                                                                                                                                                                                                                                                                                            36%

                                                                                                                                                       Check for product ratings and reviews                                                                                                                                                                                              35%

                                                            Scan bar codes and compare prices to other retailers                                                                                                                                                                                                                                                                          35%

          Look on a retailer’s website for product beyond what they carry
                                    in the store
                                                                                                                                                                                                                                                                                                                                                                                          35%

          Look up prices on the retailer’s mobile site where I am intending
                                       to buy
                                                                                                                                                                                                                                                                                                                                                                                      33%
             Scan bar codes to learn more about a specific product (i.e.
           product information, product images, video, customer reviews                                                                                                                                                                                                                                                                                                               33%
                                        etc.)
            Look for competitive prices on comparison shopping engines
                          (Price Grabber, Shopping.com)
                                                                                                                                                                                                                                                                                                                                                                                      32%

                                                                Scan QR codes and compare prices to other retailers                                                                                                                                                                                                                                                                 31%
              Scan QR codes to learn more about a specific product (i.e.
            product information, product images, video, customer reviews                                                                                                                                                                                                                                                                                                            31%
                                           etc.)
              Check in to take advantage of apps such as Shopkick or
           Foursquare that allow you to receive points, rewards or badges                                                                                                                                                                                                                                                                                                       28%
                            for visiting local retail stores
                                                                            Make a purchase on your phone at another retailer                                                                                                                                                                                                                                                 25%

12	


IV. User-Generated Content

         Introductory Premise

         “Shoppers rely more and more on user-generated or peer-based content including product
         reviews and ratings. We wish to understand more about how and where you use this
         content.”

         Food-for-Thought Questions

         The balance of this brief is centered on what and where user-generated content may be
         accessed. Additionally we sought to understand respondents’ willingness to be participants
         or bystanders relative to user-generated content.

      Would user-generated content continue to play an important role when conducting
       product research online?
      Is the consumer research dynamic still dominated by search to find the right product
       quickly?
      Knowing that efficiency and timesaving are core to the online value proposition, will
       Amazon and other dominant retailers become important “one-stop” destinations for
       finding product and comparing prices?

         Top Line Findings: User-Generated Content

         •   Amazon is the defacto site for product reviews and price checking

         •   Ratings and reviews remain the most critical product information desired by shoppers

         •   Behavioral differences are not seen relative to user-generated content among
             manufacturers and retailers

         Review Access by Site Type

         Reviews and Ratings are most frequently used on Amazon where they far outpace both retail
         websites at 45% and search engines at 41%. Both retailers and manufacturers should take
         notice of this finding as the concentration of usage is changing consumer shopping
         dynamics.

13	


Given that product reviews and ratings are playing a bigger role in researching and
                                                                     purchasing products online, please tell us how often you use reviews and ratings
                                                                             at each of the following locations. (Top-2: all the time/very often)

                                                                                                                                                                                                                                                                                                           Amazon.com                                                                                                     58%
Retailers’ websites (e.g. Wal-Mart, Best Buy, Home Depot, Nordstrom)                                                                                                                                                                                                                                                                                                                                              45%
                                                                                                                      Search Engines (e.g. Google, Bing, Yahoo)                                                                                                                                                                                                                                              41%
Manufacturers’ websites (e.g. HP, Ralph Lauren, Clinique, Nike, Lego)                                                                                                                                                                                                                                                                                                                                 32%
                                                                                                Review Sites (e.g. Buzzillions, Epinions, CNet)                                                                                                                                                                                                                                                 25%
                                                                                                                                                                                                                                                                                                                           Facebook                                                 11%
                                                                                                                                                                                                                                                                                                                             Twitter                                               7%

         User-generated Content Credibility

 User-generated content is considered the most credible on aggregators including Amazon,
 review sites, and search engines. They are perceived as being more unbiased than both
 retailers and manufacturers. I believe volume of reviews contributes to this credibility, as does
 the efficiency of perusing those reviews.
                                                                                                     Please tell us how credible (or trustworthy) you feel the user-generated content
                                                                                                               (e.g. customer reviews and ratings, recommendations, etc.)
                                                                                                         is from each of the following locations. (Top-2: extremely/very credible)

                                                                                                                                                                                                                                                                                                             Amazon.com                                                                                             63%

                                                                                            Review Sites (e.g. Buzzillions, Epinions, CNet)                                                                                                                                                                                                                                                                 51%

                                                                                                                  Search Engines (e.g. Google, Bing, Yahoo)                                                                                                                                                                                                                                                 50%

           Retailers (e.g. Wal-Mart, Best Buy, Home Depot, Nordstrom)                                                                                                                                                                                                                                                                                                                                   47%

               Manufacturers (e.g. HP, Ralph Lauren, Clinique, Nike, Lego)                                                                                                                                                                                                                                                                                                                        38%

                                                                                                                                                                                                                                                                                                                           Facebook                                                       21%

                                                                                                                                                                                                                                                                                                                             Twitter                                                    15%

    Future User-Generated Content Access

    Shoppers foresee little change in their behavior relative to user-generated content by
    location. This is interesting as it leaves little room for changing dynamics to have their desired
    impact. This is one of the questions we will ideally circle back to in next year’s survey.

14	


Given the amount of user-generated content (e.g. Review sites, Facebook, Twitter)
                                                                          available to you for researching and shopping online, how do you foresee your
                                                                        shopping behavior changing in the coming year relative to the following locations?

                         Retailers (e.g. Wal-Mart, Best Buy, Home Depot, Nordstrom)                                                                                                                                                                                                                                                                                                                     85%

                       Manufacturers (e.g. HP, Ralph Lauren, Clinique, Nike, Lego)                                                                                                                                                                                                                                                                                                                     84%

                                                                                                                                    Search Engines (e.g. Google, Bing, Yahoo)                                                                                                                                                                                                                    79%

                                                                                                              Review Sites (e.g. Buzzillions, Epinions, CNet)                                                                                                                                                                                                                              76%

                                                                                                                                                                                                                                                                                                                           Amazon.com                                                73%

                                                                                                                                                                                                                                                                                                                             Facebook                                               72%

                                                                                                                                                                                                                                                                                                                               Twitter                                             71%

         User Generated Content Availability

         Product reviews were ranked the most critical user-generated content for researching on a
         retailer’s site with Q/A following closely behind. It is also interesting to note that liking product,
         a relative newcomer to retail sites, has already surpassed both product likes and community
         forums. In my mind this emanates from its ease of use and one’s ability to connect with
         others, with only minimal commitment.

                                                                            Outside of the standard product information (images, descriptions, etc.)
                                                                          how important is finding the following user-generated content on a retailer’s
                                                                              site (e.g. Target, Best Buy, Pottery Barn) when researching online?
                                                                                                  (Top-2: critical/very important)

            Customer Product Reviews and Ratings (peer-generated product
                            reviews and related content)
                                                                                                                                                                                                                                                                                                                                                                                                         48%

            Q&A (customers asking and answering questions about products
                                       onsite)
                                                                                                                                                                                                                                                                                                                                                                                            31%

            Product “Likes” (# people who have “Liked” a particular product)                                                                                                                                                                                                                                                                                                         23%

            Product “Likes” by People You Know (people you know who also
                     “Like” a product you are considering buying)
                                                                                                                                                                                                                                                                                                                                                                                     22%

                                                         Community Forums (for conversations among customers
                                                                or between you and other customers)
                                                                                                                                                                                                                                                                                                                                                                                   18%

15	


User-Generated Content Participation

         Rating a product purchased sees the greatest participation among social activities (70%)
         though liking and sharing exceed 40% penetration. This follows closely in line with the prior
         question though it appears to have legs with 42% of respondents having shared with others
         regarding product. Elevated interest in liking is logical given the 75% penetration among
         EG100 sites. The real question is, can “liking” achieve the same status as product ratings
         have today? Certainly there is a distinct possibility as the tool has had limited time to
         resonate with shoppers and its presence on 36% of the EG100 sites is not nearly universal
         across retail sites.

                                                                                      When thinking about products or brands, how often do you participate in each
                                                                                         of the following activities? (Top-3: all the time/very often/sometimes)

                                                                                                                                                                                      Rate a product purchased                                                                                                                                                                        70%

                                               “Like” a retailer (e.g. Best Buy, Target, Crate &
                                                                                                                                                                                                                                                                                                                                                                                49%
                                                                     Barrel)
                                           “Like” a manufacturer (e.g. Apple, Lego, Under
                                                                                                                                                                                                                                                                                                                                                                                49%
                                                             Armour)
           “Share” with others product you have browsed on a
                                                                                                                                                                                                                                                                                                                                                                              42%
                                 website
               “Share” with others a product you have purchased
                                                                                                                                                                                                                                                                                                                                                                              43%
                                from a website

16	


V. Brief II – The Facebook Factor

         Consumers have once again embraced user-generation content. Its impact can be seen
         excessively across many devices and touch points. We look forward to exploring The
         Facebook Factor in Brief II along with other community elements that contribute to online
         social dynamics.

         Stay tuned.

17	


VI. About the Companies

         ABOUT THE E-TAILING GROUP

         The e-tailing group is a niche e-commerce consultancy that helps merchants deliver
         the right customer experience on their websites and across all of their channels while
         adeptly assisting technology companies to create and execute go-to-market
         strategies that simultaneously educate the retail community and deliver cost-
         effective thought leadership and lead generation. For more background about our
         research or for additional information on the e-tailing group, inc. please contact
         Lauren Freedman via email at LF@e-tailing.com, by phone to 773-975-7280 or visit the
         e-tailing group website www.e-tailing.com.

         ABOUT POWERREVIEWS

         PowerReviews is the leading provider of social commerce software-as-a-service
         solutions to global retailers and brands. The company's unique structured data
         approach to collecting, organizing, and analyzing user-generated content
         significantly boosts product sales and customer engagement. PowerReviews is live on
         over 5,000 websites - across 13 languages in 21 countries - including Staples,
         Drugstore.com, Room & Board, ESPN, Neutrogena, Quicksilver, and Jockey.

18	


You can also read