PROPERTY COMPENDIUM 2020 - AWS
←
→
Page content transcription
If your browser does not render page correctly, please read the page content below

PROPERTY COMPENDIUM 2020

Contents
About Kiwi Property

Kiwi Property (NZX: KPG) is one of the largest
listed property companies on the New Zealand
Stock Exchange and is a member of the
S&P/NZX 20 Index.

We’ve been creating the spaces that Kiwis love
                                                                             Portfolio Overview   Pg 2
for over 25 years, with expertise in property
investment, development and asset management.
                                                                             Mixed-use Overview   Pg 8
We proudly own and manage $3.1 billion in direct
property investments, and we manage properties
valued at over $350 million for third party clients.                         Retail Overview      Pg 16
Our properties are diverse environments that
connect and engage people through great                                      Office Overview      Pg 24
experiences; spaces where New Zealanders can
work, shop, live and play, and where communities
come together.

As we move forward, we will continue to focus
on maintaining our existing assets while seeking
growth through value-added initiatives, such
as redevelopments and refurbishments, and
intensifying our larger properties by creating
mixed-use communities. We will also continue
to examine acquisition opportunities to further
strengthen our investment portfolio and, over
time, through the establishment of new funds
and investment partnerships.

All data in this document is for the year ended and/or as at 31 March 2020
unless otherwise specified. Due to rounding, numbers within this report
may not add up precisely to the totals provided and percentages may
not precisely reflect the absolute figures.

Due to COVID-19, we have been unable to collect retail sales data
for the month of Mar-20. All retail sales and pedestrian count statistics
are therefore. shown for the year ended 29 February 2020.

This Property Compendium should be read in conjunction with the
2020 Kiwi Property Annual Report, which is available on our website,
kp.co.nz/annual-result

                                                                                                          1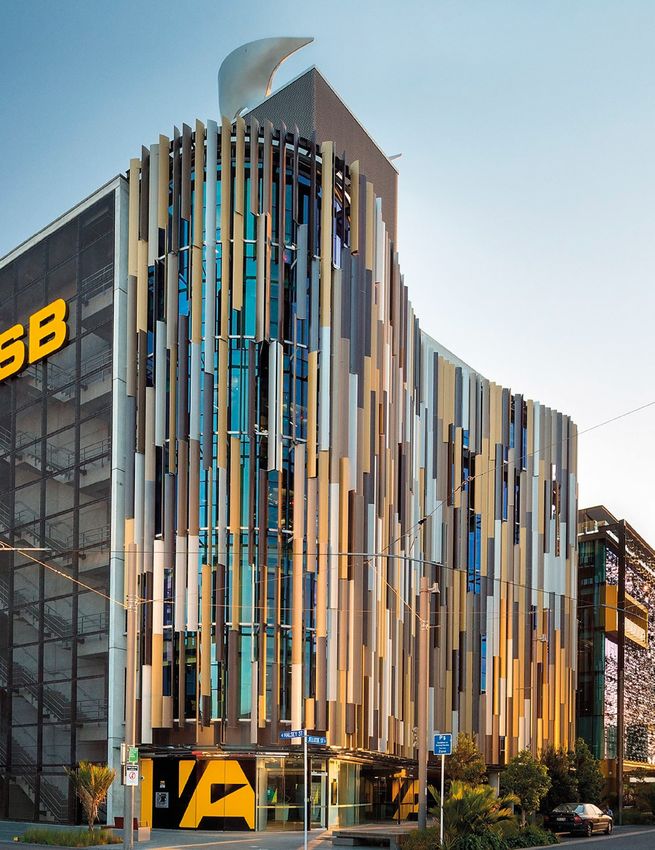
Portfolio Overview
We own a diverse mix of property assets, from
direct retail and office investments, to larger
properties that we will continue to develop                                                                                                                       $2.27b
                                                     $240m
                                                                                                                                                                  Auckland
into mixed-use communities over time. These                                                                                                                       3 mixed-use assets
communities have the potential to support a          Hamilton
                                                                                                                                                                  1 retail asset
                                                                                                                                                                  2 office assets
range of complementary asset types, including        1 mixed-use asset

retail, office, entertainment, personal services,    1 retail asset

hotels, civic buildings and more.
                                                     $170m
                                                     Palmerston North
                                                     1 retail asset
                                                                                                                                                                  $227m
We have a strong bias to Auckland                                                                                                                                 Wellington
and the golden triangle.                                                                                                                                          2 office assets
We favour these locations because
of their superior prospects for economic,
population and employment growth.                                                                                                                                 $202m
                                                                                                                                                                  Christchurch
We have a diversified portfolio
                                                                                                                                                                  1 retail asset
of high-quality property.
We target prominent mixed-use and retail
properties that are:

 	in locations favoured by the Auckland
   Unitary Plan.
                                                                                                                                                                      The values noted here
 	located in regions outside of Auckland                                                                                                                             include other properties
   with positive growth prospects.                                                                                                                                    and development land
                                                                                                                                                                      with a combined value
                                                                                                                                                                      of $215 million
We target office assets that are:

 	located in Auckland and comprise
   prime-quality buildings.

 	located in Wellington and are subject
   to long-term leases to the Crown.                 Geographic diversification                       by portfolio value   Sector diversification                                by portfolio value

Third party management.
                                                                                    Auckland                     73%
We also manage properties for third parties                                                                                                              Mixed-use                           48%
                                                                                    Hamilton                     8%
and joint owners to diversify our revenue                                                                                                                Retail                              16%
streams and leverage our management platform.                                       Wellington                   7%
                                                                                                                                                         Office                              29%
                                                                                    Christchurch                 7%
                                                                                                                                                         Other                               7%
                                                                                    Palmerston North             5%

                                                    Geographic Diversification p5                                            Sector Diversification p5

2     KIWI PROPERTY — PROPERTY COMPENDIUM 2020                                                                                                                                                     3
Portfolio Overview
Our tenant base is We have long-term,
strong and diverse. locked-in revenues.
Our portfolio is well diversified by tenant type Our weighted average lease expiry (WALE)
and industry. Our 20 largest tenants comprise indicates how long, on average, our portfolio
respected companies, government departments income is ‘locked-in’. Our portfolio WALE is
and successful retail chains. Collectively they 4.9 years, underpinned by our office portfolio
occupy 52% of our portfolio by area and contribute which has a solid WALE of 8.7 years with long-term
40% of our portfolio gross income with a weighted leases in place across most of these assets.
average lease expiry of 7.2 years. Our mixed-use and retail portfolios have WALEs
of 3.7 years and 3.2 years respectively. Shorter
WALEs on retail properties are expected as this
provides us the opportunity to keep our mix fresh
by constantly introducing new, on-trend retailers
or concepts.
Top 20 tenants by investment portfolio gross income Lease expiry profile by investment portfolio gross income
1 ASB Bank 7.0% 11 Just Group 1.6%
Vacant or
2 Ministry of Social Development 5.0% 12 Russel McVeagh 1.5% Holdover 6%
3 Farmers 2.7% 13 HOYTS Cinemas 1.5%
FY21 10%
4 ANZ Bank 2.3% 14 Kmart 1.5%
5 Progressive Enterprises 2.2% 15 Hallensteins / Glassons 1.4% FY22 14%
6 Bell Gully 1.9% 16 Craigs Investment Partners 1.0%
7 Foodstuffs 1.8% 17 BNZ 0.9% FY23 8%
8 Suncorp 1.8% 18 IAG 0.8%
FY24 10%
9 The Warehouse 1.8% 19 Rebel Sport / Briscoes 0.8%
10 Cotton On Clothing 1.7% 20 Tertiary Education Commission 0.8% FY25 12%
FY26+ 40%
0% 10% 20% 30% 40% 50%
Portfolio tenant mix by portfolio gross income
Mixed-use Retail Office
Type Mixed-use Retail Office Investment portfolio
Specialty stores 60% 67% 4% 47%
Mini-majors 20% 10% – 12%
Rent review structures by investment portfolio gross income
Department stores and DDS 6% 10% – 6%
Supermarkets 4% 8% – 4%
Cinemas 3% 2% – 2%
Home and living majors 1% 2% – 1% Fixed 63%
Government – – 26% 7%
Banking 3% – 24% 8% CPI-based 20%
Legal – – 20% 5%
Insurance 2% – 9% 3%
Market and other 17%
Financial services – – 10% 3%
Consultancy – – 1% 0%
Other 1% 1% 6% 2%
Rent reveiw structure p7
4 KIWI PROPERTY — PROPERTY COMPENDIUM 2020 5
Portfolio Overview
Property details                                                      Property metrics                                             Financial and operating metrics                   March 2020 valuation

  Property / Portfolio          Location              Ownership                 NLA              Tenants           Carparks         FY20 NOI1         Occupancy             WALE         Valuer           Value Capitalisation         10-year      Key tenants
                                                                                                                                       ($000)                              (years)                       ($000)           rate             IRR

  Mixed-use
  Sylvia Park2                  Auckland                    100%               84,714                  187             4,053               47,211            99.9%            3.8           JLL        982,000             5.50%           7.2%     ANZ, H&M, HOYTS Cinemas, IAG, Kmart, PAK’nSAVE, The Warehouse, Zara

  Sylvia Park Lifestyle         Auckland                    100%           16,550                       16               393               5,326            100.0%             1.9          JLL          74,300            6.25%           7.2%     Freedom Furniture, Spotlight, Torpedo7

  LynnMall                      Auckland                    100%               37,517                  141               1,319            19,301             99.7%            4.2       Colliers       245,000             6.63%          8.4%      Countdown, Farmers, Reading Cinemas

  The Base3                     Hamilton                     50%           85,910                      160             3,343               13,157            99.9%            3.3         CBRE         198,000             6.63%          8.0%      Farmers, HOYTS Cinemas, Mitre 10 Mega, The Warehouse

  Total Mixed-use                                                          224,691                    504               9,108            84,995              99.9%             3.7                    1,499,300            5.87%           7.5%

  Retail
  Westgate Lifestyle4           Auckland                    100%           25,622                       27                622             5,904             100.0%            4.3       Colliers         79,000            6.63%           7.8%     Briscoes, Freedom Furniture, Harvey Norman, Rebel Sport

  Centre Place North            Hamilton                    100%               15,788                   75               554               5,416              99.1%            2.7        CBRE          36,500             11.25%         11.0%     Lido Cinemas, METRO by HOYTS Cinemas

  The Plaza                     Palmerston North            100%           32,304                       99               1,251            16,961            100.0%            2.9         CBRE          170,000            8.25%          8.3%      Countdown, Farmers, Kmart

  Northlands                    Christchurch                100%               41,125                   117             1,663             19,805             98.8%            3.4           JLL         195,000            8.00%          8.3%      Countdown, Farmers, HOYTS Cinemas, PAK’nSAVE, The Warehouse

  Total Retail                                                             114,839                     318             4,090             48,086              99.4%            3.2                      480,500              8.11%         8.4%

  Office
  Vero Centre                   Auckland                    100%           39,544                       43               420              21,942              97.9%           6.0       Colliers       445,000             5.25%           7.4%     Bell Gully, Craigs Investment Partners, nib, Russell McVeagh, Suncorp

  ASB North Wharf               Auckland                    100%               21,625                   12                 97            12,900             100.0%            10.7          JLL        238,000             5.25%          6.8%      ASB Bank

  The Aurora Centre             Wellington                  100%           24,504                        4               308               8,652            100.0%            14.2        CBRE          170,300            6.00%           7.3%     Ministry of Social Development

  44 The Terrace                Wellington                  100%               10,325                    9                  –             3,095               99.1%            6.7        CBRE           57,100            6.38%           7.3%     Commerce Commission, Energy Efficiency and Conservation Authority, Tertiary Education Commission

  Total Office                                                             95,998                       68               825             46,589              99.0%             8.7                     910,400             5.46%           7.2%

  Total investment portfolio                                              435,528                     890             14,023             179,670             99.5%            4.9                    2,890,200              6.11%          7.5%

  Other properties
  Adjoining properties          Various                                                                                                   4,895                                         Various         154,650

  Development land              Auckland                                                                                                        –                                           JLL         60,000

  Other properties                                                                                                                        4,895                                                         214,650

  Total portfolio                                                                                                                      184,565                                                       3,104,850

1. Net operating income (NOI) is expressed inclusive of property management            2. Sylvia Park was valued ‘as if complete’ at $1.09 billion. The deduction                  3. Value and income statistics represent Kiwi Property’s 50% ownership interest.   4. Tenancies at Westgate Lifestyle subject to vendor rental underwrites
    fees, excludes rental income from straight-lining fixed rental increases                of outstanding development costs for the galleria and south carpark                          Other statistics reflect the entire asset.                                          are treated as occupied.
    ($1.2 million) and NZ IFRS 16 expense reclassifications ($1.0 million).                 ($84.9 million), together with allowances for profit and risk and
                                                                                            stabilisation ($23.2 million), resulted in an ‘as is’ value of $982 million.

6        KIWI PROPERTY — PROPERTY COMPENDIUM 2020                                                                                                                                                                                                                                                                                                   7
Mixed-use Overview      10
            Sylvia Park             12

Mixed-use   Sylvia Park Lifestyle
            LynnMall
                                    13
                                    14
            The Base                15

8                                        9
Mixed-use Overview 1
$1.499
Portfolio value Occupancy Property type by mixed-use portfolio value
b 99.9% Regional Centres
Large Format Centres
95%
5%
Weighted average lease expiry Geographic diversification
Property Type p13 by mixed-use portfolio value
3.7 Years
$85.0
Auckland 87%
Net operating income
m
Hamilton 13%
Annual sales 2 Tenant diversification
Geographic Diversification p13
by mixed-use portfolio value
$1.3b Specialty Stores
Mini-majors
Department Stores & DDS
60%
20%
6%
5.87
Supermarkets 4%
Banking 3%
Weighted average capitalisation rate Net lettable area (sqm) Cinemas 3%
Insurance 2%
% 224,691
Home and living majors 1%
Other 1%
Tenant Diversification pg 13
4 Number of assets 9,108 Carparks
504 Tenants 25.6 m Customer visits (annually)3
1. Includes ANZ Raranga office building which forms part of the Sylvia Park valuation.
2. Not all large format retail tenants report sales.
10 KIWI PROPERTY — PROPERTY COMPENDIUM 2020 3. Excluding large format retail centres. 11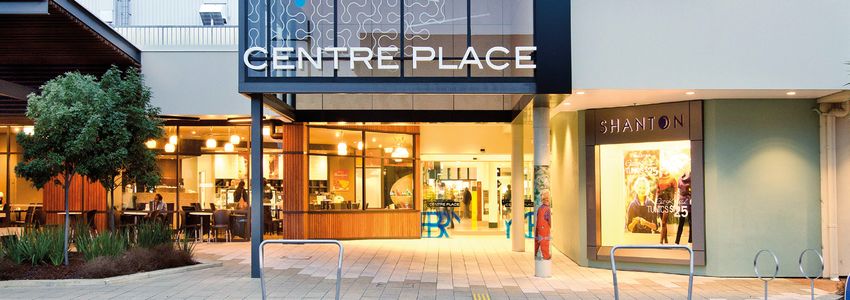
Sylvia Park                                                                                                                                    Sylvia Park Lifestyle
Sylvia Park, developed by Kiwi Property, has grown from                        Address                         Key tenants                     Sylvia Park Lifestyle is located on a prominent site adjacent                Address                         Key tenants
New Zealand’s largest shopping centre into a thriving                          286 Mount Wellington            ANZ                             to Auckland’s southern motorway. It comprises of a large                     393 Mount Wellington            Freedom Furniture
                                                                               Highway, Mount Wellington,      H&M                                                                                                          Highway, Mount Wellington,      Spotlight
mixed-use community, providing outstanding retail, dining,                     Auckland                        HOYTS Cinemas
                                                                                                                                               format retail centre constructed in 2011. It forms part of                   Auckland                        Torpedo7
entertainment, office and personal services. Recently we                                                       IAG                             the broader Sylvia Park mixed-use community and provides
                                                                               sylviapark.org                  Kmart                                                                                                        sylviapark.org
completed ‘ANZ Raranga’, a new 10-level office building.                                                       PAK’nSAVE
                                                                                                                                               customers with a broad, complementary and compelling
Sylvia Park’s growth story is continuing with a new ‘galleria’                                                 The Warehouse                   retail offer in this strong destination.
                                                                                                               Zara
retail level due to open from late-2020. Sylvia Park’s
unparalleled exposure and accessibility, including
ample parking and excellent public transport linkages,
has contributed to its success.

Property overview                                         Tenant diversification                                            By gross income   Property overview                                       Tenant diversification                                            By gross income

Ownership interest                     100%                                                        Specialty                          64%      Ownership interest                100%
Centre type                            Regional                                                    Mini-majors                        14%      Centre type                       Large Format
Date completed                         June 2007                                                   Banking                            6%       Date completed                    November 2011
Last refurbished/redeveloped           2018–2019                                                   Department Stores & DDS            6%       Last refurbished/redeveloped      N/A                                                            Mini-Majors                        93%
Net lettable area                      84,714 sqm                                                  Supermarkets                       3%       Net lettable area                 16,550 sqm                                                     Specialty                          7%
Tenants                                187                                                         Insurance                          3%       Tenants                           16
Carparks                               4,053                                                       Cinemas                            2%       Carparks                          393
                                                                                                   Other office                       1%
Property metrics                                                    Sylvia Park pg 14                                                          Property metrics                                            Sylvia Park lifestyle pg 15

Net operating income                   $47.2m             Lease expiry profile                                              By gross income   Net operating income              $5.3m                 Lease expiry profile                                              By gross income
Occupancy                              99.9%              Vacant or Holdover                                                          4%       Occupancy                         100.0%                Vacant or Holdover                                                          19%
Weighted average lease expiry          3.8 years          FY 2021                                                                     17%      Weighted average lease expiry     1.9 Years             FY 2021                                                                     2%
                                                          FY 2022                                                                     17%                                                              FY 2022                                                                     49%
Valuation metrics                                                                                                                              Valuation metrics
                                                          FY 2023                                                                     9%                                                               FY 2023                                                                     0%
Valuation                              $982.0m            FY 2024                                                                     9%       Valuation                         $74.3m                FY 2024                                                                     25%
Capitalisation rate                    5.50%              FY 2025                                                                     14%      Capitalisation rate               6.25%                 FY 2025                                                                     3%
10-year internal rate of return        7.2%               FY 2026+                                                                    31%      10-year internal rate of return   7.2%                  FY 2026+                                                                    2%

Sales performance

Annual sales                           $648m

12          KIWI PROPERTY — PROPERTY COMPENDIUM 2020                                                                                                                                                                                                                                 13
LynnMall The Base
LynnMall was New Zealand’s first shopping centre, having Address Key tenants The Base, located in Hamilton’s growing northern suburbs, Address Key tenants
opened in 1963, and has been delivering quality retail to 3058 Great North Road Countdown is New Zealand’s largest retail asset outside Auckland. Corner Te Rapa Road and Farmers
New Lynn, Auckland Farmers Wairere Drive HOYTS Cinemas
Auckland’s western suburbs ever since. In 2015 we expanded Reading Cinemas
It comprises both an enclosed regional shopping centre, Hamilton Mitre 10 Mega
the centre to incorporate an eight-screen Reading Cinemas lynnmall.co.nz Te Awa, as well as large format retailing. The Base offers The Warehouse
the-base.co.nz
complex and ‘The Brickworks’ dining precinct. The centre potential to grow into an exciting mixed-use destination
provides a compelling and convenient shopping, dining with redevelopment land that allows for a range of future
and entertainment destination in the developing town centre uses including office and entertainment. Kiwi Property
of New Lynn. LynnMall’s proximity to public transport and is proudly partnering with Tainui Group Holdings in a
‘Metropolitan Centre’ zoning provides future potential to 50:50 joint venture.
develop the centre to a greater intensity, in line with our
mixed-use vision.
Property overview Tenant diversification By gross income Property overview Tenant diversification By gross income
Ownership interest 100% Ownership interest 50%
Centre type Regional Specialty Stores 69% Centre type Regional
Specialty Stores 50%
Date completed December 2010 Mini-majors 11% Date completed May 2016
Mini-majors 29%
Last refurbished/redeveloped 2015 Supermarkets 9% Last refurbished/redeveloped 2018
Department stores & DDS 12%
Net lettable area 37,517 sqm Department Stores & DDS 6% Net lettable area 85,910 sqm
Home and Living Majors 5%
Tenants 141 Cinemas 4% Tenants 160
Cinemas 4%
Carparks 1,319 Other Retail 1% Carparks 3,343
Property metrics Lyn Mall pg 16 Property metrics Base pg 17
Net operating income $19.3m Lease expiry profile By gross income Net operating income $13.2m Lease expiry profile By gross income
Occupancy 99.7% Vacant or Holdover 4% Occupancy 99.9% Vacant or Holdover 6%
Weighted average lease expiry 4.2 years FY 2021 9% Weighted average lease expiry 3.3 years FY 2021 14%
FY 2022 16% FY 2022 11%
Valuation metrics Valuation metrics
FY 2023 9% FY 2023 26%
Valuation $245.0m FY 2024 17% Valuation $198.0m FY 2024 6%
Capitalisation rate 6.63% FY 2025 11% Capitalisation rate 6.63% FY 2025 8%
10-year internal rate of return 8.4% FY 2026+ 34% 10-year internal rate of return 8.0% FY 2026+ 29%
Sales performance Sales performance
Annual sales $306m Annual sales $365m
14 KIWI PROPERTY — PROPERTY COMPENDIUM 2020 15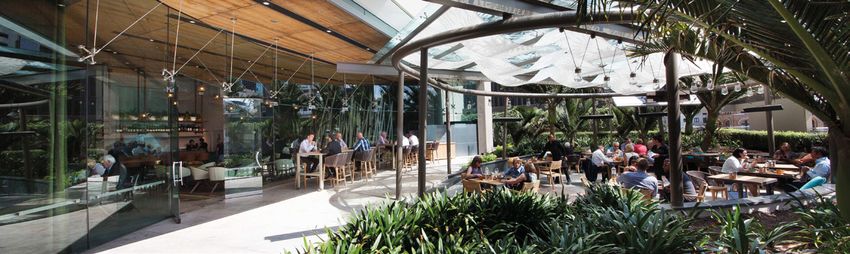
Retail Overview      18
         Westgate Lifestyle   20

Retail   Centre Place North
         The Plaza
                              21
                              22
         Northlands           23

16                                 17
Retail Overview
$481
Portfolio value Occupancy Property type by retail portfolio value
m 99.4%
Regional Centres
Large Format Centres
Sub-Regional Centres
76%
16%
8%
Weighted average lease expiry Geographic diversification by retail portfolio value
Property Type p21
3.2 Years
$48.1
Christchurch 41%
Palmerston North 35%
Net operating income
m
Auckland 16%
Hamilton 8%
Annual sales 1 Tenant diversification
Geographic Diversification p21
by retail portfolio value
$660 m Specialty Stores
Mini-majors
67%
10%
8.11
Department Stores & DDS 10%
Supermarkets 8%
Weighted average capitalisation rate Net lettable area (sqm)
Cinemas 2%
%
Home and living majors 2%
114,839
Other 1%
Tenant Diversification pg 21
4 Number of assets 4,090 Carparks
318 Tenants 19.7 m Customer visits (annually)2
1. Not all large format retail tenants report sales.
18 KIWI PROPERTY — PROPERTY COMPENDIUM 2020 2. Excluding large format retail centres. 19Westgate Lifestyle Centre Place North
Westgate Lifestyle forms part of the Westgate Town Centre Address Key tenants Centre Place North is Hamilton CBD’s destination for Address Key tenants
development off the north-western motorway in Auckland. 57-61 Maki Street Briscoes food, fashion and entertainment. The centre features both 501 Victoria Street Lido Cinemas
Westgate, Auckland Freedom Furniture Hamilton METRO by HOYTS Cinemas
The centre provides 27 large format retail stores featuring Harvey Norman
Lido and METRO by HOYTS cinema complexes, together
a range of home and living retailers, and is located in a high westgatelifestyle.co.nz Rebel Sport with a good range of indoor and outdoor dining options. centreplace.co.nz
residential growth area. The centre is adjacent to Centre Place South which was
sold in 2016 but continues to be managed by Kiwi Property
for its owners.
Property overview Tenant diversification By gross income Property overview Tenant diversification By gross income
Ownership interest 100% Ownership interest 100%
Centre type Large format Centre type Sub-regional
Date completed September 2015 Mini-majors 64% Date completed December 1994 Specialty Stores 83%
Last refurbished/redeveloped N/A Home and Living Majors 20% Last refurbished/redeveloped 2011 Mini-majors 8%
Net lettable area 25,622 sqm Specialty 13% Net lettable area 15,788 sqm Cinemas 8%
Tenants 27 Other Retail 3% Tenants 75 Other Retail 1%
Carparks 622 Carparks 554
Property metrics Westgate lifestye Property metrics Central place north
Net operating income $5.9m Lease expiry profile By gross income Net operating income $5.4m Lease expiry profile By gross income
Occupancy 100% Vacant or Holdover 0% Occupancy 99.1% Vacant or Holdover 21%
Weighted average lease expiry 4.3 years FY 2021 0% Weighted average lease expiry 2.7 years FY 2021 11%
FY 2022 2% FY 2022 13%
Valuation metrics Valuation metrics
FY 2023 29% FY 2023 7%
Valuation $79.0m FY 2024 9% Valuation $36.5m FY 2024 24%
Capitalisation rate 6.63% FY 2025 17% Capitalisation rate 11.25% FY 2025 10%
10-year internal rate of return 7.8% FY 2026+ 43% 10-year internal rate of return 11.0% FY 2026+ 15%
Sales performance
Annual sales $89m
20 KIWI PROPERTY — PROPERTY COMPENDIUM 2020 21The Plaza Northlands
The Plaza is Manawatu’s premium shopping destination, Address Key tenants Northlands is one of New Zealand’s largest enclosed shopping Address Key tenants
located in the heart of Palmerston North’s CBD. The centre 84 The Square Countdown centres and has been servicing its Christchurch catchment 55 Main North Road Countdown
Palmerston North Farmers Papanui, Auckland Farmers
extends over 32,000 sqm with around 100 shops providing Kmart
for more than 50 years. This single-level regional shopping HOYTS Cinemas
a wide mix of fashion, food, services and general retailing. theplaza.co.nz centre has been progressively redeveloped over many years northlands.co.nz PAK’nSAVE
The Warehouse
to meet demand and demographic shifts. In 2018 we completed
Langdons Quarter, a new food precinct at the southern end
of the centre which provides a range of food and beverage
options and complements the adjacent HOYTS Cinemas.
Property overview Tenant diversification By gross income Property overview Tenant diversification By gross income
Ownership interest 100% Ownership interest 100%
Centre type Regional Centre type Regional
Specialty Stores 67%
Date completed August 1993 Specialty Stores 78% Date Acquired (Constructed 1967) March 1994 / March 1998
Supermarkets 16%
Last refurbished/redeveloped 2010 Department Stores & DDS 16% Last refurbished/redeveloped 2018
Department Stores & DDS 10%
Net lettable area 32,304 sqm Supermarkets 5% Net lettable area 41,125 sqm
Mini-Majors 4%
Tenants 99 Mini-Majors 1% Tenants 117
Cinemas 3%
Carparks 1,251 Carparks 1,663
Property metrics The Plaza Property metrics Northlands
Net operating income $17.0m Lease expiry profile By gross income Net operating income $19.8m Lease expiry profile By gross income
Occupancy 100.0% Vacant or Holdover 11% Occupancy 98.8% Vacant or Holdover 9%
Weighted average lease expiry 2.9 years FY 2021 14% Weighted average lease expiry 3.4 years FY 2021 15%
FY 2022 29% FY 2022 16%
Valuation metrics Valuation metrics
FY 2023 12% FY 2023 5%
Valuation $170.0m FY 2024 12% Valuation $195.0m FY 2024 16%
Capitalisation rate 8.25% FY 2025 8% Capitalisation rate 8.00% FY 2025 18%
10-year internal rate of return 8.3% FY 2026+ 14% 10-year internal rate of return 8.3% FY 2026+ 21%
Sales performance Sales performance
Annual sales $233m Annual sales $338m
22 KIWI PROPERTY — PROPERTY COMPENDIUM 2020 23Office Overview 26
Vero Centre 28
Office ASB North Wharf
The Aurora Centre
29
30
44 The Terrace 31
24 25Office Overview
$910
Portfolio value Occupancy Property type by office portfolio value
m 99.0%
Premium
A-Grade Campus
A-Grade
B-Grade
49%
26%
19%
6%
Weighted average lease expiry Geographic diversification
Property Type p29 by office portfolio value
8.7 Years
$46.6
Auckland 75%
Net operating income
m
Wellington 25%
Net lettable area (sqm) Tenant diversification
Geographic Diversification p29
by office portfolio value
95,998 Government
Banking
Legal
26%
24%
20%
5.46
Financial Services 10%
Insurance 9%
Weighted average capitalisation rate Tenants Other Office 5%
Specialty Stores 4%
% 68
Consultancy 1%
Other 1%
Tenant Diversification pg 29
4 Number of assets 825 Carparks
26 KIWI PROPERTY — PROPERTY COMPENDIUM 2020 27Vero Centre ASB North Wharf
Vero Centre, completed in 2000, is our flagship office Address Key tenants ASB North Wharf is a showcase of environmental design Address Key tenants
asset and remains one of Auckland’s most prestigious 48 Shortland Street Bell Gully and innovative office space solutions. It is an award-winning, 12 Jellicoe Street ASB Bank
Auckland Craigs Investment Partners Auckland
office buildings, attracting and retaining some of nib
seven-level office building which was developed by Kiwi
the country’s most respected companies as tenants. Russell McVeagh Property for ASB Bank. ASB has a lease over all the office
Suncorp
The property has won numerous awards for excellence space until 2031. The waterfront location and striking
in design, construction and efficiency. The lobby was architecture have made it a landmark on the cityscape,
comprehensively upgraded in 2016. and it includes award-winning restaurants creating an
active frontage to North Wharf.
Property overview Tenant diversification By gross income Property overview Tenant diversification By gross income
Ownership interest 100% Legal 41% Ownership interest 100%
Building Grade Premium Financial Services 21% Building Grade A-Grade Campus
Date Acquired (Constructed 2000) April 2001 Insurance 19% Date completed May 2013
Last refurbished/redeveloped 2016 Other Office 11% Last refurbished/redeveloped N/A Banking 90%
Net lettable area 39,544 sqm Banking 3% Net lettable area 21,625 sqm Specialty 10%
Typical Floorplate 1,200 sqm Consultancy 2% Typical Floorplate 4,000 sqm
Carparks 420 Specialty 1% Carparks 97
Government 1%
Property metrics Property metrics ASB North wharf
Vero Other retail 1%
Net operating income $21.9m Net operating income $12.9m Lease expiry profile By gross income
Occupancy 97.9% Lease expiry profile By gross income Occupancy 100.0% Vacant or Holdover 0%
Weighted average lease expiry 6.0 years Vacant or Holdover 2% Weighted average lease expiry 10.7 years FY 2021 0%
FY 2021 2% FY 2022 0%
Valuation metrics Valuation metrics
FY 2022 6% FY 2023 0%
Valuation $445.0m FY 2023 1% Valuation $238.0m FY 2024 2%
Capitalisation rate 5.25% FY 2024 6% Capitalisation rate 5.25% FY 2025 0%
10-year internal rate of return 7.4% FY 2025 24% 10-year internal rate of return 6.8% FY 2026+ 98%
FY 2026+ 59%
28 KIWI PROPERTY — PROPERTY COMPENDIUM 2020 29The Aurora Centre 44 The Terrace
The Aurora Centre is a mainstay accommodation option Address Key tenants 44 The Terrace is well located within the Wellington Address Key tenants
for the New Zealand Government with all the office space 56 The Terrace Ministry of Social parliamentary sector and provides 10,000 sqm of 44 The Terrace Commerce Commission
Wellington Development Wellington
leased to the Ministry of Social Development until 2034. efficient office space over 12 levels. All office floors Energy Efficiency and
Conservation Authority
A comprehensive refurbishment and seismic strengthening are leased by government tenants mostly on long-term Tertiary Education
project completed in 2016. leases. A comprehensive refurbishment and seismic Commission
strengthening project completed in 2017.
Property overview Tenant diversification By gross income Property overview Tenant diversification By gross income
Ownership interest 100% Ownership interest 100%
Building Grade A-Grade Building Grade B-Grade
Date Acquired (constructed 1968) April 2004 Date Acquired (Constructed 1987) September 2004
Last refurbished/redeveloped 2014 – 2016 Government 98% Last refurbished/redeveloped 2015 – 2017 Government 92%
Net lettable area 24,504 sqm Specialty 2% Net lettable area 10,325 sqm Specialty 8%
Upper — 1,100 sqm Typical Floorplate 800 sqm
Typical Floorplate
Lower — 1,800 sqm Carparks 0
Carparks 308
The Aurora centre Property metrics 44 The Terrace
Property metrics Lease expiry profile By gross income Net operating income $3.1m Lease expiry profile By gross income
Net operating income $8.7m Vacant or Holdover 0% Occupancy 99.1% Vacant or Holdover 2%
Occupancy 100% FY 2021 0% Weighted average lease expiry 6.7 years FY 2021 0%
Weighted average lease expiry 14.2 years FY 2022 0% FY 2022 1%
FY 2023 0% Valuation metrics FY 2023 7%
Valuation metrics FY 2024 0% Valuation $57.1m FY 2024 3%
Valuation $170.3m FY 2025 0% Capitalisation rate 6.38% FY 2025 0%
Capitalisation rate 6.00% FY 2026+ 100% 10-year internal rate of return 7.3% FY 2026+ 87%
10-year internal rate of return 7.3%
30 KIWI PROPERTY — PROPERTY COMPENDIUM 2020 31Disclaimer
Kiwi Property Group Limited has prepared this document. are not guarantees or predictions of future performance
By accepting this document and to the maximum extent and involve known and unknown risks and uncertainties and
permitted by law, you acknowledge and agree to the other factors, many of which are beyond the control of Kiwi
following matters. Property, and may involve significant elements of subjective
judgement and assumptions as to future events which may
No liability or may not be correct. There is no assurance or guarantee
Kiwi Property Group Limited, its advisers, affiliates, related that actual outcomes will not materially differ from these
bodies corporate, directors, officers, partners, employees forward-looking statements. A number of important
and agents (together ‘Kiwi Property’) expressly exclude factors could cause actual results or performance to differ
and disclaim any and all liability which may arise from this materially from the forward-looking statements. Investors
document, any information provided in connection with this should consider the forward-looking statements contained
document, any errors in or omissions from this document, in this document in light of this information. The forward-
from relying on or using this document or otherwise in looking statements are based on information available to
connection with this document. Kiwi Property as at the date of this document.
No representation Investment risk
Kiwi Property makes no representation or warranty, express An investment in the financial products of Kiwi Property
or implied, as to the accuracy, completeness, reliability Group Limited is subject to investment and other known
or sufficiency of the information in this document or the and unknown risks, some of which are beyond the control
reasonableness of the assumptions in this document. of Kiwi Property Group Limited. Kiwi Property Group
All images (including any dimensions) are for illustrative Limited does not guarantee its performance or the
purposes only and are subject to change at any time and performance of any of its financial products unless and
from time to time without notice. to the extent explicitly stated in a prospectus or product
disclosure statement or other offering document.
Not advice
This document does not constitute advice of any kind No duty to update
whatsoever (including but without limitation investment, Statements made in this document are made only as the
financial, tax, accounting or legal advice) and must not be date of this document unless another date is specified.
relied upon as such. This document is intended to provide Except as required by law or regulation (including the
general information only and does not take into account NZX Listing Rules), Kiwi Property undertakes no obligation
your objectives, situation or needs. You should assess to provide any additional or updated information or revise
whether the information in this document is appropriate or reaffirm the information in this document whether
for you and consider talking to a professional adviser as a result of new information, future events, results or
or consultant. otherwise. Kiwi Property Group Limited reserves the right
to change any or all of the information in this document
Not an offer at any time and from time to time without notice.
This document is for information purposes only and is not
an invitation or offer of financial products for subscription, Caution regarding sales information
purchase or sale in any jurisdiction. This document is not Any sales information included in this document has been
a prospectus or product disclosure statement or other obtained from third parties or, where such information
offering document under New Zealand law or any other has not been provided by third parties, estimated by
law. This document does not constitute an offer to sell, Kiwi Property based on information available to it.
or a solicitation of an offer to buy, any securities in the The sales information has not been independently verified.
United States and will not be lodged with the The sales information included in this document will not
U.S Securities Exchange Commission. be complete where third parties have not provided
complete sales information and Kiwi Property has not
Past performance estimated sales information. You are cautioned that this
Past performance information given in this document document should not be relied upon as a representation,
is given for illustrative purposes only and should not be warranty or undertaking in relation to the currency,
relied upon as (and is not) an indication or guarantee accuracy, reliability or completeness of the sales
of future performance. information contained in this document.
Future performance Copyright
This document contains certain “forward-looking The copyright of this document and the information
statements” such as indications of, and guidance on, contained in it is vested in Kiwi Property Group Limited.
future earnings and financial position and performance. This document should not be copied, reproduced
Forward-looking statements can generally be identified or redistributed without the prior written consent
by the use of forward-looking words such as, ‘expect’, of Kiwi Property Group Limited.
‘anticipate’, ‘likely’, ‘intend’, ‘could’, ‘may’, ‘predict’, ‘plan’,
‘propose’, ‘will’, ‘believe’, ‘forecast’, ‘estimate’, ‘target’, Real Estate Agents Act 2008
‘outlook’, ‘guidance’ and other similar expressions. The Kiwi Property Group Limited is licensed under
forward-looking statements contained in this document the Real Estate Agents Act 2008.
32 KIWI PROPERTY — PROPERTY COMPENDIUM 2020kp.co.nz
You can also read