Earnings and employment from Pay As You Earn Real Time Information, UK: May 2021
←
→
Page content transcription
If your browser does not render page correctly, please read the page content below
Statistical bulletin

Earnings and employment from Pay As You
Earn Real Time Information, UK: May 2021
Experimental monthly estimates of payrolled employees and their pay from HM
Revenue and Customs’ (HMRC’s) Pay As You Earn (PAYE) Real Time Information
(RTI) data. This is a joint release between HMRC and the Office for National Statistics
(ONS).

Contact:                          Release date:       Next release:
Debra Leaker, Christopher         18 May 2021         15 June 2021
Robinson
labour.market@ons.gov.uk;
rtistatistics.enquiries@hmrc.gov.
uk
+44 (0)1633 455400                Table of contents
                                  1. Main points

2. Payrolled employees

3. Median monthly pay

4. Pay distribution

5. Regional data

6. Industry data

7. Age data

8. Earnings and employment data

9. Glossary

10. Measuring the data

11. Strengths and limitations

12. Related links

                                                                                     Page 1 of 22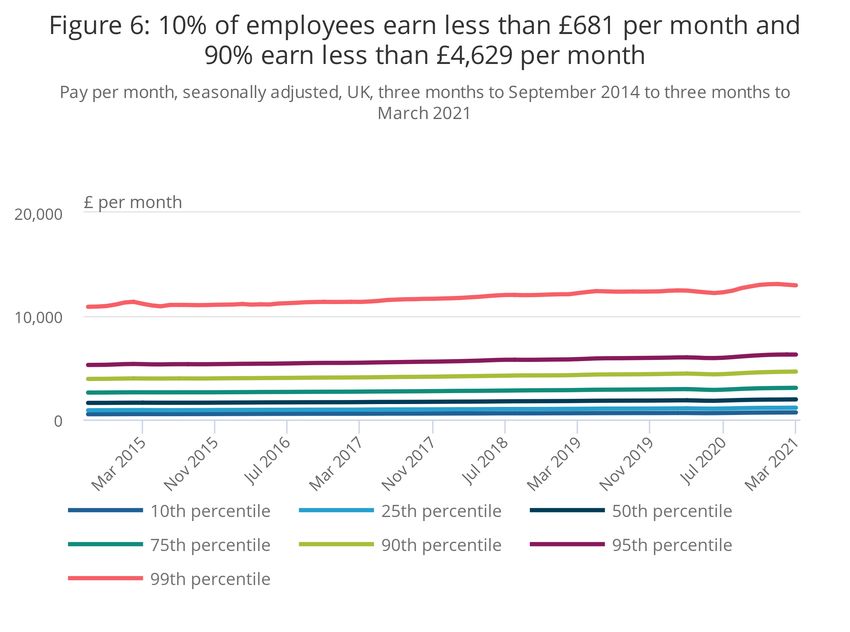
1 . Main points

      Early estimates for April 2021 indicate that the number of payrolled employees fell by 0.9% compared with
      April 2020, which is a fall of 257,000 employees.

      In April 2021, 97,000 more people were in payrolled employment when compared with March 2021.

      Early estimates for April 2021 indicate that median monthly pay increased by 9.8%, compared with the
      same period of the previous year.

      There was a 289,000 decrease in payrolled employees aged younger than 25 years between April 2020
      and April 2021.

      Annual growth in payrolled employees in April 2021 was the highest in Cornwall and Isles of Scilly (a rise
      of 0.8%) and lowest in North Eastern Scotland (a fall of 4.1%).

      The increase in payrolled employees between April 2020 and April 2021 was largest in the health and
      social work sector (a rise of 161,000 employees) and smallest in the accommodation and food services
      sector (a fall of 275,000).

      Annual growth in median pay for employees in April 2021 was highest in the arts and entertainment sector
      (an increase of 19.1%) and lowest in the households sector (an increase of 1.7%).

Annual growth rates for April 2021 are compared against April 2020, and therefore the reduction in employees
and median pay seen following the beginning of the coronavirus (COVID-19) pandemic is no longer contributing
to the annual growth rate. Annual growth rates are now compared against this lower baseline.

About the data in this release

Early estimates for April 2021 are provided to give an indication of the likely level of employees as well as median
pay in the latest period. The figures for April 2021 are based on around 85% of information being available. They
are considered of lower quality and may be subject to revision in next month’s release when between 98% to
99% of data will be available. This work was introduced in April 2020, in response to the coronavirus (COVID-19)
and methods will continue to be developed. A revisions triangle is available for employees and median pay at the
UK level.

This release covers people paid through the Pay As You Earn (PAYE) system where their pay is reported through
the Real Time Information (RTI) system. As employees who are furloughed as part of the Coronavirus Job
Retention Scheme (CJRS) programme should still have their payments reported through this system, they should
feature in these data and contribute toward the employment and pay statistics for the relevant periods.

Statistics in this release are based on people who are employed in at least one job paid through PAYE, and
monthly estimates reflect the average of such people for each day of the calendar month. This follows the
introduction of a new methodology in December 2019, designed to better align with international guidelines for
labour market statistics. This differs from the methodology used prior to December 2019, which produced
statistics based on the total number of people paid in a particular time period.

2 . Payrolled employees

Early estimates for April 2021 indicate that there were 28.3 million payrolled employees (Figure 1), a fall of 0.9%
compared with the same period of the previous year and a decline of 257,000 people over the 12-month period.
Compared with the previous month, the number of payrolled employees increased by 0.3% in April 2021 –
equivalent to 97,000 people.

                                                                                                               Page 2 of 22
Figure 1: The number of employees declined between February and November 2020, but has risen
slightly more recently
Payrolled employees, seasonally adjusted, UK, July 2014 to April 2021
Source: HM Revenue and Customs – Pay As You Earn Real Time Information
Notes:
1. The latest period, highlighted in orange, is based on early data and therefore is more likely to be subject to
slightly more significant revisions.
2. The March 2021 figure is not a flash estimate of payrolled employees, this is included purely for graphing
purposes.
Annual growth in the number of employees remained broadly within a range of 1.0% to 1.5% from mid-2016 until
2019. Growth rates prior to mid-2016 were higher than 1.5% (Figure 2). Starting around early 2019, employee
growth began a slight downward trend. However, employee growth slowed more substantially past March 2020,
(becoming negative in April 2020) coinciding with the coronavirus (COVID-19) pandemic. Early estimates show
that since the start of 2021 growth rates have started to recover on the lower rates seen since the pandemic, but
still remain negative. However, a component of this recovery is because of the reduction in employees between
March and April 2020 no longer contributing to the annual growth rate.
Page 3 of 22Figure 2: Growth in the number of payrolled employees fell recently, becoming negative in April 2020
Percentage change on same month in previous year, seasonally adjusted, UK, July 2015 to April 2021
Source: HM Revenue and Customs – Pay As You Earn Real Time Information
Notes:
1. The latest period, highlighted in orange, is based on early data and therefore is more likely to be subject to
slightly more significant revisions.
2. The March 2021 figure is not a flash estimate of payrolled employees, this is included purely for graphing
purposes.
3 . Median monthly pay
Early estimates for April 2021 indicate that median monthly pay increased to £1,967, an increase of 9.8%
compared with the same period of the previous year.
Page 4 of 22Figure 3: Median pay decreased sharply in April 2020, but has returned to the previous trend since
August 2020
Median pay per month, seasonally adjusted, UK, July 2014 to April 2021
Source: HM Revenue and Customs – Pay As You Earn Real Time Information
Notes:
1. The latest period, highlighted in orange, is based on early data and therefore is more likely to be subject to
slightly more significant revisions.
2. The March 2021 figure is not a flash estimate of median pay, this is included purely for graphing purposes.
Following a general trend of increasing pay growth between mid-2015 and mid-2018, pay growth tended to
fluctuate around 3.6% (Figure 4). Pay growth for April and May 2020 became negative, coinciding with the
coronavirus (COVID-19) pandemic as well as related economic and policy responses. More recently, median pay
growth has increased, and is now above pre-coronavirus (February 2020) levels.
Page 5 of 22Figure 4: The rate of growth in median pay fell between March and May 2020, but is now higher than the
average growth before March 2020
Percentage change on same month in previous year, seasonally adjusted, UK, July 2015 to April 2021
Source: HM Revenue and Customs – Pay As You Earn Real Time Information
Notes:
1. The latest period, highlighted in orange, is based on early data and therefore is more likely to be subject to
slightly more significant revisions.
2. The March 2021 figure is not a flash estimate of median pay growth, this is included purely for graphing
purposes.
The relatively high level of pay growth between June and December 2020 is partially explained by lower levels of
inflows than usual during that period. As explored in the August and September bulletins, whilst the general trend
of pay growth is dominated by those continually employed, the mean pay of inflows tends to be around 40%
lower than mean pay for those continually employed – meaning inflows into payrolled employment tend to bring
down average pay and average pay growth. As inflows were relatively low between June 2020 and December
2020, this reduced the downward pressure on pay growth, which in turn increased median pay growth.
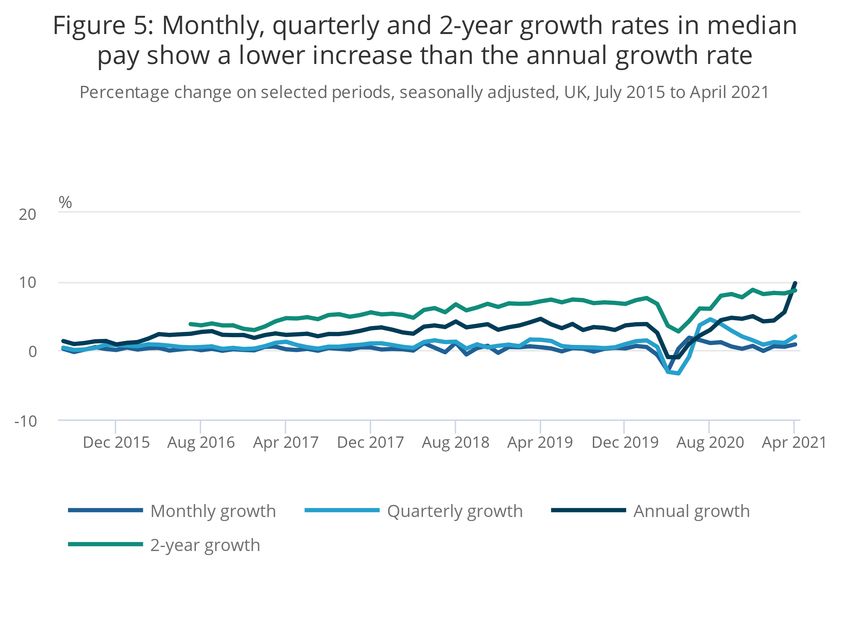
The high level of pay growth in April 2021 is attributed to the record high in median pay in April 2021, combined
with the suppressed level of median pay in April 2020 at the onset of the coronavirus (COVID-19) pandemic. The
advantage of considering median pay over a 12 month period is that the monthly variations are less volatile
compared with the annual level. However, where there are shocks to the labour market like this, it may be useful
to consider median pay growth over shorter time periods. Figure 5 illustrates the relative paths of monthly,
quarterly and annual pay growth. Pay growth over two years is also included to compare against pay in the same
month but prior to any COVID-19 pandemic effects. (The monthly, quarterly and two-year pay series have not
been annualised).
Page 6 of 22Figure 5: Monthly, quarterly and 2-year growth rates in median pay show a lower increase than the
annual growth rate
Percentage change on selected periods, seasonally adjusted, UK, July 2015 to April 2021
Source: HM Revenue and Customs – Pay As You Earn Real Time Information
Notes:
1. The latest period is based on early data and therefore is more likely to be subject to slightly more
significant revisions.
4 . Pay distribution
In the three months to March 2021, the 10th percentile of the monthly pay distribution was £681, the 90th
percentile was £4,629 and the 99th percentile was £12,966 (Figure 6). This means that 10% of payrolled
employees earned equal to or less than £681 per month, 90% earned equal to or less than £4,629, and 99%
earned equal to or less than £12,966.
Page 7 of 22Figure 6: 10% of employees earn less than £681 per month and 90% earn less than £4,629 per month
Pay per month, seasonally adjusted, UK, three months to September 2014 to three months to March 2021
Source: HM Revenue and Customs – Pay As You Earn Real Time Information
Notes:
1. Data for the 50th percentile (that is, the median) in this chart are based on three-month moving averages.
For this reason, they are not directly comparable with Figures 3 or 4 (which use data for a single month).
5 . Regional data
The regional figures in this bulletin are based on where employees live and not the location of their place of work.
They include data for April 2021, and cover Nomenclature of Territorial Units for Statistics: NUTS1 and NUTS2
regions.
While the UK as a whole has experienced moderate, if declining, payrolled employee growth since January 2017,
growth within regions has not been uniform (Figure 7).
Numbers of payrolled employees in the UK for the regions shown in Figure 7 range from 740,000 in Northern
Ireland to 3,976,000 in the South East in April 2021.
Figure 7: Regional employee growth has fallen across the UK over the last year
Page 8 of 22Percentage change on same month in previous year, seasonally adjusted, UK, January 2017 to April 2021
Notes:
1. The latest period is based on early data and therefore is more likely to be subject to slightly more
significant revisions.
Download the data
.xlsx
London and Northern Ireland experienced higher growth than the UK average between January 2017 and early
2020, while the North East and Scotland experienced lower growth than the UK overall. Going further, since
January 2019, Inner London (both West and East) experienced greater volatility in employee growth than both
Outer London and the UK average. Employee growth rates for NUTS2 regions are available in the datasets
published alongside this bulletin.
Since April 2020, all regions’ growth rates followed a similar pattern: rapidly declining and becoming negative
since April 2020, but beginning to improve again in the recent months. However, the magnitude of changes
varies. Comparing April 2021 with the same period of the previous year for NUTS1 regions, changes in payrolled
employees ranged from a 0.4% increase in the West Midlands to a 2.7% decrease in London. Examining NUTS2
regions, Inner London generally experienced sharper decreases in 2020 than Outer London (Figure 8). North
Eastern Scotland experienced a decrease of 4.1% in payrolled employees in comparison with April 2020, and
Cornwall and Isles of Scilly experienced a increase of 0.8%.
Figure 8: Growth in payrolled employees varies across the UK
Percentage change on same month in previous year, seasonally adjusted, UK, April 2021
Notes:
1. The latest period is based on early data and therefore is more likely to be subject to slightly more
significant revisions.
Download the data
.xlsx
Of the 257,000 decrease in payrolled employees since April 2020, 109,000 can be attributed to employees living
in London, 51,000 in the South East, while an increase of 10,000 can be attributed to employees living in the
West Midlands.
Median pay across the NUTS2 regions of the UK in April 2021 ranged from £1,678 in Cornwall and Isles of Scilly
to £2,980 in Inner London - West. Inner London generally differs from Outer London (Figure 9). Median pay in
April 2021 for London as a whole was £2,385.
Figure 9: Median pay varies across the UK
Page 9 of 22Median pay, seasonally adjusted, UK, April 2021
Notes:
1. The latest period is based on early data and therefore is more likely to be subject to slightly more
significant revisions.
Download the data
.xlsx
6 . Industry data
The industrial sectors in this bulletin are based on the UK Standard Industrial Classification (SIC) codes, as
defined by the Office for National Statistics (ONS). These codes have been determined from both the Inter-
Departmental Business Register and data from Companies House for each Pay As You Earn (PAYE) enterprise.
The findings from the 14 largest sectors are presented. The seven smaller sectors have been removed from the
bulletin for presentational purposes, but their estimates are available in the datasets published alongside this
bulletin.
The three largest sectors – wholesale and retail, health and social work, and education – account for more than
40% of UK employees. These three sectors combined with administrative and support services, manufacturing,
professional, scientific and technical, and accommodation and food services account for more than 70% of UK
employees.
Since January 2017, employee growth has not been uniform across sectors (Figure 10). Sectors such as
construction, transportation and storage, and information and communication experienced higher growth than the
UK average between January 2017 and early 2020, while sectors such as manufacturing, and wholesale and
retail experienced lower growth than the UK overall.
All sectors highlighted experienced a decrease in employee growth around April 2020, with the smallest decrease
being in health and social work.
Other sectors (administrative and support services, and finance and insurance in particular) have now joined
public administration and defence, and health and social work in having a positive growth rate. However, this will
partially be because of comparing against the suppressed levels of employees seen in April 2020.
Those sectors which have seen the most negative growth since April 2020, notably the arts and entertainment,
and accommodation and food services sectors, have seen sharp rises in the growth rate, but growth still remains
negative and substantially below other sectors.
When compared with the same period of the previous year, percentage changes in payrolled employees range
from negative 15.3% in arts and entertainment to positive 5.7% in administrative and support services.
Figure 10: Employee growth has been very different across sectors
Percentage change on same month in previous year, seasonally adjusted, UK, January 2017 to April 2021
Page 10 of 22Notes:
1. The latest period is based on early data and therefore is more likely to be subject to slightly more
significant revisions
Download the data
.xlsx
Of the 257,000 net decrease in payrolled employees since April 2020:
275,000 can be attributed to employees working in the accommodation and food services sector
148,000 in the wholesale and retail sector
fewer than 1,000 can be attributed to employees working in the professional, scientific and technical sector.
This decrease is net of an increase of 127,000 employees working in administrative and support services, and
161,000 employees in health and social work (Figure 11).
Page 11 of 22Figure 11: The accommodation and food services sector has seen the greatest decrease in payrolled
employees since April 2020
Payrolled employees, absolute change on April 2020, seasonally adjusted, UK, April 2021
Source: HM Revenue and Customs – Pay As You Earn Real Time Information
Notes:
1. The latest period is based on early data and therefore is more likely to be subject to slightly more
significant revisions.
Page 12 of 22Median pay in April 2021 across the highlighted sectors ranged from £1,013 in the accommodation and food
services sector to £3,113 in information and communication (Figure 12).
Figure 12: Median pay varies by industry
Median pay, seasonally adjusted, UK, April 2021
Source: HM Revenue and Customs – Pay As You Earn Real Time Information
Notes:
1. The latest period is based on early data and therefore is more likely to be subject to slightly more
significant revisions.
Page 13 of 22Compared with the same month in the previous year, median pay grew fastest in the arts and entertainment
sector (positive 19.1%, Figure 13) and slowest in the households sector (positive 1.7%).
Estimates of mean pay for each sector are available in the datasets published alongside this bulletin.
However, care needs to be taken when interpreting median pay growth. As explored in more detail in previous
bulletins, mean and median pay growth are influenced by the relative pay of those entering and leaving the labour
market. This means if the relative pay of inflows and outflows in particular sectors differ to the UK average,
median pay growth could be higher or lower in these sectors. For example, median pay growth could be lower if
outflows are higher paid than average, or conversely, could be higher if outflows are lower paid than average.
Similar principles apply for inflows. The high median pay growth in the arts and entertainment sector may be a
consequence of unusual relative pay of inflows or outflows in that sector.
Page 14 of 22Figure 13: Median pay increased most in the arts and entertainment sector
Percentage change on same month last year, seasonally adjusted, UK, April 2021
Source: HM Revenue and Customs – Pay As You Earn Real Time Information
Notes:
Page 15 of 221. The latest period is based on early data and therefore is more likely to be subject to slightly more
significant revisions.
2. The UK median is shown here for comparative purposes, but it does not represent an “average” of median
pay growth across the regions. It is statistically possible, for example, for median pay growth for the UK as
a whole to be higher or lower than pay growth in all constituent parts of the UK.
3. Changes in growth rates are affected by changes in the base period (a year ago) as well as changes in the
latest period.
7 . Age data
The age figures in this bulletin are calculated based on individuals’ age at the time they receive a payment.
Of the 28.3 million payrolled employees in the UK in April 2021, 95.4% are aged 18 to 64 years.
The overall 257,000 fall in UK employees between April 2020 and April 2021 is made up of:
289,000 employees aged under 25 years
89,000 employees aged 25 to 34 years
43,000 employees aged 35 to 49 years
This decrease is net of an increase of 118,000 aged 50 to 64 years (Figure 14) and 46,000 aged 65 years and
over.
Page 16 of 22Figure 14: The 18 to 24 years age group has seen the greatest decrease in payrolled employees since
April 2020
Payrolled employees, absolute change on April 2020, seasonally adjusted, UK, April 2021
Source: HM Revenue and Customs – Pay As You Earn Real Time Information
Notes:
1. The latest period is based on early data and therefore is more likely to be subject to slightly more
significant revisions.
The number of payrolled employees aged 50 years and over has increased at faster rates than the UK as a
whole since 2017 (Figure 15). Since 2019, this is particularly true for those aged 65 years and over, which saw
employee growth peak at 10.6% in January 2020. These periods of higher growth coincide with the phased
increase in State Pension age between March 2019 and September 2020, from 65 to 66 years for both men and
women. Conversely, growth in payrolled employees aged under 25 years has undergone long-term decline since
2017, particularly compared with the UK as a whole.
Since April 2020, annual employee growth has fallen to negative 25.5% for those aged under 18 years and
negative 5.7% for those aged 18 to 24 years. These two groups have had the largest falls in employees in
relative terms since the onset of the coronavirus (COVID-19) pandemic. Employee growth for those aged 65
years and over also fell sharply during April and May 2020, but recovered somewhat. Those aged 65 and over
years saw a rise in employee growth of 4.7% during this period.
Figure 15: Employee growth has fallen more sharply in younger age groups
Percentage change on same month in previous year, seasonally adjusted, UK, January 2017 to April 2021
Page 17 of 22Notes:
1. The latest period is based on early data and therefore is more likely to be subject to slightly more
significant revisions.
Download the data
.xlsx
Median pay in April 2021 ranged from £387 for those under 18 years to £2,291 for those aged 35 to 49 years
(Figure 16). Overall, median pay is higher in central age bands, of those studied.
Figure 16: Median pay varies by age
Median pay, seasonally adjusted, UK, April 2021
Source: HM Revenue and Customs – Pay As You Earn Real Time Information
Notes:
1. The latest period is based on early data and therefore is more likely to be subject to slightly more
significant revisions.
Page 18 of 228 . Earnings and employment data
Earnings and employment from Pay As You Earn Real Time Information, non-seasonally adjusted
Dataset | Released on 18 May 2021
Earnings and employment statistics from Pay As You Earn (PAYE) Real Time Information (RTI)
(Experimental Statistics), non-seasonally adjusted.
Earnings and employment from Pay As You Earn Real Time Information, revision triangle
Dataset | Released on 18 May 2021
Revisions of earnings and employment statistics from Pay As You Earn (PAYE) Real Time Information (RTI)
(Experimental Statistics).
Earnings and employment from Pay As You Earn Real Time Information, seasonally adjusted
Dataset | Released on 18 May 2021
Earnings and employment statistics from Pay As You Earn (PAYE) Real Time Information (RTI)
(Experimental Statistics), seasonally adjusted.
9 . Glossary
Median monthly pay
Median monthly pay shows what a person in the middle of all employees would earn each month. The median
pay is generally considered to be a more accurate reflection of the “average wage” because it discounts the
extremes at either end of the scale.
National Minimum Wage and National Living Wage
The National Minimum Wage (NMW) is a minimum amount per hour that most workers in the UK are entitled to
be payrolled. There are different rates of minimum wage depending on a worker’s age and whether they are an
apprentice. The NMW applies to employees aged between 16 and 24 years. The government’s National Living
Wage (NLW) was introduced on 1 April 2016 and applies to employees aged 25 years and over.
On the Annual Survey of Hours and Earnings (ASHE) reference date in April 2020, the NMW and NLW rates
were:
£8.72 for employees aged 25 years and over
£8.20 for employees aged 21 to 24 years
£6.45 for employees aged 18 to 20 years
£4.55 for employees aged 16 to 17 years
£4.15 for apprentices aged 16 to 18 years and those aged 19 years or over who are in the first year of their
apprenticeship
Page 19 of 22Pay As You Earn
Pay As You Earn (PAYE) is the system employers and pension providers use to take Income Tax and National
Insurance contributions before they pay wages or pensions to employees and pensioners. This publication relates
to employees only and not pensioners. It was introduced in 1944 and is now the way most employees pay
Income Tax in the UK.
10 . Measuring the data
Data source and collection
The data for this release come from HM Revenue and Customs’ (HMRC’s) Pay As You Earn (PAYE) Real Time
Information (RTI) system. They cover the whole population rather than a sample of people or companies, and
they will allow for more detailed estimates of the population. The release is classed as Experimental Statistics as
the methodologies used to produce the statistics are still in their development phase. As a result, the series are
subject to revisions.
Coverage
This publication covers employees payrolled by employers only. It does not cover self-employment income or
income from other sources such as pensions, property rental and investments. Where individuals have multiple
sources of income, only income from employers is included.
The figures in this release are for the period July 2014 to April 2021 and are seasonally adjusted.
Upcoming changes
Future bulletins are planned to include additional statistics, such as more detailed geographic breakdowns,
industry and demographic breakdowns. The focus and timing of these will be informed by user feedback. Please
email rtistatistics.enquiries@hmrc.gov.uk if you would like to offer feedback on how the contents can be improved
in the future.
Methodology
An accompanying article contains more information on the calendarisation and imputation methodologies used in
this bulletin, alongside comparisons with other earnings and employment statistics and possible quality
improvements in the future.
11 . Strengths and limitations
Pre-release data
HM Revenue and Customs (HMRC) grants pre-release access to official statistics publications. As this is a joint
release, and in accordance with the HMRC policy, pre-release access has been granted to a number of people to
enable the preparation of statistical publications and ministerial briefing. Further details, including a list of those
granted access, can be found on HMRC’s website.
Page 20 of 22Experimental Statistics status
This is a joint experimental release between HMRC and the Office for National Statistics (ONS). The existing
monthly publications produced by the ONS remain the primary National Statistics for the labour market. The
intention is that these new statistics will also be updated on a monthly basis.
The release is classed as Experimental Statistics as the methodologies used to produce the statistics are still in
their development phase. This does not mean that the statistics are of low quality, but it does signify that the
statistics are new and still being developed. As the methodologies are refined and improved, there may be
revisions to these statistics.
Rather than waiting until the development work has been completed, the statistics are being published now to
involve potential users in developing the statistics. We hope that this encourages users to provide us with their
thoughts and suggestions on how useful the statistics are and what can be done to improve them. Comments can
be sent by email to rtistatistics.enquiries@hmrc.gov.uk.
More information about Experimental Statistics, including when they should be used and the differences between
them and National Statistics, is available.
Strengths of the data
As Pay As You Earn (PAYE) Real Time Information (RTI) data cover the whole population, rather than a sample
of people or companies, we are able to use these to produce estimates for geographic areas and other more
detailed breakdowns of the population. The methods for producing such breakdowns are under development and
we expect to include further statistics in a future release. These statistics can help inform decision-making across
the country. They also have the potential to provide more timely estimates than existing measures.
These statistics also have the potential to replace some of those based on surveys, which could reduce the
burden on businesses needing to fill in statistical surveys.
Imputation and revisions
A limitation of the calendarisation used is that the figures for pay and numbers of employees in month t depend
on payments made in month t plus 1. This means only around 80% of the data used in the calculation on month t
statistics are available at the end of each month.
Rather than wait until all those remaining payment returns have been received, we have decided to produce a
timelier measure of numbers of employees and median pay by imputing the values for missing returns. The data
on which the statistics are based were extracted at the beginning of May 2021, which means around 1% to 2% of
the data for March 2021 are imputed, while around 15% of the data for the “flash” April 2021 data are imputed. As
a result, the figures in future releases will be updated as new payment returns are received, and the imputation
payments can be replaced with actual data.
Starting with the December 2020 publication, we introduced a revisions policy. For each publication, we
incorporate new input data only for the latest two tax years. In May of each year, new input data will be
incorporated for the whole data time series. The benefit of introducing this revisions policy is that we are able to
use the processing time saved to produce and publish more detailed breakdowns.
Page 21 of 22Seasonal adjustment
The seasonal adjustment applied in this bulletin follows established best practice. This approach assumes that
any seasonal patterns remain broadly consistent over time. If the seasonal pattern changes in strength, this will
be represented as greater volatility in the seasonally adjusted figures. Both the seasonal and non-seasonally
adjusted data sets are released alongside this bulletin.
Differences compared with the Labour Force Survey and Average Weekly
Earnings statistics
Further information about the methodology used and comparisons with the ONS’s Labour Force Survey (LFS)
and Average Weekly Earnings can be found in New methods for monthly earnings and employment estimates
from Pay As You Earn Real Time Information (PAYE RTI) data: December 2019.
Comparison of labour market data sources shows the strengths and weaknesses of these sources and other
labour market data sources, including the advantages of new administrative data sources and limitations of some
of our published figures.
12 . Related links
Labour market overview: May 2021
Bulletin | Released 18 May 2021
Estimates of employment, unemployment, economic inactivity and other employment-related statistics for
the UK.
Employment in the UK: May 2021
Bulletin | Released 18 May 2021
Estimates of employment, unemployment and economic inactivity for the UK.
Labour market in the regions of the UK: May 2021
Bulletin | Released 18 May 2021
Regional breakdowns of changes in UK employment, unemployment and economic inactivity.
Average weekly earnings in Great Britain: May 2021
Bulletin | Released 18 May 2021
Estimates of growth in earnings for employees before tax and other deductions from pay.
Vacancies and jobs in the UK: May 2021
Bulletin | Released 18 May 2021
Estimates of the number of vacancies and jobs for the UK.
Page 22 of 22PAYROLLED EMPLOYEES
1 Payrolled employee counts from PAYE RTI
Payrolled employees
UK, all industries, seasonally adjusted
Period Payrolled employees
April 2015 27,346,601
April 2016 27,829,952
April 2017 28,198,874
April 2018 28,539,274
April 2019 28,868,705
April 2020 28,534,573
May 2020 28,368,886
June 2020 28,333,919
July 2020 28,307,517
August 2020 28,253,591
September 2020 28,195,034
October 2020 28,165,597
November 2020 28,088,446
December 2020 28,133,641
January 2021 28,143,555
February 2021 28,151,106
March 2021 28,180,846
April 2021 28,278,056
Change on year -256,518
Change % -0.9
Source: PAYE RTI
1. Figures for April 2021 are early estimates and are more likely to be subject to more significant revisions.
2. These data are experimental statistics.
3. The number of payrolled employees here is defined as the number of people receiving paid renumeration included in PAYE RTI within the reference period,
including people who have not done work but are an employee - such as those on paid leave.
4. Values for the month are an average of employee counts in each day of the month. It is a measure of people who are payrolled employees,
as opposed to a measure of employee jobs.
5. These statistics include only individuals paid through PAYE and do not cover other sources of income such as from pensions, self-employment or investments.
6. PAYE covers occupational pension income as well as employment. In these tables pension income is excluded.
7. Incomes and employments are allocated to regions and countries according to the residence of the recipient.
8. Incomes and employments are allocated to industries according to the sector that an recipients's PAYE scheme is in.
9. These data include imputation for payments not yet received by HMRC which would relate to the respective work periods.
10. Figures have been rounded to the nearest £ or unit.
OFFICIAL
#MEDIAN PAY
2 Median monthly pay from PAYE RTI
£ per month
UK, all industries, seasonally adjusted
Period Median pay
April 2015 1,613
April 2016 1,652
April 2017 1,689
April 2018 1,730
April 2019 1,809
April 2020 1,792
May 2020 1,797
June 2020 1,830
July 2020 1,858
August 2020 1,878
September 2020 1,900
October 2020 1,911
November 2020 1,916
December 2020 1,929
January 2021 1,927
February 2021 1,939
March 2021 1,950
April 2021 1,967
Change on year 175
Change % 9.8
Source: PAYE RTI
1. Figures for April 2021 are early estimates and are more likely to be subject to more significant revisions.
2. These data are experimental statistics.
3. The number of payrolled employees here is defined as the number of people receiving paid renumeration included in PAYE RTI within the reference period,
including people who have not done work but are an employee - such as those on paid leave.
4. Values for the month are an average of employee counts in each day of the month. It is a measure of people who are payrolled employees,
as opposed to a measure of employee jobs.
5. These statistics include only individuals paid through PAYE and do not cover other sources of income such as from pensions, self-employment or investments.
6. PAYE covers occupational pension income as well as employment. In these tables pension income is excluded.
7. Incomes and employments are allocated to regions and countries according to the residence of the recipient.
8. Incomes and employments are allocated to industries according to the sector that an recipients's PAYE scheme is in.
9. These data include imputation for payments not yet received by HMRC which would relate to the respective work periods.
10. Figures have been rounded to the nearest £ or unit.
OFFICIAL
#MEAN PAY
3 Mean monthly pay from PAYE RTI
£ per month
UK, all industries, seasonally adjusted
Period Mean pay
March 2015 2,217
March 2016 2,244
March 2017 2,314
March 2018 2,389
March 2019 2,488
March 2020 2,520
April 2020 2,468
May 2020 2,469
June 2020 2,490
July 2020 2,530
August 2020 2,563
September 2020 2,596
October 2020 2,611
November 2020 2,634
December 2020 2,656
January 2021 2,655
February 2021 2,651
March 2021 2,652
Change on year 132
Change % 5.2
Source: PAYE RTI
1. Figures for April 2021 are early estimates and are more likely to be subject to more significant revisions.
2. These data are experimental statistics.
3. The number of payrolled employees here is defined as the number of people receiving paid renumeration included in PAYE RTI within the reference period,
including people who have not done work but are an employee - such as those on paid leave.
4. Values for the month are an average of employee counts in each day of the month. It is a measure of people who are payrolled employees,
as opposed to a measure of employee jobs.
5. These statistics include only individuals paid through PAYE and do not cover other sources of income such as from pensions, self-employment or investments.
6. PAYE covers occupational pension income as well as employment. In these tables pension income is excluded.
7. Incomes and employments are allocated to regions and countries according to the residence of the recipient.
8. Incomes and employments are allocated to industries according to the sector that an recipients's PAYE scheme is in.
9. These data include imputation for payments not yet received by HMRC which would relate to the respective work periods.
10. Figures have been rounded to the nearest £ or unit.
OFFICIAL
#AGGREGATE PAY
4 Aggregate monthly pay from PAYE RTI
£
UK, all industries, seasonally adjusted
Period Aggregate pay
March 2015 60,500,665,765
March 2016 62,415,575,832
March 2017 65,213,192,024
March 2018 68,079,294,768
March 2019 71,853,371,767
March 2020 73,124,305,121
April 2020 70,414,818,263
May 2020 70,045,803,214
June 2020 70,554,767,492
July 2020 71,620,670,639
August 2020 72,425,473,132
September 2020 73,185,499,819
October 2020 73,551,616,912
November 2020 73,983,343,051
December 2020 74,729,489,321
January 2021 74,720,566,712
February 2021 74,615,281,726
March 2021 74,747,413,105
Change on year 1,623,107,984
Change % 2.2
Source: PAYE RTI
1. Figures for April 2021 are early estimates and are more likely to be subject to more significant revisions.
2. These data are experimental statistics.
3. The number of payrolled employees here is defined as the number of people receiving paid renumeration included in PAYE RTI within the reference period,
including people who have not done work but are an employee - such as those on paid leave.
4. Values for the month are an average of employee counts in each day of the month. It is a measure of people who are payrolled employees,
as opposed to a measure of employee jobs.
5. These statistics include only individuals paid through PAYE and do not cover other sources of income such as from pensions, self-employment or investments.
6. PAYE covers occupational pension income as well as employment. In these tables pension income is excluded.
7. Incomes and employments are allocated to regions and countries according to the residence of the recipient.
8. Incomes and employments are allocated to industries according to the sector that an recipients's PAYE scheme is in.
9. These data include imputation for payments not yet received by HMRC which would relate to the respective work periods.
10. Figures have been rounded to the nearest £ or unit.
OFFICIAL
#PAY DISTRIBUTION
5 Monthly pay by percentile from PAYE RTI
£ per month, 3 month moving average
UK, all industries, seasonally adjusted
Period 10th percentile 25th percentile 50th percentile 75th percentile 90th percentile 95th percentile 99th percentile
March 2015 518 906 1,619 2,622 3,960 5,348 11,182
March 2016 536 925 1,641 2,645 3,993 5,381 11,101
March 2017 553 951 1,676 2,690 4,067 5,484 11,363
March 2018 579 989 1,726 2,763 4,185 5,659 11,804
March 2019 606 1,029 1,790 2,847 4,299 5,832 12,217
March 2020 624 1,072 1,850 2,933 4,435 6,000 12,457
April 2020 616 1,059 1,832 2,906 4,412 5,980 12,372
May 2020 610 1,048 1,812 2,872 4,381 5,941 12,294
June 2020 612 1,044 1,808 2,853 4,361 5,934 12,220
July 2020 623 1,058 1,829 2,878 4,385 5,963 12,295
August 2020 633 1,074 1,856 2,918 4,429 6,025 12,445
September 2020 645 1,092 1,879 2,958 4,476 6,093 12,698
October 2020 656 1,108 1,897 2,988 4,519 6,154 12,859
November 2020 664 1,117 1,909 3,014 4,555 6,206 13,010
December 2020 670 1,124 1,918 3,028 4,581 6,247 13,073
January 2021 673 1,126 1,923 3,039 4,599 6,269 13,092
February 2021 678 1,132 1,931 3,047 4,614 6,276 13,027
March 2021 681 1,138 1,937 3,056 4,629 6,274 12,966
Change on year 57 65 87 123 194 274 510
Change % 9.2 6.1 4.7 4.2 4.4 4.6 4.1
Source: PAYE RTI
1. Figures for April 2021 are early estimates and are more likely to be subject to more significant revisions.
2. These data are experimental statistics.
3. The number of payrolled employees here is defined as the number of people receiving paid renumeration included in PAYE RTI within the reference period,
including people who have not done work but are an employee - such as those on paid leave.
4. Values for the month are an average of employee counts in each day of the month. It is a measure of people who are payrolled employees,
as opposed to a measure of employee jobs.
5. These statistics include only individuals paid through PAYE and do not cover other sources of income such as from pensions, self-employment or investments.
6. PAYE covers occupational pension income as well as employment. In these tables pension income is excluded.
7. Incomes and employments are allocated to regions and countries according to the residence of the recipient.
8. Incomes and employments are allocated to industries according to the sector that an recipients's PAYE scheme is in.
9. These data include imputation for payments not yet received by HMRC which would relate to the respective work periods.
10. Figures have been rounded to the nearest £ or unit.
OFFICIAL
#EMPLOYEE FLOWS
6 Inflows and outflows from PAYE RTI
Payrolled employees
UK, all industries, seasonally adjusted
Period Inflows Outflows
April 2017 662,997 643,809
April 2018 645,655 598,071
April 2019 658,647 674,880
April 2020 437,785 919,187
May 2020 424,406 590,093
June 2020 421,473 456,441
July 2020 437,678 464,079
August 2020 539,421 593,347
September 2020 547,300 605,857
October 2020 566,704 596,141
November 2020 570,335 647,486
December 2020 608,413 563,218
January 2021 575,861 565,948
February 2021 515,369 507,818
March 2021 578,301 548,561
April 2021 669,290 572,080
Change on year 231,505 -347,107
Change % 52.9 -37.8
Source: PAYE RTI
1. Figures for April 2021 are early estimates and are more likely to be subject to more significant revisions.
2. These data are experimental statistics.
3. The number of payrolled employees here is defined as the number of people receiving paid renumeration included in PAYE RTI within the reference period,
including people who have not done work but are an employee - such as those on paid leave.
4. Values for the month are an average of employee counts in each day of the month. It is a measure of people who are payrolled employees,
as opposed to a measure of employee jobs.
5. These statistics include only individuals paid through PAYE and do not cover other sources of income such as from pensions, self-employment or investments.
6. PAYE covers occupational pension income as well as employment. In these tables pension income is excluded.
7. Incomes and employments are allocated to regions and countries according to the residence of the recipient.
8. Incomes and employments are allocated to industries according to the sector that an recipients's PAYE scheme is in.
9. These data include imputation for payments not yet received by HMRC which would relate to the respective work periods.
10. Figures have been rounded to the nearest £ or unit.
OFFICIAL
#REGIONAL PAYROLLED EMPLOYEES (NUTS1)
7 Regional payrolled employees from PAYE RTI
Payrolled employees
UK, all industries, seasonally adjusted
Yorkshire
and the East West Northern
Period North East North West Humber Midlands Midlands East London South East South West Wales Scotland Ireland
April 2015 1,045,293 2,969,354 2,187,722 1,999,576 2,356,945 2,605,129 3,796,238 3,864,429 2,286,390 1,202,239 2,342,447 690,839
April 2016 1,053,988 3,018,156 2,219,407 2,034,847 2,401,070 2,660,242 3,904,383 3,932,969 2,328,751 1,217,790 2,355,712 702,637
April 2017 1,059,725 3,058,712 2,246,453 2,068,941 2,434,884 2,704,567 3,966,129 3,983,719 2,360,506 1,233,307 2,366,917 715,015
April 2018 1,066,490 3,102,194 2,271,981 2,098,713 2,464,094 2,737,100 4,023,990 4,027,849 2,386,095 1,249,105 2,380,294 731,369
April 2019 1,067,182 3,137,430 2,301,391 2,120,430 2,483,650 2,769,971 4,101,065 4,074,505 2,410,683 1,259,116 2,397,330 745,952
April 2020 1,057,707 3,108,306 2,276,927 2,094,127 2,450,792 2,739,279 4,059,586 4,027,702 2,379,172 1,240,952 2,358,589 741,436
May 2020 1,054,572 3,098,861 2,263,923 2,083,563 2,437,306 2,725,319 4,030,316 3,999,685 2,361,411 1,233,747 2,340,684 739,501
June 2020 1,054,086 3,097,140 2,263,845 2,083,781 2,438,062 2,721,714 4,018,302 3,991,934 2,358,644 1,231,720 2,335,542 739,148
July 2020 1,053,757 3,095,523 2,263,053 2,082,889 2,437,718 2,718,885 4,004,388 3,985,621 2,356,927 1,230,381 2,336,763 741,612
August 2020 1,053,184 3,093,279 2,262,103 2,082,719 2,433,664 2,717,142 3,987,505 3,980,288 2,356,632 1,230,577 2,317,849 738,650
September 2020 1,051,682 3,085,704 2,258,701 2,078,174 2,427,054 2,713,374 3,963,923 3,976,154 2,355,939 1,230,250 2,315,306 738,774
October 2020 1,050,323 3,084,472 2,258,342 2,078,461 2,423,777 2,712,878 3,945,473 3,974,448 2,356,355 1,229,746 2,313,248 738,075
November 2020 1,048,344 3,076,583 2,252,926 2,073,979 2,418,898 2,706,990 3,919,418 3,965,411 2,355,594 1,225,625 2,307,112 737,565
December 2020 1,051,347 3,082,866 2,256,859 2,078,259 2,424,573 2,711,782 3,919,601 3,968,859 2,358,289 1,228,134 2,314,361 738,709
January 2021 1,052,605 3,085,301 2,259,120 2,079,817 2,428,682 2,711,559 3,917,676 3,965,228 2,359,259 1,228,905 2,316,210 739,194
February 2021 1,052,616 3,087,716 2,259,633 2,082,033 2,431,054 2,713,005 3,916,147 3,964,520 2,359,788 1,229,203 2,315,758 739,632
March 2021 1,054,444 3,091,476 2,263,164 2,085,330 2,434,954 2,715,283 3,916,999 3,966,075 2,362,379 1,229,972 2,319,220 741,550
April 2021 1,057,146 3,094,917 2,269,073 2,086,518 2,460,434 2,729,736 3,950,675 3,976,325 2,364,562 1,229,683 2,318,836 740,151
Change on year -560 -13,389 -7,854 -7,609 9,642 -9,543 -108,910 -51,377 -14,610 -11,268 -39,753 -1,285
Change % -0.1 -0.4 -0.3 -0.4 0.4 -0.3 -2.7 -1.3 -0.6 -0.9 -1.7 -0.2
Source: PAYE RTI
1. Figures for April 2021 are early estimates and are more likely to be subject to more significant revisions.
2. These data are experimental statistics.
3. The number of payrolled employees here is defined as the number of people receiving paid renumeration included in PAYE RTI within the reference period,
including people who have not done work but are an employee - such as those on paid leave.
4. Values for the month are an average of employee counts in each day of the month. It is a measure of people who are payrolled employees,
as opposed to a measure of employee jobs.
5. These statistics include only individuals paid through PAYE and do not cover other sources of income such as from pensions, self-employment or investments.
6. PAYE covers occupational pension income as well as employment. In these tables pension income is excluded.
7. Incomes and employments are allocated to regions and countries according to the residence of the recipient.
8. Incomes and employments are allocated to industries according to the sector that an recipients's PAYE scheme is in.
9. These data include imputation for payments not yet received by HMRC which would relate to the respective work periods.
10. Figures have been rounded to the nearest £ or unit.
OFFICIAL
#REGIONAL MEDIAN PAY (NUTS1)
8 Regional median monthly pay from PAYE RTI
£ per month
UK, all industries, seasonally adjusted
Yorkshire
and the East West Northern
Period North East North West Humber Midlands Midlands East London South East South West Wales Scotland Ireland
April 2015 1,531 1,522 1,516 1,520 1,532 1,656 1,944 1,733 1,518 1,516 1,655 1,497
April 2016 1,562 1,559 1,537 1,555 1,568 1,689 1,995 1,775 1,548 1,543 1,691 1,515
April 2017 1,590 1,594 1,567 1,592 1,606 1,730 2,041 1,814 1,588 1,583 1,718 1,543
April 2018 1,634 1,640 1,610 1,634 1,649 1,777 2,108 1,856 1,630 1,617 1,756 1,595
April 2019 1,703 1,710 1,688 1,706 1,717 1,857 2,187 1,943 1,703 1,696 1,844 1,674
April 2020 1,683 1,700 1,671 1,694 1,693 1,855 2,170 1,923 1,689 1,686 1,836 1,662
May 2020 1,689 1,707 1,675 1,698 1,704 1,856 2,170 1,928 1,694 1,695 1,838 1,669
June 2020 1,725 1,742 1,713 1,738 1,734 1,898 2,193 1,959 1,742 1,733 1,865 1,726
July 2020 1,746 1,770 1,733 1,765 1,760 1,919 2,223 1,987 1,753 1,750 1,893 1,743
August 2020 1,758 1,780 1,751 1,777 1,777 1,936 2,253 2,009 1,780 1,775 1,906 1,750
September 2020 1,789 1,810 1,780 1,802 1,801 1,961 2,292 2,029 1,811 1,810 1,924 1,764
October 2020 1,796 1,817 1,786 1,807 1,808 1,971 2,313 2,040 1,817 1,814 1,937 1,770
November 2020 1,799 1,818 1,787 1,813 1,814 1,977 2,319 2,045 1,811 1,817 1,938 1,776
December 2020 1,802 1,832 1,797 1,830 1,828 1,998 2,333 2,067 1,831 1,819 1,954 1,790
January 2021 1,809 1,829 1,796 1,824 1,826 1,991 2,326 2,058 1,823 1,822 1,961 1,781
February 2021 1,809 1,834 1,802 1,834 1,831 1,997 2,343 2,073 1,835 1,825 1,979 1,776
March 2021 1,819 1,845 1,814 1,847 1,851 2,020 2,360 2,091 1,849 1,837 1,967 1,806
April 2021 1,829 1,855 1,821 1,858 1,863 2,027 2,385 2,108 1,856 1,842 2,021 1,826
Change on year 146 154 150 163 169 172 215 184 167 155 185 164
Change % 8.7 9.1 8.9 9.6 10 9.3 9.9 9.6 9.9 9.2 10.1 9.8
Source: PAYE RTI
1. Figures for April 2021 are early estimates and are more likely to be subject to more significant revisions.
2. These data are experimental statistics.
3. The number of payrolled employees here is defined as the number of people receiving paid renumeration included in PAYE RTI within the reference period,
including people who have not done work but are an employee - such as those on paid leave.
4. Values for the month are an average of employee counts in each day of the month. It is a measure of people who are payrolled employees,
as opposed to a measure of employee jobs.
5. These statistics include only individuals paid through PAYE and do not cover other sources of income such as from pensions, self-employment or investments.
6. PAYE covers occupational pension income as well as employment. In these tables pension income is excluded.
7. Incomes and employments are allocated to regions and countries according to the residence of the recipient.
8. Incomes and employments are allocated to industries according to the sector that an recipients's PAYE scheme is in.
9. These data include imputation for payments not yet received by HMRC which would relate to the respective work periods.
10. Figures have been rounded to the nearest £ or unit.
OFFICIAL
#REGIONAL PAYROLLED EMPLOYEES (NUTS2)
11 Regional payrolled employees from PAYE RTI
Payrolled employees
UK, all industries, seasonally adjusted
Period April 2020 April 2021 Change on year Change %
Tees Valley and Durham 474,953 475,777 824 0.2
Northumberland and Tyne and Wear 582,754 581,369 -1384 -0.2
Cumbria 215,348 213,954 -1394 -0.6
Greater Manchester 1,200,465 1,191,036 -9429 -0.8
Lancashire 622,392 624,542 2150 0.3
Cheshire 426,787 425,541 -1246 -0.3
Merseyside 643,313 639,843 -3470 -0.5
East Yorkshire and Northern Lincolnshire 392,082 392,779 697 0.2
North Yorkshire 347,734 345,885 -1849 -0.5
South Yorkshire 571,701 569,508 -2193 -0.4
West Yorkshire 965,410 960,901 -4509 -0.5
Derbyshire and Nottinghamshire 933,560 930,009 -3551 -0.4
Leicestershire, Rutland and Northamptonshire 843,132 838,889 -4243 -0.5
Lincolnshire 317,435 317,620 185 0.1
Herefordshire, Worcestershire and Warwickshire 603,509 606,811 3302 0.5
Shropshire and Staffordshire 693,542 697,352 3810 0.5
West Midlands (county) 1,153,741 1,156,271 2530 0.2
East Anglia 1,083,833 1,080,671 -3162 -0.3
Bedfordshire and Hertfordshire 855,072 852,491 -2582 -0.3
Essex 800,374 796,575 -3799 -0.5
Inner London - West 513,987 500,928 -13059 -2.5
Inner London - East 1,137,884 1,100,011 -37874 -3.3
Outer London - East and North East 848,546 832,786 -15760 -1.9
Outer London - South 596,939 588,281 -8657 -1.5
Outer London - West and North West 962,230 928,669 -33561 -3.5
Berkshire, Buckinghamshire and Oxfordshire 1,150,658 1,133,123 -17535 -1.5
Surrey, East and West Sussex 1,239,715 1,221,470 -18244 -1.5
Hampshire and Isle of Wight 867,439 858,274 -9165 -1.1
Kent 769,891 763,458 -6433 -0.8
Gloucestershire, Wiltshire and Bristol/Bath area 1,139,545 1,128,745 -10800 -0.9
Dorset and Somerset 551,835 547,354 -4481 -0.8
Cornwall and Isles of Scilly 213,055 214,831 1776 0.8
Devon 474,737 473,632 -1105 -0.2
West Wales and The Valleys 755,404 750,441 -4963 -0.7
East Wales 485,548 479,242 -6306 -1.3
North Eastern Scotland 226,481 217,301 -9180 -4.1
Highlands and Islands 198,809 197,591 -1218 -0.6
Eastern Scotland 873,019 855,607 -17413 -2
West Central Scotland 665,575 657,808 -7767 -1.2
Southern Scotland 394,704 390,529 -4175 -1.1
Northern Ireland 741,436 740,151 -1285 -0.2
Source: PAYE RTI
1. Figures for April 2021 are early estimates and are more likely to be subject to more significant revisions.
2. These data are experimental statistics.
3. The number of payrolled employees here is defined as the number of people receiving paid renumeration included in PAYE RTI within the reference period,
including people who have not done work but are an employee - such as those on paid leave.
4. Values for the month are an average of employee counts in each day of the month. It is a measure of people who are payrolled employees,
as opposed to a measure of employee jobs.
5. These statistics include only individuals paid through PAYE and do not cover other sources of income such as from pensions, self-employment or investments.
6. PAYE covers occupational pension income as well as employment. In these tables pension income is excluded.
7. Incomes and employments are allocated to regions and countries according to the residence of the recipient.
8. Incomes and employments are allocated to industries according to the sector that an recipients's PAYE scheme is in.
9. These data include imputation for payments not yet received by HMRC which would relate to the respective work periods.
10. Figures have been rounded to the nearest £ or unit.
OFFICIAL
#REGIONAL MEDIAN PAY (NUTS2)
12 Regional median monthly pay from PAYE RTI
£ per month
UK, all industries, seasonally adjusted
Period April 2020 April 2021 Change on year Change %
Tees Valley and Durham 1,677 1,824 147 8.8
Northumberland and Tyne and Wear 1,689 1,835 146 8.6
Cumbria 1,649 1,817 169 10.2
Greater Manchester 1,707 1,860 154 9
Lancashire 1,634 1,784 150 9.1
Cheshire 1,802 1,971 170 9.4
Merseyside 1,719 1,856 137 8
East Yorkshire and Northern Lincolnshire 1,623 1,784 162 10
North Yorkshire 1,686 1,826 139 8.3
South Yorkshire 1,668 1,811 143 8.6
West Yorkshire 1,698 1,851 153 9
Derbyshire and Nottinghamshire 1,692 1,851 159 9.4
Leicestershire, Rutland and Northamptonshire 1,722 1,890 168 9.7
Lincolnshire 1,653 1,799 146 8.9
Herefordshire, Worcestershire and Warwickshire 1,763 1,939 175 9.9
Shropshire and Staffordshire 1,676 1,843 166 9.9
West Midlands (county) 1,666 1,828 162 9.7
East Anglia 1,753 1,907 154 8.8
Bedfordshire and Hertfordshire 2,001 2,176 174 8.7
Essex 1,881 2,066 185 9.8
Inner London - West 2,714 2,980 266 9.8
Inner London - East 2,227 2,451 224 10.1
Outer London - East and North East 1,992 2,174 181 9.1
Outer London - South 2,210 2,431 221 10
Outer London - West and North West 2,020 2,220 200 9.9
Berkshire, Buckinghamshire and Oxfordshire 2,060 2,249 188 9.1
Surrey, East and West Sussex 1,923 2,113 190 9.9
Hampshire and Isle of Wight 1,832 2,011 179 9.8
Kent 1,832 2,012 180 9.8
Gloucestershire, Wiltshire and Bristol/Bath area 1,798 1,967 170 9.4
Dorset and Somerset 1,653 1,815 162 9.8
Cornwall and Isles of Scilly 1,515 1,678 163 10.8
Devon 1,597 1,757 160 10
West Wales and The Valleys 1,664 1,819 155 9.3
East Wales 1,741 1,902 161 9.3
North Eastern Scotland 1,967 2,147 180 9.1
Highlands and Islands 1,737 1,922 185 10.7
Eastern Scotland 1,853 2,032 179 9.6
West Central Scotland 1,834 2,023 189 10.3
Southern Scotland 1,777 1,970 192 10.8
Northern Ireland 1,662 1,826 164 9.8
Source: PAYE RTI
1. Figures for April 2021 are early estimates and are more likely to be subject to more significant revisions.
2. These data are experimental statistics.
3. The number of payrolled employees here is defined as the number of people receiving paid renumeration included in PAYE RTI within the reference period,
including people who have not done work but are an employee - such as those on paid leave.
4. Values for the month are an average of employee counts in each day of the month. It is a measure of people who are payrolled employees,
as opposed to a measure of employee jobs.
5. These statistics include only individuals paid through PAYE and do not cover other sources of income such as from pensions, self-employment or investments.
6. PAYE covers occupational pension income as well as employment. In these tables pension income is excluded.
7. Incomes and employments are allocated to regions and countries according to the residence of the recipient.
8. Incomes and employments are allocated to industries according to the sector that an recipients's PAYE scheme is in.
9. These data include imputation for payments not yet received by HMRC which would relate to the respective work periods.
10. Figures have been rounded to the nearest £ or unit.
OFFICIAL
#You can also read