Introduction to Data Science - TU Chemnitz
←
→
Page content transcription
If your browser does not render page correctly, please read the page content below

Introduction to Data Science
                  Winter Semester 2018/19

                           Oliver Ernst

TU Chemnitz, Fakultät für Mathematik, Professur Numerische Mathematik

                          Lecture Slides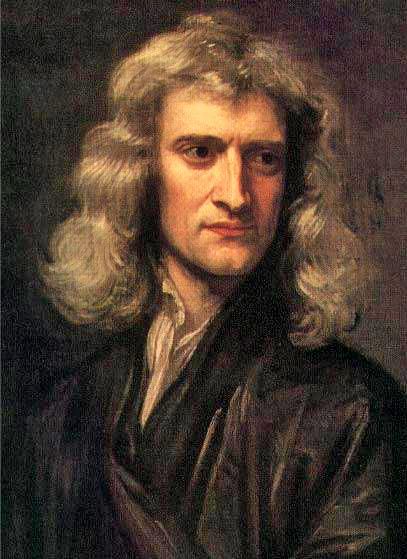
Organizational Issues

 •   Module: Introduction to Data Science (M24, Einführung in Data Science)
 •   Class web page: www.tu-chemnitz.de/mathematik/numa/lehre/ds-2018/
 •   Lecturer: Oliver Ernst (oernst@math.tu-chemnitz.de)
 •   Class meets Mo 9:15 and Thu 13:45 in Rh70 Room B202.
 •   Course Assistant: Jan Blechschmidt (jan.blechschmidt@math.tu-chemnitz.de)
 •   Lab exercises Tue 13:45 Rh39/41 Room 738.
 •   50 % of coursework must be handed in correctly to register for exam.
 •   Oral exam, 30 minutes, at end of teaching term (February)
 •   Textbook: James, Witten, Hastie &Tibshirani. Introduction to Statistical
     Learning. Springer, 2013.

      Oliver Ernst (NM)        Introduction to Data Science   Winter Semester 2018/19   2 / 47
Contents I

1   What is Data Science?

2 Learning Theory
2.1 What is Statistical Learning?

        Oliver Ernst (NM)      Introduction to Data Science   Winter Semester 2018/19   3 / 47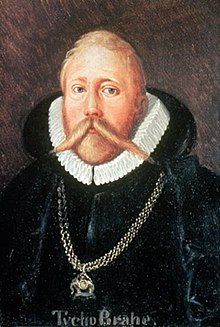
What is Data Science?
Point of departure

   • Explosion of data: sensor technology (e.g. weather); purchase histories
     (customer loyalty programs, fraud detection); soon every person on the pla-
     net (≈ 8 billion) will have a smartphone and generate GPS traces, trillions
     of photos each year; DNA sequencing . . .
     Nagel (2018):
        •   Gigabyte (109 ); your hard disk
        •   Terabyte (1012 ); Facebook - 500 TB/day1
        •   Petabyte (1015 ); CERN - LHC: 15 PB/year
        •   Zettabyte (1021 ); mobile network traffic 2016
        •   Yottabyte (1024 ); event analysis
        •   Brontobyte (1027 ); sensor data from the IoT (Internet of Things)
   • Heterogeneity: besides big, data unstructured, noisy, heterogeneous, not
     collected systematically.
   • Enabling technologies: storage capacity; computing hardware; algorithms;
     350 years of statistics; 100 years of numerical analysis.
   1 Facebook
            currently has 2.2 billion users worldwide,
Can Mark Zuckerberg Fix Facebook Before It Breaks Democracy? New Yorker, 09/2018
        Oliver Ernst (NM)           Introduction to Data Science    Winter Semester 2018/19   5 / 47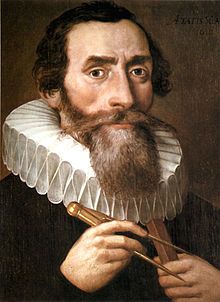
What is Data Science
Buzz words

  • Data Science
  • Big Data
  • Data Mining
  • Data Analysis
  • Business Intelligence
  • Analytics

       Oliver Ernst (NM)    Introduction to Data Science   Winter Semester 2018/19   6 / 47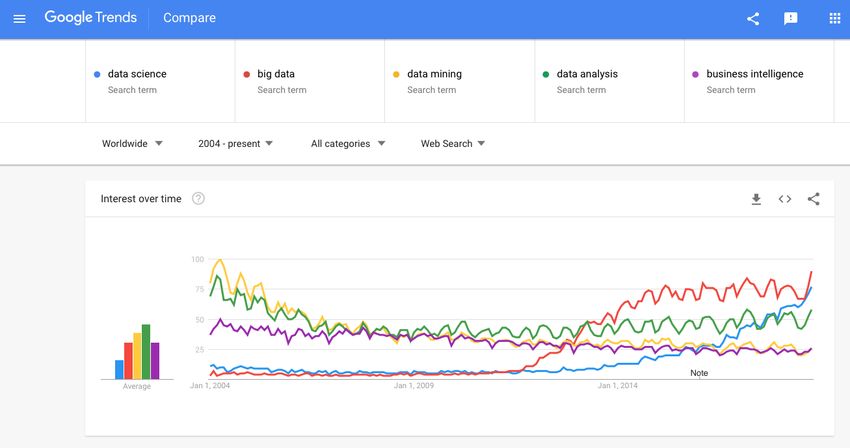
What is Data Science
Buzz words

trends.google.com

       Oliver Ernst (NM)   Introduction to Data Science   Winter Semester 2018/19   7 / 47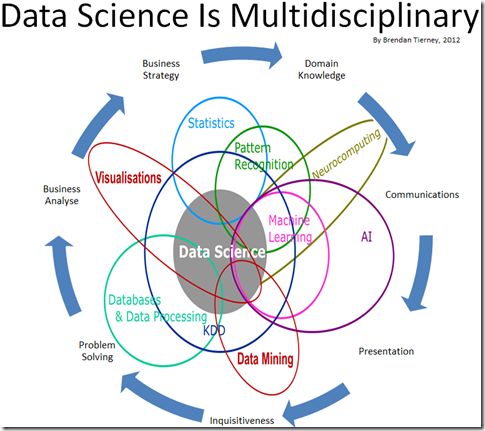
What is Data Science
Conway’s data science Venn diagram (2010) . . .

                              http://drewconway.com/zia/2013/3/26/the-data-science-venn-diagram
        Oliver Ernst (NM)            Introduction to Data Science        Winter Semester 2018/19   8 / 47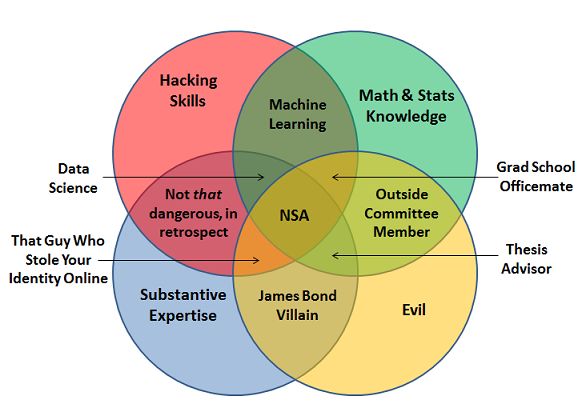
What is Data Science
Conway’s data science Venn diagram (2010) . . . and variations

Brendan Tierney (2012)

                            http://www.prooffreader.com/2016/09/battle-of-data-science-venn-diagrams.html
Joel Grus (2013), at the time of the Snowden revelations
        Oliver Ernst (NM)                    Introduction to Data Science         Winter Semester 2018/19   9 / 47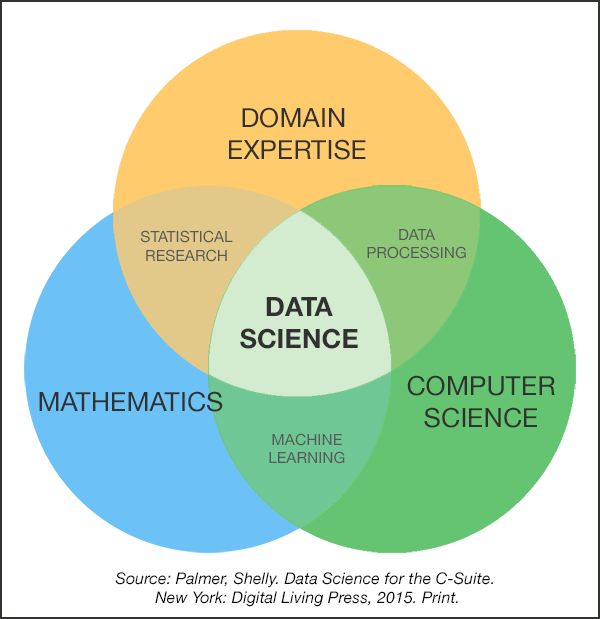
What is Data Science
. . . and from the twitterverse:

      “A data scientist is a statistician who lives in San Francisco.”

      “Data Science is statistics on a Mac”

      “A data scientist is someone who is better at statistics than any
      software engineer and better at software engineering than any statisti-
      cian.”                         Josh Wills, Director of Data Science at Cloudera

      “A data scientist is someone who is worse at statistics than any stati-
      stician and worse at software engineering than any software engineer.”
                                                     Will Cukierski, Data Scientist at Kaggle

                                            https://twitter.com/cdixon/status/428914681911070720

        Oliver Ernst (NM)            Introduction to Data Science              Winter Semester 2018/19   10 / 47
What is Data Science
Donoho’s first definition
David Donoho (2015)2
Classifies the activities of Greater Data Science (GDS) into six divisions.
(GDS1) Data Gathering, Preparation and Exploration
experimental design; collect; reformat, treat anomalies, expose
unexpected features.
(GDS2) Data Representation and Transformation
databases; represent e.g. acoustic, image, sensor, network data.
(GDS3) Computing with Data
SW engineering; cluster computing; developing workflows.
(GDS4) Data Visualization and Presentation
classical EDA plots; high-dimensional or streaming data
(GDS5) Data Modeling
generative vs. predictive modeling
(GDS6) Science about Data Science
evaluate results, processes, workflows; analysis od methods.
2 50 Years of Data Science. Journal of Computational and Graphical Statistics. 26 (2017)
Oliver Ernst (NM) Introduction to Data Science Winter Semester 2018/19 11 / 47Some Examples
Brahe, Kepler & Newton
• Tycho Brahe (1546–1501) Accurate and detailed observations of positions
of celestial bodies over many years. (data collection)
• Johannes Kepler (1571–1630) Based on Brahe’s observations, derives laws
of orbital motion. (model fitting)
• Isaac Newton (1643–1727) Derives Newtonian mechanics, from which
Kepler’s laws follow. (deeper underlying truths)
Oliver Ernst (NM) Introduction to Data Science Winter Semester 2018/19 12 / 47Some Examples
1854 cholera outbeak, Broad Street, London
• Mid 19-th century London was plagued by devastating outbreaks of Chole-
ra.
• Competing medical theories of the time: miasma (“bad air”) vs. as yet uni-
dentified microbes.
• London doctor John Snow, microbe theory proponent, conjectured that
Cholera-inducing microbes spread via drinking water.
• During a particularly severe outbreak in Soho district in 1854, Snow recor-
ded the deaths on a dot map.
• The clustering pattern evident from the map pointed to the Broad Street
pump as the likely source of contamination.
• Based on this evidence, he was able to convince the authorities to disable
the pump, and Cholera incidence in the neighborhood declined.
Oliver Ernst (NM) Introduction to Data Science Winter Semester 2018/19 13 / 47Some Examples
1854 cholera outbeak, Broad Street, London
Original Snow map of 1854.
Stacked rectangles indicate
Cholera cases. (Wikipedia)
Oliver Ernst (NM) Introduction to Data Science Winter Semester 2018/19 14 / 47Some Examples
Florence Nightingale’s data visualizations
• During the Crimean War (1853–1856), Florence Nightingale, a well-educated
British social reformer and statistician, was in charge of a group of nurses
tending the wounded British soldiers at Selimiye Barracks near Istanbul.
• She systematically documented the horrific medical conditions she encoun-
tered on arrival and reported her findings to the authorities, effecting dra-
matic hygenic improvements.
• Nightingale pioneered the graphical display of statistical data in pie-chart-
like diagrams known then as “coxcombs”.
• In 1859, Nightingale was elected the first female member of the Royal Sta-
tistical Society. In 1874 she became an honorary member of the American
Statistical Association.
Oliver Ernst (NM) Introduction to Data Science Winter Semester 2018/19 15 / 47Some Examples
Florence Nightingale’s data visualizations
Oliver Ernst (NM) Introduction to Data Science Winter Semester 2018/19 16 / 47Some Examples
Data science today
• Precision medicine: the cost of sequencing the human genome has drop-
ped by a factor of one million (3.5 billion to 1000 USD) in the last decade.
New algorithms achieve a full genome analysis in 24 hours, looking at 6
billion genes, vs. standard technology taking 3 months, accounting for 5
genes only.
E. A. Ashley. Towards Precision Medicine. Nature Reviews Generics (2017).
• Predicting elections: in 2008, the American statistician Nate Silver cor-
rectly predicted the outcome in 49 of 50 states in the US presidential elec-
tion. In 2012 he correctly predicted in all 50 states.
N. Silver. The Signal and the Noise. Penguin (2012).
• Influencing elections: A classical model for personality traits was combi-
ned with data gleaned from the accounts of a large number of Facebook
users to produce microtargeted ads in recent political campains, including
the 2016 US presidential election and the UK referendum on leaving the
EU. Besides litigation, this has led to concerns over privacy issues and the
possibilities for systematic disinformation based on data science techniques.
The Data that Turned the World Upside Down. Motherboard Vice (2017).
Oliver Ernst (NM) Introduction to Data Science Winter Semester 2018/19 17 / 47Some Examples
Data science today
• Beating humans at games. 1997 IBM’s Deep Blue beat world chess grand-
master Garry Kasparov. 2011 IBM’s Deep Blue won at the TV game show
’Jeopardy’. In 2016 Google’s Deep Mind beat world champion Lee Sedol at
the ancient chinese game ‘Go’.
B. Dickson.. All the important games artificial intelligence has conquered. (2018).
• Autonomous vehicles: Automobiles already contain multiple software sys-
tems for control, navigation, communication and entertainment. By com-
bining multiple sensor input (cameras, LIDAR, RADAR), artificial intelli-
gence systems are moving ever closer to cars which can drive autonomous-
ly. Daimler has promised driverless cars by 2020, Ford by 2021.
• Medical diagnostics: In 2017, the Stanford Machine Learning Group in-
troduced the algorithm CheXNet, a neural network which outperformed
practicing radiologists in detecting pneumonia from chest X-ray images.
In 2018, the same group presented a machine learning system which can
summarize the key findings of radiology reports for x-ray images nearly as
well as radiologists can.
• Natural language processing: Google, Google translate, Google ngrams,
Google trends.
Oliver Ernst (NM) Introduction to Data Science Winter Semester 2018/19 18 / 47What is Data Science?
Donoho’s second definition/paradigm
David Donoho. Data Science: The End of Theory?
Lecture at Data Science Kickoff event, U Vienna, 22.06.2018
Def. Data Science concerns the recognition, formalization and exploi-
tation of data phenomenology emerging from digital transformation of
business, society and science itself.
Hallmarks of DS activities:
Developments Examples
Accumulating digital assets
Emergent data/methodology universe
Emergent technique of exploitation
https://www.youtube.com/watch?v=PekBM76z2qE
Oliver Ernst (NM) Introduction to Data Science Winter Semester 2018/19 19 / 47What is Data Science?
Donoho’s second definition/paradigm
In his Vienna lecture Donoho provides a series of examples for activities which
qualify as DS under this paradigm, among these
• a study of false discovery rates in medical literature [Jager & Leek, 2014],
• a cross-model study on detection methods for ovarian cancer,
• the enterprise of machine learning, as well as
• the use of deep learning to accelerate existing algorithms.
Oliver Ernst (NM) Introduction to Data Science Winter Semester 2018/19 20 / 47What is Data Science?
Donoho’s second definition/paradigm
Biostatistics (2014), 15, 1, pp. 1–12
doi:10.1093/biostatistics/kxt007
R
Advance Access publication on September 25, 2013
An estimate of the science-wise false discovery rate
Downloaded from https://academic.oup.com/biostatistics/article-abstract/15/1/1/244509 by guest on 09 October 2018
and application to the top medical literature
LEAH R. JAGER
Department of Mathematics, United States Naval Academy, Annapolis, MD 21402, USA
JEFFREY T. LEEK∗
Department of Biostatistics, Johns Hopkins Bloomberg School of Public Health, Baltimore, MD 21205,
USA
jleek@jhsph.edu
SUMMARY
The accuracy of published medical research is critical for scientists, physicians and patients who rely on
these results. However, the fundamental belief in the medical literature was called into serious question
by a paper suggesting that most published medical research is false. Here we adapt estimation methods
from the genomics community to the problem of estimating the rate of false discoveries in the medical
literature using reported P-values as the data. We then collect P-values from the abstracts of all 77 430
papers published in The Lancet, The Journal of the American Medical Association, The New England
Journal of Medicine, The British Medical Journal, and The American Journal of Epidemiology between
2000 and 2010. Among these papers, we found 5322 reported P-values. We estimate that the overall rate
of false discoveries among reported results is 14% (s.d. 1%), contrary to previous claims. We also found
Developments Examples
that there is no a significant increase in the estimated rate of reported false discovery results over time
(0.5% more false positives (FP) per year, P = 0.18) or with respect to journal submissions (0.5% more
FP per 100 submissions, P = 0.12). Statistical analysis must allow for false discoveries in order to make
Accumulating digital assets database, SW for text scraping
claims on the basis of noisy data. But our analysis suggests that the medical literature remains a reliable
record of scientific progress.
Emergent data/methodology universe all Pub-Med abstracts
Keywords: False discovery rate; Genomics; Meta-analysis; Multiple testing; Science-wise false discovery rate;
Two-group model.
Emergent technique of exploitation stats about scientific activity
1. INTRODUCTION
Scientific progress depends on the slow, steady accumulation of data and facts about the way the world
works. The scientific process is also hierarchical, with each new result predicated on the results that came
before. When developing new experiments and theories, scientists rely on the accuracy of previous dis-
Oliver Ernst (NM) Introduction to Data Science Winter Semester 2018/19 21 / 47What is Data Science?
The end of theory?
• In 2008 an article in Wired Magazine3 suggested that emerging data science
techniques would render the traditional scientific method based on hypo-
theses obsolete, implying that automated data mining will lead directly to
new discoveries.
• This is particularly relevant for areas of research such as bioinformatics,
systems biology, epidemiology and ecology.
• This prompted an intense discussion on data-driven vs. hypothesis-driven
research.
• The “No-Free-Lunch theorem” states that there can be no learning without
knowledge.
• Currently, a “mathematization” of data science is setting in, leaving ample
room for theoretical analysis, likely leading to improved methods. (Compare
with the development of other computational disciplines such as the finite
element method or uncertainty quantification)
3 The end of theory:the data deluge makes the scientific method obsolete. Wired 6/2008.
Oliver Ernst (NM) Introduction to Data Science Winter Semester 2018/19 22 / 47You can also read