Estimates of Diabetes and Its Burden in the United States - CDC
←
→
Page content transcription
If your browser does not render page correctly, please read the page content below
National Diabetes Statistics Report

 2020
Estimates of Diabetes and Its Burden in the United States

                 This document is intended to provide up-to-date scientific data
                 and statistics on diabetes and its burden in the United States.
                 Formerly known as the National Diabetes Fact Sheet, this
                 consensus document is written primarily for a scientific audience.

                                                                          CS 314227-A
National Diabetes Statistics Report, 2020

CONTENTS
Introduction. .  .  .  .  .  .  .  .  .  .  .  .  .  .  .  .  .  .  .  .  .  .  .  .  .  .  .  .  .  .  .  .  .  .  .  .  .  .  .  .  .  .  .  .  .  .  .  .  .  .  .  .  .  .  .  .  .  .  .  .  .  .  .  .  .  .  .  .  .  .  .  .  .  .  .  .  .  .  .  .  .  . 1
Methods .  .  .  .  .  .  .  .  .  .  .  .  .  .  .  .  .  .  .  .  .  .  .  .  .  .  .  .  .  .  .  .  .  .  .  .  .  .  .  .  .  .  .  .  .  .  .  .  .  .  .  .  .  .  .  .  .  .  .  .  .  .  .  .  .  .  .  .  .  .  .  .  .  .  .  .  .  .  .  .  .  .  .  .  .  . 1
Results.  .  .  .  .  .  .  .  .  .  .  .  .  .  .  .  .  .  .  .  .  .  .  .  .  .  .  .  .  .  .  .  .  .  .  .  .  .  .  .  .  .  .  .  .  .  .  .  .  .  .  .  .  .  .  .  .  .  .  .  .  .  .  .  .  .  .  .  .  .  .  .  .  .  .  .  .  .  .  .  .  .  .  .  .  .  .  . 2
        Prevalence of Diabetes (Diagnosed and Undiagnosed) . . . . . . . . . . . . . . . . . . . . . . . . . . . . . . . . . . . . . . . . . . . . 2
        Prevalence of Diagnosed Diabetes . . . . . . . . . . . . . . . . . . . . . . . . . . . . . . . . . . . . . . . . . . . . . . . . . . . . . . . . . . . . . . . 4
        Incidence of Diagnosed Diabetes (Newly Diagnosed Diabetes) . . . . . . . . . . . . . . . . . . . . . . . . . . . . . . . . . . . . . 5
        Prevalence of Prediabetes Among Adults . . . . . . . . . . . . . . . . . . . . . . . . . . . . . . . . . . . . . . . . . . . . . . . . . . . . . . . . . 8
        Risk Factors for Diabetes-Related Complications . . . . . . . . . . . . . . . . . . . . . . . . . . . . . . . . . . . . . . . . . . . . . . . . . . 9
        Preventing Diabetes-Related Complications. . . . . . . . . . . . . . . . . . . . . . . . . . . . . . . . . . . . . . . . . . . . . . . . . . . . . . 10
        Coexisting Conditions and Complications. . . . . . . . . . . . . . . . . . . . . . . . . . . . . . . . . . . . . . . . . . . . . . . . . . . . . . . . 11
Acknowledgments.  .  .  .  .  .  .  .  .  .  .  .  .  .  .  .  .  .  .  .  .  .  .  .  .  .  .  .  .  .  .  .  .  .  .  .  .  .  .  .  .  .  .  .  .  .  .  .  .  .  .  .  .  .  .  .  .  .  .  .  .  .  .  .  .  .  .  .  .  .  .  .  .  .  .  . 14
References .  .  .  .  .  .  .  .  .  .  .  .  .  .  .  .  .  .  .  .  .  .  .  .  .  .  .  .  .  .  .  .  .  .  .  .  .  .  .  .  .  .  .  .  .  .  .  .  .  .  .  .  .  .  .  .  .  .  .  .  .  .  .  .  .  .  .  .  .  .  .  .  .  .  .  .  .  .  .  .  .  .  . 14
Suggested Citation .  .  .  .  .  .  .  .  .  .  .  .  .  .  .  .  .  .  .  .  .  .  .  .  .  .  .  .  .  .  .  .  .  .  .  .  .  .  .  .  .  .  .  .  .  .  .  .  .  .  .  .  .  .  .  .  .  .  .  .  .  .  .  .  .  .  .  .  .  .  .  .  .  .  . 14
Appendix A: Detailed Tables .  .  .  .  .  .  .  .  .  .  .  .  .  .  .  .  .  .  .  .  .  .  .  .  .  .  .  .  .  .  .  .  .  .  .  .  .  .  .  .  .  .  .  .  .  .  .  .  .  .  .  .  .  .  .  .  .  .  .  .  .  .  .  .  .  .  . 15
Appendix B: Detailed Methods and Data Sources.  .  .  .  .  .  .  .  .  .  .  .  .  .  .  .  .  .  .  .  .  .  .  .  .  .  .  .  .  .  .  .  .  .  .  .  .  .  .  .  .  .  .  .  .  .  .  . 21

                                                                                                                                      ii
National Diabetes Statistics Report, 2020

INTRODUCTION
The National Diabetes Statistics Report, a periodic publication of the Centers for Disease Control and
Prevention (CDC), provides information on the prevalence and incidence of diabetes and prediabetes,
risk factors for complications, acute and long-term complications, deaths, and costs. These data can help
focus efforts to prevent and control diabetes across the United States. This document is an update of the
2017 National Diabetes Statistics Report and is intended for a scientific audience.

METHODS
New in 2020, this National Diabetes Statistics Report features trends in prevalence and incidence
estimates over time.

The estimates in this document (unless otherwise noted) were derived from various data systems of
CDC, Indian Health Service (IHS), Agency for Healthcare Research and Quality (AHRQ), and US Census
Bureau, and from published research studies. Estimated percentages and total number of people with
diabetes and prediabetes were derived from the National Health and Nutrition Examination Survey
(NHANES), National Health Interview Survey (NHIS), IHS National Data Warehouse (NDW), Behavioral Risk
Factor Surveillance System (BRFSS), United States Diabetes Surveillance System (USDSS), and US resident
population estimates.

Diagnosed diabetes status was determined from self-reported information provided by survey
respondents; for American Indians and Alaska Natives who accessed IHS or tribal health facilities that
submitted medical records data to the IHS NDW, clinical diagnostic codes were also used. Undiagnosed
diabetes was determined by measured fasting plasma glucose or A1C levels. Numbers and rates for
acute and long-term complications of diabetes were derived from the National Inpatient Sample (NIS)
and National Emergency Department Sample (NEDS), as well as NHIS.

For some measures, estimates were not available for certain racial and ethnic subgroups due to small
sample sizes.

An alpha level of 0.05 was used when determining statistically significant differences between groups.
Age-adjusted estimates were calculated among adults aged 18 years or older by the direct method to
the 2000 US Census standard population, using age groups 18–44, 45–64, and 65 years or older. Most
estimates of diabetes in this report do not differentiate between type 1 and type 2 diabetes. However,
as type 2 diabetes accounts for 90% to 95% of all diabetes cases, the data presented here are more likely
to be characteristic of type 2 diabetes, except as noted.

More information about the data sources, methods, and references is available in the Detailed Methods
and Data Sources section.

                                                    1
National Diabetes Statistics Report, 2020

RESULTS
Prevalence of Diabetes (Diagnosed and Undiagnosed)
(See Detailed Methods)
Among the US population overall, crude estimates for 2018 were:
  • 34.2 million people of all ages—or 10.5% of the US population—had diabetes.
  • 34.1 million adults aged 18 years or older—or 13.0% of all US adults—had diabetes (Table 1a; Table 1b).
  • 7.3 million adults aged 18 years or older who met laboratory criteria for diabetes were not aware of or
     did not report having diabetes (undiagnosed diabetes, Table 1b). This number represents 2.8% of all US
     adults (Table 1a) and 21.4% of all US adults with diabetes.
  • The percentage of adults with diabetes increased with age, reaching 26.8% among those aged 65 years
     or older (Table 1a).

Table 1a. Estimated crude prevalence of diagnosed diabetes, undiagnosed diabetes, and total diabetes among
adults aged 18 years or older, United States, 2013–2016

                                              Diagnosed diabetes                    Undiagnosed diabetes                         Total diabetes
 Characteristic                                   Percentage                             Percentage                               Percentage
                                                   (95% CI)                               (95% CI)                                  (95% CI)
  Total                                          10.2 (9.3–11.2)                           2.8 (2.4–3.3)                        13.0 (12.0–14.1)
 Age in years
  18–44                                             3.0 (2.6–3.6)                           1.1 (0.7–1.8)                           4.2 (3.4–5.0)
  45–64                                           13.8 (12.2–15.6)                          3.6 (2.8–4.8)                         17.5 (15.7–19.4)
  ≥65                                             21.4 (18.7–24.2)                          5.4 (4.1–7.1)                         26.8 (23.7–30.1)
 Sex
  Men                                              11.0 (9.7–12.4)                          3.1 (2.3–4.2)                         14.0 (12.3–15.5)
  Women                                            9.5 (8.5–10.6)                           2.5 (2.0–3.2)                         12.0 (11.0–13.2)
 Race/ethnicity
  White, non-Hispanic                              9.4 (8.4–10.5)                           2.5 (1.9–3.3)                         11.9 (10.9–13.0)
  Black, non-Hispanic                             13.3 (11.9–14.9)                          3.0 (2.0–4.5)                         16.4 (14.7–18.2)
  Asian, non-Hispanic                              11.2 (9.5–13.3)                          4.6 (2.8–7.2)                         14.9 (12.0–18.2)
  Hispanic                                         10.3 (8.1–13.1)                          3.5 (2.5–4.8)                         14.7 (12.5–17.3)

Notes: CI = confidence interval. Diagnosed diabetes was based on self-report. Undiagnosed diabetes was based on fasting plasma glucose and A1C levels
among people self-reporting no diabetes. Numbers for subgroups may not add up to the total because of rounding. Age-adjusted estimates are presented
in Appendix Table 1.
Data source: 2013–2016 National Health and Nutrition Examination Survey.

                                                                              2
National Diabetes Statistics Report, 2020
Table 1b. Estimated number of adults aged 18 years or older with diagnosed diabetes, undiagnosed diabetes,
and total diabetes, United States, 2018
Diagnosed diabetes Undiagnosed diabetes Total diabetes
Characteristic Number in Millions Number in Millions Number in Millions
(95% CI) (95% CI) (95% CI)
Total 26.8 (24.4–29.1) 7.3 (6.3–8.4) 34.1 (31.6–36.6)
Age in years
18–44 3.6 (3.0–4.1) 1.4 (0.8–1.9) 4.9 (4.0–5.8)
45–64 11.7 (10.3–13.1) 3.1 (2.3–3.9) 14.8 (13.4–16.3)
≥65 11.5 (10.1–12.8) 2.9 (2.1–3.6) 14.3 (12.7–15.9)
Sex
Men 14.0 (12.4–15.6) 3.9 (2.8–5.0) 17.9 (16.2–19.6)
Women 12.8 (11.4–14.1) 3.4 (2.7–4.1) 16.2 (14.8–17.6)
Race/ethnicity
White, non-Hispanic 15.4 (13.8–17.0) 4.1 (3.1–5.2) 19.5 (17.9–21.2)
Black, non-Hispanic 4.2 (3.8–4.7) 0.9 (0.6–1.3) 5.2 (4.7–5.7)
Asian, non-Hispanic 1.6 (1.3–2.0) 0.7 (0.4–1.0) 2.3 (1.9–2.8)
Hispanic 4.9 (4.1–5.6) 1.5 (1.0–1.9) 6.4 (5.4–7.3)
Notes: CI = confidence interval. Estimated numbers for 2018 were derived from percentages for 2013–2016 applied to July 1, 2018 US resident population estimates
from the US Census Bureau (See Detailed Methods). Diagnosed diabetes was based on self-report. Undiagnosed diabetes was based on fasting plasma glucose and
A1C levels among people self-reporting no diabetes. Numbers for subgroups may not add up to the total because of rounding.
Data sources: 2013–2016 National Health and Nutrition Examination Survey; 2018 US Census Bureau data.
Trends in Prevalence of Diagnosed Diabetes, Undiagnosed Diabetes, and Total Diabetes
• During 1999–2016, the age-adjusted prevalence of total diabetes significantly increased among adults
aged 18 years or older (Figure 1).
• Prevalence estimates were 9.5% in 1999–2002 and 12.0% in 2013–2016 (Appendix Table 2).
• During this period, the age-adjusted prevalence significantly increased for diagnosed diabetes. No
significant change in undiagnosed diabetes prevalence was detected (Figure 1; Appendix Table 2).
Figure 1. Trends in Age-adjusted
age-adjusted prevalence Percentage
14
of diagnosed diabetes,
undiagnosed diabetes, Total Diabetes
12
and total diabetes among
adults aged 18 years 10
or older, United States, Diagnosed Diabetes
1999–2016. 8
6
Notes: Diagnosed diabetes was
based on self-report. Undiagnosed 4 Undiagnosed Diabetes
diabetes was based on fasting plasma
glucose and A1C levels among people 2
self-reporting no diabetes.
Data source: 1999–2016 National Health 0
and Nutrition Examination Surveys. 1999–2000 2001–2002 2003–2004 2005–2006 2007–2008 2009–2010 2011–2012 2013–2014 2015–2016
Time Period
3National Diabetes Statistics Report, 2020
Prevalence of Diagnosed Diabetes
(See Detailed Methods)
Among the US population overall, crude estimates for 2018 were:
• 26.9 million people of all ages—or 8.2% of the US population—had diagnosed diabetes.
• 210,000 children and adolescents younger than age 20 years—or 25 per 10,000 US youths—
had diagnosed diabetes. This includes 187,000 with type 1 diabetes.
• 1.4 million adults aged 20 years or older—or 5.2% of all US adults with diagnosed diabetes—reported
both having type 1 diabetes and using insulin.
• 2.9 million adults aged 20 years or older—or 10.9% of all US adults with diagnosed diabetes—started
using insulin within a year of their diagnosis.
Among US adults aged 18 years or older, age-adjusted data for 2017–2018 indicated the following:
• Prevalence of diagnosed diabetes was highest among American Indians/Alaska Natives (14.7%),
people of Hispanic origin (12.5%), and non-Hispanic blacks (11.7%), followed by non-Hispanic Asians
(9.2%) and non-Hispanic whites (7.5%) (Appendix Table 3).
• American Indians/Alaska Natives had the highest prevalence of diagnosed diabetes for women (14.8%)
(Figure 2; Appendix Table 3).
• American Indian/Alaska Native men had a significantly higher prevalence of diagnosed diabetes
(14.5%) than non-Hispanic black (11.4%), non-Hispanic Asian (10.0%), and non-Hispanic white
(8.6%) men (Figure 2; Appendix Table 3).
• Among adults of Hispanic origin, Mexicans (14.4%) and Puerto Ricans (12.4%) had the highest
prevalences, followed by Central/South Americans (8.3%) and Cubans (6.5%) (Appendix Table 3).
• Among non-Hispanic Asians, Asian Indians (12.6%) and Filipinos (10.4%) had the highest prevalences,
followed by Chinese (5.6%). Other Asian groups had a prevalence of 9.9% (Appendix Table 3).
• Among adults, prevalence varied significantly by education level, which is an indicator of
socioeconomic status. Specifically, 13.3% of adults with less than a high school education had
diagnosed diabetes versus 9.7% of those with a high school education and 7.5% of those with more
than a high school education (Appendix Table 3).
Figure 2. Age-adjusted Age-adjusted Men Women
Percentage
estimated prevalence 16
of diagnosed diabetes
by race/ethnicity group 14
and sex for adults aged 12
18 years or older, United
States, 2017–2018 10
8
6
Note: Error bars represent upper
and lower bounds of the 95%
4
confidence interval.
Data sources: 2017–2018 National 2
Health Interview Survey; 2017
Indian Health Service National Data 0
American Indian/ Asian, Non-Hispanic Black, Non-Hispanic Hispanic White, Non-Hispanic
Warehouse (for American Indian/
Alaska Native
Alaska Native group only). Race/Ethnicity
4National Diabetes Statistics Report, 2020
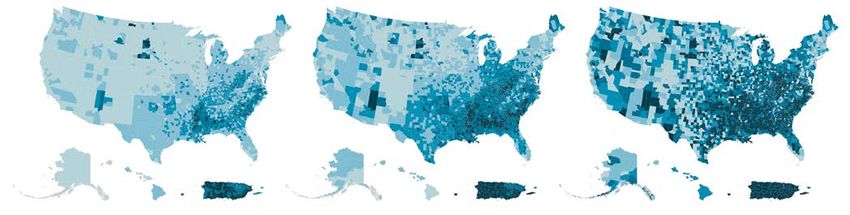
County-Level Prevalence Among Adults (See Detailed Methods)
Among US adults aged 20 years or older, age-adjusted, county-level data indicated:
• In 2016, estimates of diagnosed diabetes prevalence varied across US counties, ranging from
1.5% to 33.0% (Figure 3).
• Median county-level prevalence of diagnosed diabetes increased from 7.8% in 2004 to 13.1%
in 2016.
Figure 3. Age-adjusted, county-level prevalence of diagnosed diabetes among adults aged 20 years or older,
United States, 2004, 2008, and 2016
2004 2008 2016
% 1.5–6.9 7.0–8.4 8.5–9.8 9.9–12.1 12.2–33.0
Note: Data were unavailable for some US territories.
Data sources: US Diabetes Surveillance System; Behavioral Risk Factor Surveillance System.
Incidence of Diagnosed Diabetes (Newly Diagnosed Diabetes)
Incidence Among Adults
Among US adults aged 18 years or older, crude estimates for 2018 were:
• 1.5 million new cases of diabetes—or 6.9 per 1,000 persons—were diagnosed (Table 2).
• Compared to adults aged 18 to 44 years, incidence rates of diagnosed diabetes were higher among
adults aged 45 to 64 years and those aged 65 years and older (Table 2).
Among US adults aged 18 years or older, age-adjusted data for 2017–2018 indicated:
• Non-Hispanic blacks (8.2 per 1,000 persons) and people of Hispanic origin (9.7 per 1,000 persons) had
a higher incidence compared to non-Hispanic whites (5.0 per 1,000 persons) (Appendix Table 4).
5National Diabetes Statistics Report, 2020
Table 2. Estimated crude incidence of diagnosed diabetes among adults aged 18 years or older, United States,
2017–2018
Population Estimates, 2018a Incidence Estimates, 2017–2018
Characteristic
Number in thousands (95% CI) Rate per 1,000 (95% CI)
Total 1,483 (1,289–1,677) 6.9 (5.8–8.3)b
Age in years
18–44 452 (343–561) 4.3 (3.2–5.9)b
45–64 706 (571–840) 9.9 (7.6–12.8)b
≥65 326 (253–398) 8.8 (6.5–11.9)b
Sex
Men 745 (614–875) 7.3 (5.8–8.3)b
Women 738 (601–876) 6.6 (5.1–8.4)b
Race/ethnicity
White, non-Hispanic 786 (666–906) 5.4 (4.6–6.3)
Black, non-Hispanic 213 (148–279) 7.9 (5.9–10.8)
Asian, non-Hispanic 97 (58–137) 7.2 (4.8–10.8)
Hispanic 334 (204–464) 9.0 (6.1–13.3)
CI = confidence interval.
a
Population estimates for 2018 were derived from rates for 2017–2018 applied to July 1, 2018 US resident population estimates from the US Census Bureau
(See Detailed Methods).
b
Rates were calculated using 2018 data only.
Data sources: 2017–2018 National Health Interview Survey and 2018 US Census Bureau data.
Trends in Incidence Among Adults
• Among adults aged 18 years or older, the age-adjusted incidence of diagnosed diabetes was similar in
2000 (6.2 per 1,000 adults) and 2018 (6.7 per 1,000 adults). A significant decreasing trend in incidence
was detected from 2008 (8.4 per 1,000 adults) through 2018. (Figure 4).
Figure 4. Trends in Age-adjusted
Rate per 1,000
age-adjusted incidence of
14
diagnosed diabetes among
adults aged 18 years or older,
United States, 2000–2018 12
10
8
6
4
Notes: Data shown are estimated incidence
2
rates (solid blue line) and 95% confidence
intervals (shaded). Joinpoint identified in 2008
(See Detailed Methods). 0
Data source: 2000–2018 National Health 2000 2002 2004 2006 2008 2010 2012 2014 2016 2018
Interview Survey. Year
6National Diabetes Statistics Report, 2020
County-Level Incidence Among Adults
Among US adults aged 20 years or older, age-adjusted, county-level data indicated:
• Estimates of diagnosed diabetes incidence varied across US counties, ranging from 1.2 to 46.2 per
1,000 persons in 2016 (For more detail, see US Diabetes Surveillance System).
• Median county-level incidence of diagnosed diabetes was 10.1, 11.0 and 10.3 per 1,000 persons in
2004, 2008, and 2016, respectively (For more detail, see US Diabetes Surveillance System).
Incidence Among Children and Adolescents
Data from the SEARCH for Diabetes in Youth Study indicated that during 2014–2015, the estimated
annual number of newly diagnosed cases in the United States included:
• 18,291 children and adolescents younger than age 20 years with type 1 diabetes.
• 5,758 children and adolescents age 10 to 19 years with type 2 diabetes.
Trends in Incidence Among Children and Adolescents
Among US children and adolescents aged less than 20 years, modeled data in Figure 5 showed:
• For the period 2002–2015, overall incidence of type 1 diabetes significantly increased.
• During 2002–2010, Hispanic children and youth had the largest significant increases in incidence
of type 1 diabetes.
• During 2011–2015, non-Hispanic Asian and Pacific Islander children and youth had the largest
significant increases in incidence of type 1 diabetes.
Among US children and adolescents aged 10 to 19 years, modeled data in Figure 5 showed:
• For the entire period 2002–2015, overall incidence of type 2 diabetes significantly increased.
• During the 2002–2010 and 2011–2015 periods, changes in incidence of type 2 diabetes were
consistent across race/ethnic groups. Specifically, incidence of type 2 diabetes remained stable among
non-Hispanic whites and significantly increased for all others, especially non-Hispanic blacks.
Figure 5. Trends in incidence of type 1 and type 2 diabetes in youth, overall and by race/ethnicity, 2002–2015
50 Type 1 Diabetes (age 0–19 years) 50 Type 2 Diabetes (age 10 –19 years)
Incidence per 100,000
Incidence per 100,000
40 40
30 30
20 20
10 10
0 0
2003 2005 2007 2009 2011 2013 2015 2003 2005 2007 2009 2011 2013 2015
Index Year Index Year
White, non-Hispanic Black, non-Hispanic Hispanic Asian Pacific Islander, non-Hispanic Overall
Note: Adapted from Divers et al. (2020).1 Data are model-adjusted incidence estimates (See Detailed Methods).
Data source: SEARCH for Diabetes in Youth Study.
7National Diabetes Statistics Report, 2020
Prevalence of Prediabetes Among Adults
• An estimated 88 million adults aged 18 years or older had prediabetes in 2018 (Table 3).
• Among US adults aged 18 years or older, crude estimates for 2013–2016 were:
» 34.5% of all US adults had prediabetes, based on their fasting glucose or A1C level (Table 3).
» 10.5% of adults had prediabetes based on both elevated fasting plasma glucose and A1C levels
(Appendix Table 5).
» 15.3% of adults with prediabetes reported being told by a health professional that they had this
condition (Table 3).
Among US adults aged 18 years or older, age-adjusted data for 2013–2016 indicated:
• A higher percentage of men (37.4%) than women (29.2%) had prediabetes (Appendix Table 6).
• Prevalence of prediabetes was similar among all racial/ethnic groups and education levels
(Appendix Table 6).
Table 3. Estimated number, percentage, and awareness of prediabetesa among adults aged 18 years or older,
United States, 2013–2016 and 2018
Prediabetes,a Prediabetes,a Prediabetes Awareness,b
Characteristic 2018 Estimates 2013–2016 Estimates 2013–2016 Estimates
Number in millions (95% CI) Percentage (95% CI) Percentage (95% CI)
Total 88.0 (82.2–93.8) 34.5 (32.2–36.9) 15.3 (12.8–18.3)
Age in years
18–44 28.7 (25.3–32.1) 24.3 (21.4–27.4) 8.8 (5.9–13.0)
45–64 35.1 (33.0–37.3) 41.7 (39.1–44.4) 16.0 (12.8–19.8)
≥65 24.2 (22.0–26.4) 46.6 (42.3–51.0) 22.6 (17.2–29.1)
Sex
Men 40.9 (37.6–44.3) 38.0 (34.5–41.2) 11.4 (8.5–15.2)
Women 47.1 (42.9–51.3) 31.2 (28.6–34.0) 19.8 (15.9–24.5)
Race/ethnicity
White, non-Hispanic 54.8 (49.7–59.8) 33.9 (30.7–37.2) 15.8 (12.2–20.1)
Black, non-Hispanic 11.4 (10.4–12.5) 36.9 (33.5–40.1) 16.8 (13.6–20.5)
Asian, non-Hispanic 5.0 (4.5–5.4) 32.8 (29.6–36.2) 9.8 (6.1–15.6)
Hispanic 14.6 (13.5–15.8) 35.4 (32.6–38.3) 10.8 (8.1–14.3)
Note: CI = confidence interval. Data are crude estimates (See Detailed Methods).
a
Prediabetes was defined as fasting plasma glucose values of 100 to 125 mg/dL or A1C values of 5.7% to 6.4%.
b
Prediabetes awareness was based on self-report and estimated only among adults with prediabetes.
Data sources: 2013–2016 National Health and Nutrition Examination Survey; 2018 US Census Bureau data.
Trends in Prevalence of Prediabetes Among Adults
• There were no significant changes in age-adjusted prevalence of prediabetes from 2005–2008 to
2013–2016 (Appendix Table 7). About one-third of US adults had prediabetes over the entire period.
• Among adults with prediabetes, the age-adjusted percentage aware that they had this condition
doubled from 6.5% to 13.3% between 2005–2008 and 2013–2016 (Appendix Table 7).
8National Diabetes Statistics Report, 2020
Risk Factors for Diabetes-Related Complications
Among US adults aged 18 years or older with diagnosed diabetes, crude estimates for 2013–2016 shown
in Appendix Table 8 were:
Smoking
• 21.6% were tobacco users based on self-report or levels of serum cotinine.
• 15.0% reported current cigarette smoking.
• 36.4% had quit smoking but had a history of smoking at least 100 cigarettes in their lifetime.
Overweight and Obesity
• 89.0% were overweight or had obesity, defined as a body mass index (BMI) of 25 kg/m2 or higher.
Specifically:
» 27.6% were overweight (BMI of 25.0 to 29.9 kg/m2).
» 45.8% had obesity (BMI of 30.0 to 39.9 kg/m2).
» 15.5% had extreme obesity (BMI of 40.0 kg/m2 or higher).
Physical Inactivity
• 38.0% were physically inactive, defined as getting less than 10 minutes a week of moderate or vigorous
activity in each physical activity category of work, leisure time, and transportation.
A1C
• 50.0% had an A1C value of 7.0% or higher. Specifically:
» 22.3% had an A1C value of 7.0% to 7.9%.
» 13.2% had an A1C value of 8.0% to 9.0%.
» 14.6% had an A1C value higher than 9.0%.
• 16.3% of adults aged 18–44 years had A1C levels of 10% or higher, compared to 12.7% of those aged
45–64 years and 4.3% of those aged 65 years or older (Appendix Table 9).
High Blood Pressure
• 68.4% had a systolic blood pressure of 140 mmHg or higher or diastolic blood pressure of 90 mmHg or
higher or were on prescription medication for their high blood pressure (Appendix Table 8).
High Cholesterol*
• 43.5% had a non-HDL level of 130 mg/dL or higher. Specifically:
» 22.4% had a non-HDL level of 130 to 159 mg/dL.
» 11.2% had a non-HDL level of 160 to 189 mg/dL.
» 9.9% had a non-HDL level of 190 mg/dL or higher.
* Non-high-density lipoprotein cholesterol (non-HDL) contains all the atherogenic lipoproteins, including low-density lipoprotein cholesterol (LDL), very-low-density
lipoprotein, lipoprotein(a), and others. Growing evidence supports non-HDL as a better predictor of cardiovascular disease risk than LDL.2
9National Diabetes Statistics Report, 2020 Preventing Diabetes-Related Complications Among US adults aged 18 years or older with diagnosed diabetes, crude data for 2013–2016 shown in Appendix Table 10 indicated: Usual Source for Diabetes Care • 77.8% reported having at least one usual source of diabetes care, such as a doctor or other health care professional. Physical Activity • 24.2% met the recommended goal of at least 150 minutes per week of leisure-time physical activity. Weight Management • 77.1% reported managing or losing weight to lower their risk for developing certain diseases. Statin Treatment • 58.4% of adults aged 40–75 years were on statin therapy. A1C, Blood Pressure, Cholesterol, and Smoking (ABCs) • 19.2% met all of these criteria: A1C value
National Diabetes Statistics Report, 2020

Coexisting Conditions and Complications
Emergency Department Visits
In 2016, a total of 16 million emergency department (ED) visits were reported with diabetes as any listed
diagnosis among adults aged 18 years or older (Table 5), including:
  • 224,000 for hyperglycemic crisis (9.7 per 1,000 adults with diabetes).
  • 235,000 for hypoglycemia (10.2 per 1,000 adults with diabetes).
Table 5. Number and rate of emergency department visits per 1,000 adults aged 18 years or older with diabetes
for selected causes, United States, 2016

 Risk Factor                                                       Number in thousands                    Crude rate per 1,000 (95% CI)
 Diabetes as any listed diagnosis                                           15,965                              69.1 (63.3–74.9)
     Hyperglycemic crisis                                                      224                                9.7 (8.9–10.5)
        Diabetic ketoacidosis                                                  203                                 8.8 (8.0–9.5)
        Hyperosmolar hyperglycemic syndrome                                      21                               0.9 (0.85–1.0)
     Hypoglycemia                                                              235                                10.2 (9.4–11.0)

Note: CI = confidence interval.
Data sources: 2016 National Emergency Department Sample; 2016 National Health Interview Survey.

In 2016, of the ED visits with diabetes as any listed diagnosis among US adults aged 18 years or older,
disposition data (See Detailed Methods) indicated:
  • 59.0% were treated and released; 35.1% were admitted to the hospital; 2.3% were transferred to
      another hospital; 2.2% were transferred to a skilled nursing facility, intermediate care facility, or
      home with home health care; 1.1% left against medical advice; 0.2% died; and 0.2% had unknown
      disposition but were not admitted to a hospital.
  • Of those ED visits involving hypoglycemia, 71.0% were treated and released, 22.3% were admitted to
      the hospital, and
National Diabetes Statistics Report, 2020
Table 6. Number and rate of hospitalizations per 1,000 adults aged 18 years or older with diabetes for selected
causes, United States, 2016
Risk Factor Number in thousands Crude rate per 1,000 (95% CI)
Diabetes as any listed diagnosis 7,833 339.0 (317.6–360.4)
Major cardiovascular disease 1,740 75.3 (70.4–80.2)
Ischemic heart disease 438 18.9 (17.6–20.2)
Stroke 313 13.6 (12.7–14.5)
Lower-extremity amputation 130 5.6 (5.3–6.0)
Hyperglycemic crisis 209 9.1 (8.5–9.6)
Diabetic ketoacidosis 188 8.1 (7.6–8.7)
Hyperosmolar hyperglycemic syndrome 21 0.9 (0.85–1.0)
Hypoglycemia 57 2.5 (2.3–2.6)
Note: CI = confidence interval.
Data sources: 2016 National Inpatient Sample; 2016 National Health Interview Survey.
Kidney Disease (See Detailed Methods)
Among US adults aged 18 years or older with diagnosed diabetes, crude estimates for 2013–2016 were:
• 37.0% (95% CI, 33.0%–41.2%) had chronic kidney disease (stages 1–4), of which over half (52.5%) had
moderate to severe chronic kidney disease (stage 3 or 4).
• 24.9% (95% CI, 19.4%–31.4%) with moderate to severe chronic kidney disease (stage 3 or 4) were aware
of their kidney disease.
In 2017:
• Crude prevalence of end-stage kidney disease with diabetes listed as the primary cause was 38.6%
(288,451 out of 746,557 people). Consequently, diabetes was the leading cause of end-stage kidney
disease, followed by high blood pressure (25.9%), and glomerulonephritis (15.5%).
• Crude incidence of end-stage kidney disease with diabetes as the primary cause was 180.3 per
1 million population (58,372 new cases).
Vision Disability (See Detailed Methods)
• Diabetes is the leading cause of new cases of blindness among adults aged 18–64 years.
• Among US adults aged 18 years or older with diagnosed diabetes, crude data for 2018 indicated:
» 11.7% (95% CI, 11.0%–12.5%) reported vision disability, including blindness.
Deaths4
• In 2017, diabetes was the seventh leading cause of death in the United States. This finding is based
on 83,564 death certificates in which diabetes was listed as the underlying cause of death (crude rate,
25.7 per 100,000 persons).
• In 2017, there were 270,702 death certificates with diabetes listed as the underlying or contributing
cause of death (crude rate, 83.1 per 100,000 persons).
12National Diabetes Statistics Report, 2020
Costs5
• The total direct and indirect estimated costs of diagnosed diabetes in the United States in 2017 was
$327 billion.
• Total direct estimated costs of diagnosed diabetes increased from $188 billion in 2012 to $237 billion
in 2017 (2017 dollars); total indirect costs increased from $73 billion to $90 billion in the same period
(2017 dollars).
• Between 2012 and 2017, excess medical costs per person associated with diabetes increased from
$8,417 to $9,601 (2017 dollars).
13National Diabetes Statistics Report, 2020
ACKNOWLEDGMENTS
The following organizations collaborated on the content of this report:
• Centers for Disease Control and Prevention, National Center for Chronic Disease Prevention and Health
Promotion, Division of Diabetes Translation
• Indian Health Service, Division of Diabetes Treatment and Prevention
• American Diabetes Association
• National Institutes of Health, National Institute of Diabetes and Digestive and Kidney Diseases
• Centers for Disease Control and Prevention, National Center for Health Statistics
• JDRF
REFERENCES
1. Divers J, Mayer-Davis EJ, Lawrence JM, et al. Trends in Incidence of Type 1 and Type 2 Diabetes Among
Youths— Selected Counties and Indian Reservations, United States, 2002–2015. MMWR Morb Mortal Wkly
Rep. 2020 Feb 14;69(6):161–165.
2. Su X, Kong Y, Peng D. Evidence for changing lipid management strategy to focus on non-high density
lipoprotein cholesterol. Lipids Health Dis. 2019 Jun 7;18(1):134.
3. American Diabetes Association. Standards of Medical Care in Diabetes—2019. Diabetes Care. 2019 Jan 1; 42
(Supplement 1).
4. Centers for Disease Control and Prevention. National Center for Health Statistics. Underlying Cause of Death
1999–2017 on CDC WONDER Online Database, 2018. Accessed at http://wonder.cdc.gov/ucd-icd10.html on
Oct 10, 2019.
5. American Diabetes Association. Economic costs of diabetes in the US in 2017. Diabetes Care. 2018
May;41(5):917–928.
SUGGESTED CITATION
Centers for Disease Control and Prevention. National Diabetes Statistics Report, 2020. Atlanta, GA: Centers
for Disease Control and Prevention, U.S. Dept of Health and Human Services; 2020.
14National Diabetes Statistics Report, 2020
APPENDIX A: Detailed Tables
Appendix Table 1. Age-adjusted prevalence of diagnosed, undiagnosed, and total diabetes among adults aged
18 years or older, United States, 2013–2016.
Diagnosed diabetes Undiagnosed diabetes Total diabetes
Characteristic
Percentage (95% CI) Percentage (95% CI) Percentage (95% CI)
Total 9.4 (8.6–10.2) 2.6 (2.2–3.1) 12.0 (11.1–12.9)
Sex
Men 10.4 (9.2–11.7) 3.0 (2.2–4.0) 13.3 (12.0–14.8)
Women 8.6 (7.7–9.5) 2.2 (1.8–2.8) 10.8 (9.9–11.8)
Race/ethnicity
White, Non-Hispanic 7.9 (7.2–8.7) 2.2 (1.6–2.9) 10.0 (9.2–11.0)
Black, Non-Hispanic 13.7 (12.5–15.1) 3.0 (2.0–4.5) 16.8 (15.4–18.1)
Asian, Non-Hispanic 11.3 (9.2–13.7) 4.7 (3.0–7.3) 16.0 (13.7–18.5)
Hispanic 13.7 (12.1–15.6) 4.1 (3.1–5.4) 17.9 (16.0–19.9)
Education
Less than high school 12.7 (11.4–14.2) 3.9 (2.5–5.8) 16.6 (14.8–18.6)
High school 9.7 (8.5–11.1) 3.0 (2.1–4.4) 12.8 (11.1–14.7)
More than high school 8.3 (7.3–9.5) 2.2 (1.6–2.8) 10.5 (9.4–11.8)
Note: CI = confidence interval.
Data source: 2013–2016 National Health and Nutrition Examination Survey.
Appendix Table 2. Trends in age-adjusted prevalence of diagnosed, undiagnosed, and total diabetes among
adults aged 18 years or older, United States, 1999–2016.
Diagnosed diabetesa Undiagnosed diabetes Total diabetesa
Time Period
Percentage (95% CI) Percentage (95% CI) Percentage (95% CI)
1999–2002 6.4 (5.8–7.0) 3.1 (2.6–3.7) 9.5 (8.7–10.4)
2001–2004 7.1 (6.5–7.8) 3.2 (2.7–3.8) 10.3 (9.4–11.3)
2003–2006 7.4 (6.7–8.1) 2.8 (2.2–3.6) 10.2 (9.3–11.2)
2005–2008 7.7 (6.9–8.5) 2.9 (2.4–3.6) 10.6 (9.6–11.6)
2007–2010 7.9 (7.1–8.7) 3.2 (2.7–3.7) 11.1 (10.1–12.2)
2009–2012 8.1 (7.4–8.9) 3.2 (2.6–3.8) 11.3 (10.3–12.3)
2011–2014 8.7 (8.1–9.4) 2.7 (2.3–3.3) 11.5 (10.7–12.3)
2013–2016 9.4 (8.6–10.2) 2.6 (2.2–3.1) 12.0 (11.1–12.9)
a
p-value for linear trendNational Diabetes Statistics Report, 2020
Appendix Table 3. Age-adjusted prevalence of diagnosed diabetes by detailed race/ethnicity, education level,
and sex among adults aged 18 years or older, United States, 2017–2018.
Total Men Women
Characteristic
Percentage (95% CI) Percentage (95% CI) Percentage (95% CI)
Race/ethnicity
American Indian/Alaska Native 14.7 (14.6–14.7) 14.5 (14.4–14.6) 14.8 (14.7–14.9)
Asian, non-Hispanic, overall 9.2 (8.0–10.5) 10.0 (8.3–12.0) 8.5 (7.0–10.5)
Asian Indian 12.6 (9.3–16.7) 13.9 (10.3–18.6) 11.1 (6.6–18.0)
Chinese 5.6 (3.9–8.1) 5.9 (3.5–9.8) 5.3 (3.2–8.8)
Filipino 10.4 (8.1–13.4) 10.9 (7.6–15.4) 10.0 (6.8–14.6)
Other Asian 9.9 (8.1–12.2) 11.5 (8.5–15.3) 8.7 (6.2–11.9)
Black, non-Hispanic 11.7 (10.8–12.7) 11.4 (10.0–12.9) 12.0 (10.9–13.1)
Hispanic, overall 12.5 (11.5–13.5) 13.7 (12.3–15.2) 11.6 (10.2–13.0)
Central/South American 8.3 (8.0–8.6) 9.2 (8.8–9.6) 7.6 (7.2–8.0)
Cuban 6.5 (4.6–9.2) 7.3 (4.2–12.5) 6.0 (3.6–9.8)
Mexican 14.4 (13.1–15.8) 16.2 (14.2–18.3) 12.8 (11.1–14.8)
Puerto Rican 12.4 (10.1–15.1) 13.0 (9.5–17.6) 11.9 (9.0–15.5)
White, non-Hispanic 7.5 (7.2–7.8) 8.6 (8.1–9.0) 6.6 (6.2–7.0)
Education
Less than high school 13.3 (12.4–14.2) 13.0 (11.8–14.4) 13.6 (12.3–15.1)
High school 9.7 (9.1–10.4) 11.2 (10.4–12.1) 8.6 (7.9–9.4)
More than high school 7.5 (7.2–7.9) 8.3 (7.8–8.8) 6.8 (6.4–7.3)
Note: CI = confidence interval.
Data sources: 2017–2018 National Health Interview Survey, except American Indian/Alaska Native data, which were from the Indian Health Service National Data
Warehouse (2017 data only).
16National Diabetes Statistics Report, 2020
Appendix Table 4. Age-adjusted incidence of diagnosed diabetes among adults aged 18 years or older, United
States, 2017–2018.
Characteristic Rate per 1,000 (95% CI)
Total 6.7 (5.7–8.0)a
Sex
Men 7.2 (5.7–9.0)a
Women 6.3 (4.9–8.0)a
Race/ethnicity
White, non-Hispanic 5.0 (4.3–5.8)
Black, non-Hispanic 8.2 (6.0–11.0)
Asian, non-Hispanic 7.4 (4.9–10.9)
Hispanic 9.7 (6.7–14.0)
Education
Less than high school 11.5 (8.3–15.9)
High school 6.0 (4.8–7.5)
More than high school 5.6 (4.7–6.7)
a
Rate calculated using 2018 data only.
Note: CI = confidence interval.
Data source: 2017–2018 National Health Interview Survey.
Appendix Table 5. Age-adjusted prevalence of prediabetes according to various definitions of hyperglycemia
among adults aged 18 years or older, United States, 2013–2016.
Definition 1 Definition 2 Definition 3 Definition 4
Characteristic
Percentage (95% CI) Percentage (95% CI) Percentage (95% CI) Percentage (95% CI)
Total 33.3 (31.1–35.7) 38.0 (35.2–40.8) 22.0 (20.4–23.6) 10.5 (9.4–11.7)
Age, yearsa
18–44 24.3 (21.4–27.4) 29.1 (25.2–33.3) 12.9 (11.0–15.2) 5.3 (4.1–6.7)
45–64 41.7 (39.1–44.4) 46.3 (43.5–49.1) 30.1 (27.8–32.5) 13.7 (11.5–16.2)
≥65 46.6 (42.3–51.0) 51.0 (46.5–55.5) 35.9 (31.6–40.3) 21.3 (18.0–25.0)
Sex
Men 37.4 (33.9–40.9) 42.3 (38.1–46.5) 22.2 (20.0–23.3) 11.8 (9.9–13.9)
Women 29.2 (26.7–31.8) 33.7 (30.7–36.8) 21.6 (20.0–23.3) 9.3 (8.1–10.7)
Race/ethnicity
White, non-Hispanic 31.0 (27.8–34.4) 35.5 (31.7–39.5) 18.9 (16.9–21.0) 9.2 (7.9–10.7)
Black, non-Hispanic 36.6 (33.7–39.6) 38.6 (35.3–42.1) 31.9 (29.7–34.3) 11.5 (9.6–13.7)
Asian, non-Hispanic 33.0 (29.6–36.7) 39.9 (35.7–44.3) 21.7 (19.0–24.6) 10.2 (8.2–12.7)
Hispanic 36.1 (33.5–38.9) 42.3 (39.1–45.6) 23.8 (21.3–26.5) 12.9 (11.2–15.0)
continued on next page ➔
17National Diabetes Statistics Report, 2020
Definition 1 Definition 2 Definition 3 Definition 4
Characteristic
Percentage (95% CI) Percentage (95% CI) Percentage (95% CI) Percentage (95% CI)
Education
Less than high school 37.2 (32.7–42.1) 42.5 (37.6–47.5) 24.4 (20.8–28.5) 12.0 (9.6–14.9)
High school 35.7 (32.5–39.1) 41.2 (37.5–45.1) 25.2 (22.2–28.4) 11.4 (9.3–14.0)
More than high school 31.3 (28.9–33.9) 35.5 (32.7–38.4) 20.1 (18.1–22.2) 9.8 (8.7–11.0)
a
Estimates are crude.
Definition 1: Any of: A1C 5.7–6.4% or fasting plasma glucose 100–125 mg/dL.
Definition 2: Any of: A1C 5.7–6.4%, fasting plasma glucose 100–125 mg/dL, or 2-hour plasma glucose from oral glucose tolerance test 140–199 mg/dL.
Definition 3: Any of: A1C 5.7–6.4% or fasting plasma glucose 110–125 mg/dL.
Definition 4: Both A1C 5.7–6.4% and fasting plasma glucose 100–125 mg/dL.
Note: CI = confidence interval.
Data source: 2013–2016 National Health and Nutrition Examination Survey.
Appendix Table 6. Age-adjusted prevalence and awareness of prediabetes among adults aged 18 years or older,
United States, 2013–2016.
Prediabetesa Prediabetes Awareness b
Characteristic
Percentage (95% CI) Percentage (95% CI)
Total 33.3 (31.1–35.7) 13.3 (11.0–16.0)
Sex
Men 37.4 (33.9–40.9) 10.3 (7.7–13.6)
Women 29.2 (26.7–31.8) 17.5 (13.0–23.1)
Race/ethnicity
White, non-Hispanic 31.0 (27.8–34.4) 13.6 (9.9–18.4)
Black, non-Hispanic 36.6 (33.7–39.6) 15.1 (12.0–18.8)
Asian, non-Hispanic 33.0 (29.6–36.7) 8.3 (5.1–13.4)
Hispanic 36.1 (33.5–38.9) 11.5 (8.8–14.9)
Education
Less than high school 37.2 (32.7–42.1) 8.7 (5.9–12.6)
High school 35.7 (32.5–39.1) 13.1 (8.4–19.6)
More than high school 31.3 (28.9–33.9) 15.0 (11.4–19.5)
a
Prediabetes was defined as fasting plasma glucose values of 100 to 125 mg/dL or A1C values of 5.7% to 6.4%.
b
Prediabetes awareness was based on self-report and estimated only among adults with prediabetes.
Note: CI = confidence interval.
Data source: 2013–2016 National Health and Nutrition Examination Survey.
18National Diabetes Statistics Report, 2020
Appendix Table 7. Trends in age-adjusted prevalence and awareness of prediabetes among adults aged 18 years
or older, United States, 2005–2016.
Prediabetes a Prediabetes Awarenessb, c
Time Period
Percentage (95% CI) Percentage (95% CI)
2005–2008 33.6 (31.9–35.2) 6.5 (5.3–7.9)
2007–2010 36.3 (34.6–38.1) 8.2 (6.7–9.9)
2009–2012 35.2 (33.2–37.3) 10.0 (8.3–11.9)
2011–2014 33.0 (30.7–35.4) 10.7 (9.0–12.5)
2013–2016 33.3 (31.1–35.6) 13.3 (11.0–16.0)
Note: CI = confidence interval.
a
Prediabetes was defined as fasting plasma glucose values of 100 to 125 mg/dL or A1C values of 5.7% to 6.4%.
b
Prediabetes awareness was based on self-report and estimated only among adults with prediabetes.
c
p-value for linear trend 10 ng/mL 21.6 (18.5–25.0)
Current cigarette smoker based on self-report 15.0 (12.6–17.7)
Former cigarette smoker 36.4 (33.4–39.5)
Overweight and obesity, according to body mass index (BMI)
BMI ≥25.0 kg/m2 89.0 (86.6–91.1)
BMI 25.0–29.9 kg/m2 27.6 (24.8–30.6)
BMI 30.0–39.9 kg/m 2
45.8 (42.1–49.5)
BMI ≥40.0 kg/m2 15.5 (13.0–18.3)
Physical inactivity 38.0 (34.1–42.0)
A1C
A1C≥7.0% 50.0 (46.2–53.8)
A1C 7.0–7.9% 22.3 (19.5–25.4)
A1C 8.0–9.0% 13.2 (10.7–16.2)
A1C>9.0% 14.6 (12.1–17.4)
High blood pressure
Blood pressure ≥140/90 mmHg or taking antihypertensive medication 68.4 (64.6–72.0)
High cholesterol, according to non-HDL cholesterol
Non-HDL ≥130 mg/dL 43.5 (39.6–47.5)
Non-HDL 130–159 mg/dL 22.4 (18.9–26.3)
Non-HDL 160–189 mg/dL 11.2 (8.5–14.6)
Non-HDL ≥190 mg/dL 9.9 (7.2–13.4)
Notes: CI = confidence interval. Former cigarette smoker was based on serum cotinine levels ≤10 ng/mL, a history of smoking at least 100 cigarettes in their lifetime,
and a self-report of no current cigarette smoking. Physical inactivity was based on self-report of less than 10 minutes per week of moderate or vigorous activity in
each of the physical activity categories of work, leisure time, and transportation.
19National Diabetes Statistics Report, 2020
Data source: 2013–2016 National Health and Nutrition Examination.
Appendix Table 9. Distribution of A1C levels among adults with diagnosed diabetes aged 18 years or older,
overall and by age group, United States, 2013–2016.
A1C Total 18–44 years 45–64 years ≥65 yearsNational Diabetes Statistics Report, 2020
APPENDIX B: Detailed Methods and Data Sources
This section provides additional information about data sources and methods used in the National
Diabetes Statistics Report, 2020.
Prevalence of Diabetes (Diagnosed and Undiagnosed) Among People of All
Ages, United States, 2018
Data Sources
• 2013–2016 National Health and Nutrition Examination Survey (NHANES), National Center for Health
Statistics, Centers for Disease Control and Prevention.
• 2017–2018 National Health Interview Survey (NHIS), National Center for Health Statistics, Centers for
Disease Control and Prevention.
• Annual Estimates of the Resident Population by Sex, Single Year of Age, Race, and Hispanic Origin for
the United States: April 1, 2010 to July 1, 2018, Population Division, US Census Bureau.
Methods
The total number of people with diabetes is the sum of the number of those aged 18 years or older
with diagnosed or undiagnosed diabetes and the number of those younger than age 18 years with
diagnosed diabetes. Undiagnosed diabetes for children and adolescents younger than age 18 years was
not assessed due to insufficient sample size for reliable estimates. The 2013–2016 NHANES was used to
calculate the percentage of adults aged 18 years or older with diagnosed and undiagnosed diabetes
(see next section for detail). The 2017–2018 NHIS was used to calculate the percentage of children and
adolescents younger than 18 years with diagnosed diabetes. These percentages were then applied to the
corresponding July 1, 2018 US resident population estimates from the US Census Bureau to derive the
total number of people with diabetes.
Applying 2013–2016 NHANES estimates to the 2018 US resident population estimates has limitations. This
methodology assumes that the prevalence of diabetes in 2018 was the same as it was in earlier periods
(2013–2016) and that the prevalence of diabetes in the resident population was identical to those in the
civilian, noninstitutionalized population (from NHANES). Deviations from these assumptions may result in
overestimated or underestimated numbers and rates.
Prevalence of Diabetes (Diagnosed and Undiagnosed) Among Adults Aged 18
Years or Older, United States, 2013–2016 and 2018
Data Sources
• 2013–2016 National Health and Nutrition Examination Survey (NHANES), National Center for Health
Statistics (NCHS), Centers for Disease Control and Prevention.
• Annual Estimates of the Resident Population by Sex, Single Year of Age, Race, and Hispanic Origin for
the United States: April 1, 2010 to July 1, 2018, Population Division, US Census Bureau.
Methods
The percentage of adults aged 18 years or older with diabetes (diagnosed or undiagnosed) was
estimated using 2013–2016 NHANES data. People who self-reported being told by a doctor or health
professional that they had diabetes (other than during pregnancy) were classified as having diagnosed
diabetes. Those not reporting a history of diagnosed diabetes but who had either a fasting plasma
21National Diabetes Statistics Report, 2020
glucose greater than or equal to 126 mg/dl or an A1C level greater than or equal to 6.5% were classified
as having undiagnosed diabetes. For consistency with earlier estimates, fasting glucose values were
adjusted using backward regression equations provided by NCHS. People with missing values for either
fasting glucose or A1C and pregnant women were excluded. People with diagnosed diabetes from the
interviewed sample were combined with people with undiagnosed diabetes from the fasting plasma
glucose subsample. Appropriate sampling weights were used so that estimates were representative of
the total US adult population.
To estimate the number of adults with diagnosed and undiagnosed diabetes, the age-, sex-, race/
ethnicity-specific percentages from three-way cross-tabulations were applied to the corresponding
July 1, 2018 US resident population estimates from the US Census Bureau. These subgroup-specific
numbers of adults were summed to obtain the estimated number of adults with diagnosed and
undiagnosed diabetes for the following: total population; age groups 18–44, 45–64, and 65 years or
older; men, women; non-Hispanic white, non-Hispanic black, non-Hispanic Asian, and Hispanic adults.
Age-adjusted percentages of diagnosed and undiagnosed diabetes were calculated among adults aged
18 years or older by sex, race/ethnicity, and education level by the direct method to the 2000
US Census standard population, using age groups 18–44, 45–64, and 65 years or older.
References
National Health and Nutrition Examination Survey. 2005–2006 Data Documentation, Codebook, and
Frequencies https://wwwn.cdc.gov/Nchs/Nhanes/2005-2006/GLU_D.htm.
National Health and Nutrition Examination Survey. 2007–2008 Data Documentation, Codebook, and
Frequencies https://wwwn.cdc.gov/Nchs/Nhanes/2007-2008/GLU_E.htm.
National Health and Nutrition Examination Survey. 2015–2016 Data Documentation, Codebook, and
Frequencies https://wwwn.cdc.gov/Nchs/Nhanes/2015-2016/GLU_I.htm.
Trends in Prevalence of Diagnosed Diabetes, Undiagnosed Diabetes, and Total
Diabetes Among Adults Aged 18 Years or Older, United States, 1999–2016
Data Source
• 1999–2016 National Health and Nutrition Examination Survey (NHANES), National Center for Health
Statistics, Centers for Disease Control and Prevention.
Methods
Percentages of diagnosed, undiagnosed, and total diabetes using overlapping 4-year survey periods
during 1999–2016 were calculated among adults aged 18 years or older and age-adjusted by the direct
method to the 2000 US Census standard population, using age groups 18–44, 45–64, and 65 years or
older. Joinpoint regression was used to analyze varying trends in non-overlapping 2-year estimates. This
analysis used the age-adjusted estimates and permutation tests to identify a maximum of three points
where linear trends in prevalence changed significantly in either direction or magnitude.
Reference
National Cancer Institute. Joinpoint Trend Analysis Software https://surveillance.cancer.gov/joinpoint/
22National Diabetes Statistics Report, 2020 Prevalence of Diagnosed Diabetes, United States, 2013–2016 and 2018 Data Sources • 2013–2016 National Health and Nutrition Examination Survey (NHANES), National Center for Health Statistics, Centers for Disease Control and Prevention. • 2017–2018 National Health Interview Survey (NHIS), National Center for Health Statistics, Centers for Disease Control and Prevention. • Annual Estimates of the Resident Population by Sex, Single Year of Age, Race, and Hispanic Origin for the United States: April 1, 2010 to July 1, 2018, Population Division, US Census Bureau. Methods The percentage of people with diagnosed diabetes was obtained from 2017–2018 NHIS data and 2013–2016 NHANES data. The percentage of people aged
National Diabetes Statistics Report, 2020

were averaged to provide more statistically reliable estimates. Adults aged 18 years or older who self-
reported being told by a doctor or health professional that they had diabetes were classified as having
diagnosed diabetes. Estimates of diagnosed diabetes for Native Hawaiians and Other Pacific Islanders
were not included because of small sample size.

Prevalence of diagnosed diabetes among AI/AN people was calculated using fiscal year 2017 data from
the IHS NDW. This data system includes patient registration and encounter data that are received from
IHS facilities, tribally operated programs, and urban and contract health systems. These health care
facilities serve about 2.56 million AI/AN people who belong to 573 federally recognized tribes in 37
states. Data for active patients (i.e., those with at least one encounter during the preceding 3 years) aged
18 years or older were used to calculate these estimates. Diabetes cases among these patients were
identified based on patient encounter data using International Classification of Diseases and Related
Health Problems, Ninth Revision, Clinical Modification (ICD-9-CM) diagnosis codes starting with 250 and
ICD-10-CM (Tenth Revision) diagnosis codes starting with E10, E11, or E13. Patients were considered to
have diagnosed diabetes if they had at least two encounters with one of these diagnosis codes reported
during fiscal year 2017. Estimates calculated from NHIS and IHS NDW data may not be comparable
because of differences in the datasets and the methods used to define diabetes.

Percentages for all US racial and ethnic groups estimated using NHIS and IHS NDW data were
age-adjusted, using age groups 18−44, 45−64, and 65 years or older, by the direct method to the 2000
US Census standard population.

County-Level Prevalence and Incidence of Diagnosed Diabetes Among Adults
Aged 20 Years or Older, United States, 2004, 2008, and 2016
Data Sources
 • 2003–2017 Behavioral Risk Factor Surveillance System (BRFSS), National Center for Chronic Disease
   Prevention and Health Promotion, Centers for Disease Control and Prevention.
 • Annual Estimates of the Resident Population for Selected Age Groups by Sex for the United States,
   States, Counties, and Puerto Rico Commonwealth and Municipios: April 1, 2010 to July 1, 2017,
   Population Division, US Census Bureau.
 • United States Diabetes Surveillance System (USDSS), National Center for Chronic Disease Prevention
   and Health Promotion, Centers for Disease Control and Prevention.
Methods
Year-specific, county-level estimates and maps of prevalence and incidence of diagnosed diabetes are
available from the USDSS website (https://gis.cdc.gov/grasp/diabetes/DiabetesAtlas.html). Data from
the BRFSS and the US Census Bureau’s Population Estimates Program were used to estimate county-level
prevalence and incidence of diagnosed diabetes among adults aged 20 years or older. Three years of
data were used to improve the precision of the year-specific estimates. For example, 2004 estimates
used BRFSS survey data for 2003, 2004, and 2005. County-level estimates for over 3,100 counties or
county equivalents (e.g., parish, borough, municipality) in the 50 US states, Puerto Rico, and the District
of Columbia were based on indirect model-dependent estimates using Bayesian multilevel modeling
techniques. This model-dependent approach uses a statistical model that “borrows strength” in making
an estimate for one county from BRFSS data collected in other counties. Multilevel binomial regression
models with random effects of demographic variables (age groups 20–44, 45–64, and 65 years or older;
race/ethnicity; and sex) at the county level were developed. Rates were age-adjusted to the 2000 US
Census standard population using age groups 20–44, 45–64, and 65 years or older.

                                                     24
National Diabetes Statistics Report, 2020
References
Rao JNK. Small Area Estimation. Hoboken, New Jersey: John Wiley & Sons, Inc.; 2003.
Cadwell BL, Thompson TJ, Boyle JP, Barker LE. Bayesian small area estimates of diabetes prevalence by US
county, 2005. J Data Sci. 2010;8(1):173–188.
Barker LE, Thompson TJ, Kirtland KA, Boyle JP, Geiss LS, McCauley MM, Albright AL. Bayesian small area
estimates of diabetes incidence by United States county, 2009. J Data Sci. 2013;11:249–269.
Incidence of Diagnosed Diabetes Among Adults Aged 18 Years or Older,
United States, 2018
Data Sources
• 2017–2018 National Health Interview Survey (NHIS), National Center for Health Statistics, Centers for
Disease Control and Prevention.
• 2013–2016 National Health and Nutrition Examination Survey (NHANES), National Center for Health
Statistics, Centers for Disease Control and Prevention.
• Annual Estimates of the Resident Population by Sex, Single Year of Age, Race, and Hispanic Origin for
the United States: April 1, 2010 to July 1, 2018, Population Division, US Census Bureau.
Methods
The rate of new cases of diabetes was calculated using 2018 NHIS data on respondents’ age at diagnosis
and age at interview. Two-year averages of 2017–2018 NHIS were used to improve the precision of race/
ethnicity- and education level-specific estimates. Adults who reported being diagnosed with diabetes
were asked at what age they were diagnosed. The number of years since diagnosis was calculated by
subtracting the person’s age at diagnosis from the person’s current age. Adults who had a value of zero
were identified as having been diagnosed with diabetes within the last year. In addition, half of the
adults who had a value of one were classified as having been diagnosed within the last year. To calculate
the rate, the numerator included the number of adults who were diagnosed with diabetes within the
last year. The denominator was the estimate of the adult population, excluding those who had been
diagnosed for more than 1 year and those who were categorized on the NHIS as “refused” or “don’t know”
or who had missing values on the diabetes status question.
To estimate the number of new cases of diabetes for adults in 2018, the age-, sex-, race/ethnicity-specific
rates of new cases from three-way cross-tabulations of 2017–2018 NHIS data were applied to the
corresponding July 1, 2018 US resident population estimates from the US Census Bureau after excluding
the number of adults who had been diagnosed with diabetes for more than 1 year, estimated from
NHANES. These subgroup-specific numbers of adults were summed to obtain the estimated number
of adults with newly diagnosed diabetes for the following groups: total population; age groups 18–44,
45–64, and 65 years or older; men, women; non-Hispanic white, non-Hispanic black, non-Hispanic Asian,
and Hispanic adults. Age-adjusted incidence of diagnosed diabetes was calculated among adults aged
18 years or older by sex, race/ethnicity and education level by the direct method to the 2000 US Census
standard population, using age groups 18–44, 45–64, and 65 years or older.
25You can also read