The Algorithm of Habitat Discovery in Bird Migration - Semantic Scholar
←
→
Page content transcription
If your browser does not render page correctly, please read the page content below

MATEC Web of Conferences 139, 00156 (2017)                                                          DOI: 10.1051/matecconf/201713900156
ICMITE 2017

    The Algorithm of Habitat Discovery in Bird Migration
    Zhengzheng Wei1,*, Zengzhen Shao1, Dong Chen1, and Yancong Li1
    1
        School of Information Science and Engineering, Shandong Normal University, Jinan, 250300, P.R.China

                   Abstract. Bird migration has attracted an increasing attention. The study of habitats has played a vital role
                   in the birds migratory. Previous researches, however, have encountered many problems, such as great
                   limitations on research methods, low data utilization rate, statistics-focused and ineffective data processing
                   and analysis methods. In this paper, the algorithm of habitat discovery is put forward by using computer’s
                   data-mining technology based on the spatio-temporal characteristics of bird-watching data. First the
                   algorithm detects and eliminates duplicate data to guarantee data standardization. Then density-based
                   clustering algorithms are used to identify habitats where birds gathered. Finally the habitats of birds
                   migratory are discovered.

                                                                            this method the migratory state of birds is determined in
    1 Introduction                                                          accordance with their flight speed and further the
                                                                            migratory location is obtained. Nonetheless the migratory
    All groups of birds are special in that a large number of               routes of birds still need to be manually marked and
    species migrate annually between their breeding and                     further the spatial location information is unable to be
    non-breeding areas [1]. The migration of birds has a great              processed with this method. In 2010, Zhou Yuanchun and
    impact on the environment and production life of human                  others found the birds gathering land by using the
    beings. Studying the migration of birds can help people                 density-based hierarchical clustering algorithm to cluster
    prevent the spread of epidemics and maintain species                    bird GPS, the association of the aggregation rules and
    diversity. Therefore the study of migration habitat is                  further migratory routes of birds by virtue of the Apriori
    crucial for people to protect the birds and natural                     algorithm or GSP algorithm [6]. However some defects
    environment and maintain species diversity.                             that the changes of the habitats and migratory routes of
         Various methods are adopted and developed to carry                 birds cannot be found still exist due to small amount of
    out research on migratory birds from different aspects by               data, less number of birds and short time span of the data.
    domestic and foreign researchers in order to understand                 In 2012 Li Xueyan and others established a bird-watching
    the migration patterns of birds. Among these methods, the               database using China Birding Report and displayed the
    fixed-point investigation is the earliest bird migration                changes of bird distribution of recent years by GIS [7].
    research method. The most common and most popular                       But it only relies on artificially statistical methods to
    method to study the bird migration is bird-banding[2]. It               mark bird discovery sites in the GIS, neither using the
    can be easily implemented and widely applied. But its                   “quantitative observation” to analyse the data deeply, nor
    monitoring cycle is long and the data recycling is quite                dealing with the problems of repeated sampling and
    complicated [3]. Next method is the satellite positioning               uneven distribution for the bird-watching data.
    method. Its accurately collected data can achieve                       From the above there are still a lot of problems that need
    continuous tracking to the individual bird. However it is               to be solved in the above researches which are embodied
    not suitable for small birds with high cost and difficult               in: 1) the collected data shows the following problems
    popularization as well as limited amount of data. There                 such as incomprehensive, imprecise, and limited amount;
    are also some other methods including radar monitoring,                 2) there is no much work on data standardization of
    sensitive geographical location and others. But they have               source data; 3) the amount of data for analysis and study
    low precision, difficulty in popularizing, limited data and             is relatively small; 4) the hidden knowledge in the data
    other issues. In addition, the usage and analysis of the                fails to be dug out.
    collected migration data of birds has also attracted the                In this paper, the problem of traditional biology is
    attention of researchers at home and abroad. It is analysed             abstracted as a computational problem. A feasible,
    by the early bird data that only through the track point                efficient and general method is sought to solve the above
    marked in GIS by biologists or the distribution points                  problems, to achieve the effective treatment and
    gotten by artificial statistics can migratory lands and                 utilization of bird-watching data, to find the habitats of
    migration routes be acquired [4]. In 2004, the Japanese                 migratory bird. This method can make up the
    scientist Shimazaki proposed to deal with bird flight data              shortcomings of the research of bird migration in China.
    through using the method of ISODATA clustering [5]. In

© The Authors, published by EDP Sciences. This is an open access article distributed under the terms of the Creative Commons Attribution
License 4.0 (http://creativecommons.org/licenses/by/4.0/).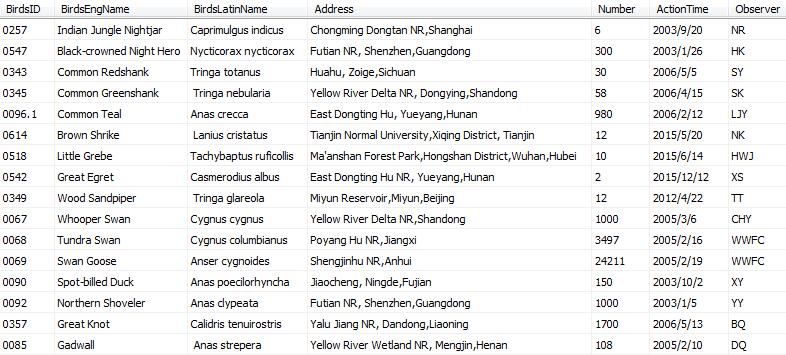
MATEC Web of Conferences 139, 00156 (2017)                                                DOI: 10.1051/matecconf/201713900156
ICMITE 2017

     2 Data source                                                   substantial data, long time span, high accuracy and
                                                                     convenient spatial-temporal data analysis [5].
     As the important supplementary information of traditional
     bird distributions, Chinese bird-watching data is
     comprehensive and reflects Chinese bird watching                3 Algorithm
     achievements accurately. These data comes from three
     aspects. The first is from the network such as Bird Report      3.1 Overview of Algorithm
     (www.birdreport.cn) [8] and China Bird Watching
     Network (www.chinabirdnet.org) [9] etc. The second              Bird migration is a relatively long and complex process
     comes from ornithological books and literature such as          which reflects in spatial and temporal changes. The study
     China Bird Report 2003-2007 [10], China Coastal                 of habitats has played a vital role in the birds migratory.
     Waterbird Census Report 2005–2011 [11]and A Checklist           In this paper Chinese bird-watching data is used as the
     and Distribution of the birds in Shandong [12]etc. The          data source. First the important attribute --"Number" (Fig
     third is provided by many ornithologists led by Prof. Sai       1) is introduced to solve the problems of repeated
     Daojian. Total 189350 bird watching records have been           sampling and uneven sampling distribution based on the
     verified by ornithologists that insure the authority of these   data characteristics of bird-watching records. The quality
     data.                                                           of the data will be improved. Then according to the
                                                                     temporal and spatial structure of the migration trajectory,
     2.1 Data characteristics                                        the time and space attributions of the bird-watching
                                                                     records are dealt with separately. The potential
     The     spatial-temporal   information      of    Chinese       information of the spatial -temporal data of bird is
     bird-watching data records including species, date,             discovered. As a consequence, the quality of data mining
     location, number and observer in detail as shown in Fig. 1.     will also be improved to some extent. This study will lead
     The following “Number” records the number of birds              to more efficient utilization, processing and analysis of
     observed in each bird watching.                                 bird-watching data and provide new perspectives and new
                                                                     ideas for the study of bird migration in China.
                                                                           Moreover migratory birds are employed as the study
                                                                     objects. This Algorithm is used to achieve two goals of
                                                                     the research: 1) to solve the problems of duplicate
                                                                     sampling and uneven distribution of sampling data; 2) to
                                                                     identify the habitats of migratory birds; These steps of the
                                                                     Algorithm are described in the following:
                                                                     1) the bird-watching data is digitized and stored in the
                                                                     database as the form of GPS track point; 2) the temporal
                                                                     and spatial distance is calculated between the points to
                                                                     discover implicit duplicate data and the special points
     Fig. 1. Chinese Bird-Watching Data                              instead of the duplicated data are used to produce a
                                                                     standardized data set; 3) the preprocessed new trajectory
                                                                     point collection is clustered by the density-based
     2.2 Data Statistics                                             clustering algorithm to obtain the high density area of the
                                                                     migratory activity that is used as a habitat during the
     The 239350 Chinese bird-watching records involve 24             migration.
     Orders, 100 Families, and 1230 Species accounting for           The relevant definitions and steps of the Algorithm are
     85.7% of China’s existing bird species [13]. The range of       described as follows in more detail.
     these records covers 34 provinces, municipalities and
     autonomous regions, including Hong Kong, Macao and
                                                                     3.2 Digitizing the Text into GPS Trajectory Points
     Taiwan approximately 46 years ranging from 1970 to the
     present. Seeing from Chinn’s bird-watching records, the         Each bird-watching record contains its unique
     number of bird-watching records is more in the east than        spatial-temporal data information. In order to better show
     that in the west, and more in the south than that in the        the distribution and migration of birds each bird-watching
     north. The proportions of bird-watching records also vary       record is abstracted into coordinate points with times
     with years. The number of records from 2001 to 2016             before the mining and analysis steps. Each record
     accounts for more than half of the total. In addition,          corresponds to a coordinate point. This tracing point that
     among the whole bird-watching records, there are 142078         can stand for an individual or a group is used to display
     records of migratory bird which accounts for 59.36% of          the bird distribution and migration. The textual
     the total. The remaining records are for non-migratory          information of “bird-watching site” in each bird-watching
     bird.                                                           record needs to be converted into the latitude and
           Although China's bird-watching records are                longitude coordinates of GPS in order to facilitate
     distributed in the species, time and space, the advantages      compare calculation and presentation. API interface of
     of bird-watching data are obvious such as low cost, bulk        Baidu map with high accuracy is applied to the textual
     information, easy access, various species coverage,             information of “bird-watching site” in each bird-watching

                                                                2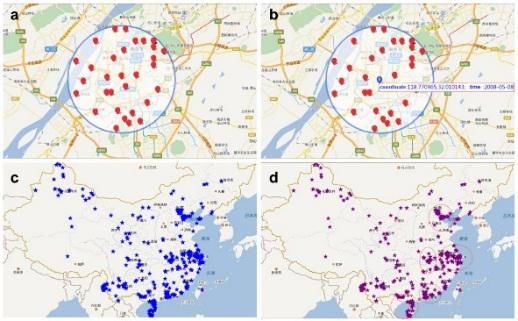
MATEC Web of Conferences 139, 00156 (2017)                                                 DOI: 10.1051/matecconf/201713900156
ICMITE 2017

    record. The coordinates of Baidu Map can be accurate            of the FP, k∈[1,K].
    after the 10 decimal point. By this Algorithm, the                   The steps of the selection of Feature Point are as
    Migratory birds’ corresponding coordinates are retrieved.       follows:
         Definition1. Trajectory point of moving object is to             Step1: Assign the values of θr and θt;
    describe the moving object sampling including three parts             Step2: A point pi (ej) is chose as a center arbitrarily
    of latitude, longitude and timestamp and moving object          in the set P(ej) = {p1(ej), p2(ej),…, pi(ej), …, pn(ej)};
    identification which is expressed as pi (ej) = , pi (ej) ∈ P (ej), ej ∈ E, j ∈ [1, J], i ∈ [1, n]           points except the central point of the set P(ej) to pi(ej);
    where (xi, yi) is the track point position component. For             Step4: If Distance (pother, pi)≤ θr && |tother – ti|<
    example, ej = Hirundo rustica. A trajectory point is            θt,then the point pi(ej) is added to the DPS P’(ej);
    expressed as pi(ej) =  where (xi, yi) are           Step5: Output P’(ej);
    coordinates and ti is a time stamp. pi(ej)∈P(ej), j∈[1,J],            Step6: The k-mediods algorithm (Han et al. 2012)
    i∈[1,n].                                                        is used in the DPSs P’(ej). The cluster of k-mediods
          Definition2. Migratory trajectory of migratory bird:      algorithm is set to 1. The central point of cluster sk (ej is
    a sequence of spatial locations with time stamps is called      used as the feature point of pi (ej), sk (ej) = ;
    be expressed as: P(ej) = {p1(ej), p2(ej),…, pi(ej),…,                 Step7: Calculate the weighted average of points in
    pn(ej)} where pi(ej) is a sampling point of the trajectory      P’(ej). The weight average of a point is the value of
    and n is the number of sampling points. Ej is the moving        “Number” that is used as a new weight of sk (ej);
    object (event), ej ∈ E, E = {e1, e2, ..., ej, ..., eJ} is the         Step8: Repeat Step2-Step7 for each point in P’(ej)
    set of moving objects (events), j ∈ [1, J] and J is the         until all FPs are output;
    moving object Event).                                                 Step9:      Rearrange the feature points and the
                                                                    tracking points that are not in the DPSs. Then a set of new
                                                                    trajectory points about ej is got, S(ej) = {s1(ej), s2(ej),…,
    3.3 Selection of Feature Point                                  sk(ej),…,sm(ej)}, m is the number of the new trajectory
                                                                    points;
    There is a considerable duplication in the original                Step10: Output S(ej).
    bird-watching data. If these duplicate data could not be
    removed, it would affect the quality of data mining.
    Therefore the original trajectory points of migratory bird
    should be pre-processed and removed duplicates before
    analysis of the data. The problem of uneven distribution
    of bird-watching records is solved initially, which lays the
    solid foundation for further analyzing of the data.
             There are two types of duplicate data in
    bird-watching data. The first type is explicit duplicate
    data manifesting the same time and place, namely
    pi(ej)=pi+1(ej). For such duplicates simple merge
    processing is needed. The second type is implicit
    duplicate data which is not easy to find. When a kind of        Fig. 2. Duplicate Points Sets (DPS)
    bird repeatedly sampled over a continuous interval and a
    small regional range, its sample can be considered
    repeated. They manifest multiple sampling points of a           3.4 The Discovery of Habitats
    bird species with similar temporal and spatial
                                                                    There are many stopover sites in the route of birds
    characteristics.
                                                                    migrant      which     consist    the    habitants     with
          Definition3. Duplicate Points Set (DPS): the set of
                                                                    wintering ground and breeding place [14][15]. Within the
    the tracking point of a certain type of moving object P’(ej)
                                                                    habitat, the number of bird populations is usually larger
    = {pu(ej), pu+1(ej),…,pi(ej), …, pv(ej)}, j ∈ [1,J], i ∈
                                                                    than that of the other regions [16][17].That is a place that
    [u,v]. If Dist(pu, pi)≤ 2θr,Dist(pu, pv+1)>2θr, and             has larger amount and higher density of birds is much
    tv – tu< θt, the set P’(ej) is called a Duplicate Points        more important to birds themselves which is more likely
    Set         (DPS)         marking         asP’(ej)={pu’(ej),    to become the potential habitats for birds. Following this
    pu+1’(ej), … ,pv’(ej)}. The sequence {P1’(ej),                  idea, the area where birds are densely distributed must be
    P2’(ej),…,Pk’(ej),…,PK’(ej)} is called the set of DPSs          found after the pre-processing of the new trajectory points.
    where K is the number of DPS and k ∈ [1,K]. The                 A density-based clustering algorithm is employed in the
    tracking points of the DPS are implicit duplicate data. Fig     new trajectory points S(ej) = {s1(ej), s2 (ej),…,
    2 shows the DPSs.                                               sk(ej),…,sm(ej)} to find the high density areas for bird
          Definition4. Feature Point (FP): In a DPS, a single       activity. And the value of “Number” is introduced to
    point P’(ej) that can be used to replace P’(ej) is called a     calculate the values of each cluster and outlier. Then
    Feature Point (FP). The FP can be expressed as: sk(ej) =        high-density and high-volume areas are screened out as
     where tu is the starting time of the     habitats for migratory bird. Fig 3 shows various types of
    DPS, tv is the ending time and (xk, yk) is the coordinate       clusters.

                                                                3
MATEC Web of Conferences 139, 00156 (2017)                                                   DOI: 10.1051/matecconf/201713900156
ICMITE 2017

           Definition5. Heat: The importance of a point or            Algorithm can be completed in a relatively short time.
     region is called the Heat Degree (HD). The “number of
     birds” is used as the weight of the point which is called
     the Heat Degree Point (HDP). If it has higher weight, the        4 Experiment
     heat range will be larger. The greater the sum of HDPs is
     in a region, the greater the HD of the region will be.
                                                                      4.1 Experimental environment
     The steps of the discovery of habitats are as follows:
        Step1 : The DBSCAN algorithm (Han et al. 2012) is             Bird-watching data is used for studying migratory bird in
     used in the new trajectory points sequence of ej, S(ej) =        China thus the algorithm of habitat discovery is proposed.
     {s1(ej), s2(ej),…,sm(ej)} to get         various shapes of       In the environment barn swallows (Hirundo rustica) is
     clusters,                      denoted                     as    used as examples to explore their habitats. The feasibility
     C(ej)={c1(ej),c2(ej),…,cl(ej),…,cL(ej)}, l ∈ [1,L], L is         and effectiveness of the algorithm is verified by
     the number of the clusters;                                      comparing with the results of authoritative ornithological
        Step2:The “number of birds” is used as the weight to          literatures A Field Guide to the Birds of China[18] and A
     calculate the HD of each cluster: the sum of                     Checklist on the Classification and Distribution of the
     multiplication of all points and the weights in a cluster        Birds of China[19].
     cl(ej). The HD of a cluster is called the HDC;                         The operating environment of this experiment is
        Step3:Calculate the HDP of each outlier point;                windows7 operating system and C # language is used to
           Step4 : Arrange all HDPs and HDCs in ascending             write the algorithm. The software development
     order. If HD>MinHeat (the value of MinHeat can be set            environment is Microsoft Visual Studio 2010 and SQL
     by the user) the point or cluster will be output that is used    server 2010.
     as      the     habitat     of     migratory     bird      ej:
     D(ej)={d1(ej),d2(ej),…,dl(ej),…,dL(ej)}, l∈[1,L];                4.2Experiment One: Selection of Feature Point
        Step5:Repeat Step1 to Step4 for E ={e1, e2,…, ej,…,
     eJ} until all habitats are output.                               The authors adopt the Feature Point (FP) to replace
                                                                      duplicate sampling points in the trajectory data of
                                                                      migratory bird.
                                                                           Fig 4 shows partial data of a Duplicate Points Set
                                                                      (DPS) of Hirundo rustica from May 2, 2008 to May 9,
                                                                      2008.

                                                       Fig. 3.
     Clusters of Arbitrary Shape

     3.5 Time complexity of Algorithm

     There are two stages in this Algorithm. The time
     complexity of each stage will be separately analysed.
            The k-mediods algorithm is used when selecting
     Feature Points (FP). The time complexity of the
     k-mediods algorithm is O (k (n-k) 2). In this paper setting
     k=1, n is the total number of trajectory points, S is the        Fig. 4. Partial data of a DPS (Hirundo rustica)
     total number of points in the Duplicate Points Set (DPS)              In the light of the bird-watching data and spherical
     and S < n. The time complexity of algorithm is O ((S/K)          distances based on latitude and longitude coordinates the
     2) when executing once and K is the number of Duplicate          following parameters are shown in Table1. After
     Points Sets (DPSs). This needs to be performed K times           experimental tests the clustering results are best when
     and K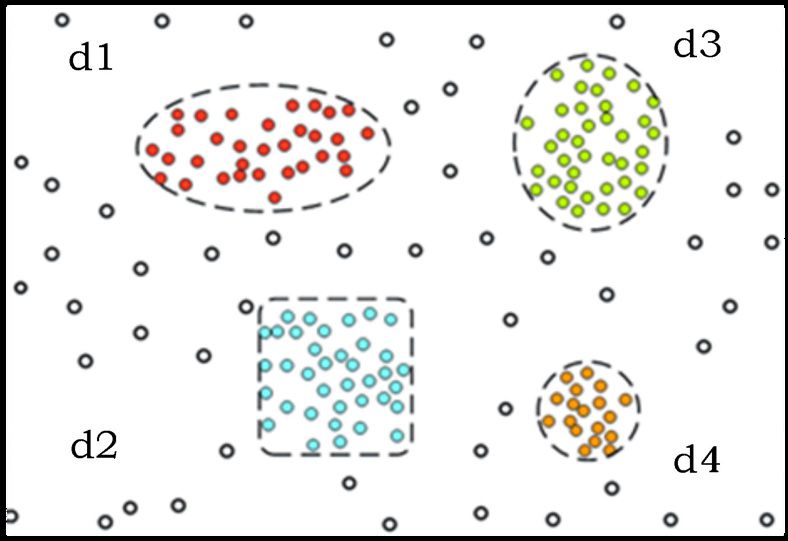
MATEC Web of Conferences 139, 00156 (2017)                                                DOI: 10.1051/matecconf/201713900156
ICMITE 2017

         3         ej         10             10                    Fig .6. The Discovery of Habitats (Hirundo rustica)
                                                                   a The Clusters of Trajectory Points after DBSCAN. b The
         4         ej         10             15                    Distribution Diagram of the Heat Degree c Habitats d
         5         ej         3              10                    Trajectory Points within the Habitat. e Part of the Habitat
         6         ej         3              15
                                                                   5 Discussion
          When ej= Hirundo rustica the trajectory points in
    Fig 4 (on May 2, 2008 to May 9, 2008, near Nanjing,
    Jiangsu Province) are marked on the map shown in Fig 5a.       5.1 Social and scientific value
    After clustering the canter of the cluster – FP is gotten
    (Fig 5b) which is used to replace all DPSs by this method.     This Algorithm is general, practical and convenient.
    After data pre-processing, the trajectory points become        Ideally it can be applied to all bird-watching data of
    fewer (shown in Fig 5d) than that of the original (shown       migratory bird in China. However the algorithm depends
    in Fig 5c).                                                    on a certain scale of bird-watching data. If the quantity of
                                                                   data is greater, the results of data mining may be more
                                                                   precise. If the data sample is too small, the accuracy of
                                                                   the algorithm will decline and the distribution and
                                                                   migration of migratory bird cannot be reflected truly.
                                                                   These results are confirmed by the experiments.
                                                                   Therefore it is important to collect bird-watching data
                                                                   constantly and adequately data pre-processing is
                                                                   necessary before data analysis and mining. On the one
                                                                   hand, the algorithm solves the repeated sampling of data
                                                                   sets and ensures the accuracy of data mining. On the other
                                                                   hand, massive and redundant data is compressed by this
                                                                   process. Thus the efficiency of data analysis is also
    Fig.5. Data pre-processing of the Trajectory Points (Hirundo
                                                                   improved.
    rustica).
    a Duplicate Points Set. b Selecting the Feature Point. c
    The Original Trajectory Points d New Trajectory Points         5.2 Limitations and shortcomings
    after Data Pre-processing
                                                                   1) Bird-watching data cannot track individual bird.
                                                                   Therefore it is not enough to just rely on bird-watching
    4.3 Experiment Two: The discovery of habitats
                                                                   data itself to verify the accuracy of the results. 2) There
    For the new trajectory points S(ej) after preprocessing the    are spatial and temporal discontinuities in bird-watching
    density-based clustering algorithm and Heat Degree (HD)        data. Hence it is difficult to solely rely on such data to
    formula is applied to get habitats for avian migration.        analysis changes of bird migration‘s habitats over the
         When ej= Hirundo rustica 25 clusters C(Hirundo            years. Moreover this may insert a negative impact on the
    rustica) can be gotten through DBSCAN clustering that is       predicted results of bird migration. 3) The uneven
    shown on the map Fig 6a. The HD of each point is then          distribution of sampling still exists which prevents deeper
    calculated and shown on the heat map Fig 6b. Finally 11        data analysis and mining activities.
    habitats are output. D (Hirundo rustica)= {d1, d2, d3, d4,
    d5, d6, d7, d8, d9, d10, d11}, their HD={369, 1287, 1885,      5.3 Future directions
    1221, 287, 155, 177, 159, 231, 189, 122} (Fig 6c).
                                                                   First bird-watching data will be collected continuously.
                                                                   Additional migratory bird data such as satellite-tracking
                                                                   data and bird-banding data will be gradually introduced to
                                                                   supplement further mining and analyses. Second
                                                                   meteorological data will be added to our study. The
                                                                   authors will further study the effects of climate and
                                                                   environment on bird migratory habitats.

                                                                   Conclusion
                                                                   Bird watching activity has been developing rapidly in
                                                                   China in recent years. This activity will help people to
                                                                   understand the distributions of birds and population
                                                                   dynamics etc. This paper analyses the problems of bird
                                                                   migration in-depth from the perspective of mining data.
                                                                   Based on Chinese bird-watching records, the algorithm of
                                                                   habitat discovery is proposed and used for the selection

                                                               5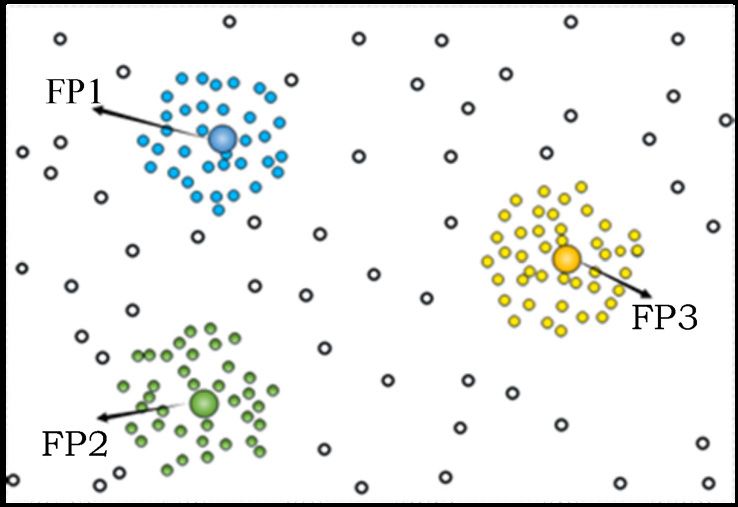
MATEC Web of Conferences 139, 00156 (2017)                                           DOI: 10.1051/matecconf/201713900156
ICMITE 2017

     and discovery of habitats during the migratory process of    8. Bird Report. http://www.birdreport.cn/.       2016.
     birds. Taking Hirundo rustica as example, maps and GIS          Accessed 23 Apr 2016.
     demonstrate the feasibility of the algorithm. The time       9. Bird     Watching      Network       of      China.
     complexity of the algorithm is small,resulting in its high      http://www.chinabirdnet.org/indexc.html.      2016.
     efficiency. The migration routes and habitats of the birds      Accessed 1 Apr 2016.
     derived by this work are compared with that of the
     authoritative ornithological literature which shows more     10.China Ornithological Society. China Bird Report
     accurate and real results and verifies the accuracy of the      2007 (in Chinese). Beijing: China Ornithological
     algorithm.                                                      Society, 2008
                                                                  11.China Coastal Waterbird Census Team. China
                                                                     Coastal Waterbird Census Report (in Chinese).
     References                                                      Hong Kong: Bird Watching Society, 2011

     1. Bock WJ. Presidential Address: Three Centuries of         12.Sai DJ, Sun YG. A Checklist and Distribution of the
        International Ornithology. Acta Zoologica Sinica.            birds in Shandong. Beijing: Science Press, 2013
        2004, 50(6): 880-912                                      13.Liu Y, Wei Q, Dong L. Updated New Bird Records
     2. Wang Y, Zhang ZW, Zheng GM, Li JQ, Xu JL, Ma                 in China Recently. Chinese Journal of Zoology.
        ZJ. Ornithological Research: Review of the Past              2013, 48:750-758
        Twenty Years and Future Perspectives in China.            14.Ma ZJ, Li B, Chen JK. Study on the Utilization of
        Biodiversity Science. 2012, 20: 119-137                      Stopover Sites and Migration Strategies of
     3. Ma ZJ. The Research Methods and Study Advances               Migratory bird. Acta Ecologica Sinica. 2005,
        of Bird Migration. Bulletin of Biology. 2009, 44:5-9         25:1404-1412.
     4. Bousquet O, Luxburg UV, Rätsch G. Advanced                15.Ma ZJ, Li B, Chen JK. Physiological Ecology of
        Lectures on Machine Learning. Springer-Verlag,               Migratory bird during the Stopover Periods. Acta
        2003.                                                        Ecologica Sinica. 2005, 25:3067-3075.
     5. Shimazaki H, Tamura M, Higuchi H. Migration               16.Yang Y, Wen JB, Hu DF. A Review on Avian
        Routes and Important Stopover Sites of Endangered            Habitat Research. Scientia Silvae Sinicae.
        Oriental White Storks (Ciconia boyciana) as                  2011,47:172-180.
        Revealed by Satellite Tracking. Revista Enfermería        17.Munster VJ, Baas C, Lexmond P, Wallensten A,
        Del Trabajo. 2004, 3:39-43                                   Fransson T, Rimmelzwaan GF, et al. Temporal, and
     6. Zhou YC, Tang MJ, Cui P. Research and                        Species Variation in Prevalence of Influenza A
        Implementation of Data Mining Algorithm for Bird             Viruses in Wild Migratory bird. Plos Pathogens.
        Migratory Behavior in Qinghai Lake. E-Science                2007, 3:630-638.
        Technology and Application. 2010, 1:38-50                 18.MacKinnon J R, Phillipps K and He F. The Field
     7. Li XY, Liang LY, Gong P, Liu Y, Liang FF.                    Guide to the Birds of China. Changsha: Hunan
        Revealing Bird Distribution Changes of Bird                  Education Press, 2010.
        Watching in China. Chinese Science Bulletin. 2012,        19.Zheng GM. The Checklist of the Classification and
        57: 2956-2963.                                               Distribution of the Birds of China (Second Edition).
                                                                     Beijing: Science Press, 2011.

                                                             6
You can also read