Introductory Guide - Australian Population Studies
←
→
Page content transcription
If your browser does not render page correctly, please read the page content below
AUSTRALIAN POPULATION STUDIES                                                2021 | Volume 5 | Issue 1 | pages 65-76

Introductory Guide
Understanding survey data available for
researchers working in ageing: the
CEPAR Metadata Database on Ageing
Jeromey B. Temple* The University of Melbourne
Tanara Vieira Sousa The University of Melbourne
Ruth Williams The University of Melbourne
Jay Stiles The University of Melbourne
Libby Brooke The University of Melbourne
Josh Knight The University of Melbourne
* Corresponding author. Email: Jeromey.Temple@unimelb.edu.au. Melbourne School of Population
and Global Health, The University of Melbourne, Melbourne, Vic 3010, Australia.
Paper received 8 February 2021; accepted 23 April 2021; published 31 May 2021

Abstract
Background
For researchers working in gerontology or the demography of ageing, knowledge of and access to
population-based data, which includes mature age respondents, is critical. The collection of
metadata (information describing data) supports researchers in their search for relevant data.

Aims
This proof-of-concept project seeks to develop a metadata database including metadata on
Australian sample surveys relevant to ageing over the period 2010 – 2018.
Data and methods
We used a five-stage approach to create the Centre for Excellence in Population Ageing Research
(CEPAR) metadata database on ageing: 1) identification of in-scope survey datasets; 2) indexing the
in-scope surveys; 3) scraping metadata from publicly available sources; 4) appending metadata to a
master database; and 5) creation of a webtool to enable users to search and export metadata and
obtain contact details for the relevant data custodian.
Results
The CEPAR Metadata Database webtool is available from: https://mspgh.unimelb.edu.au/centres-
institutes/centre-for-health-policy/research-group/metadata-database.
Conclusions
Metadata database collections can assist researchers to identify what data has been collected (for
their specific research interest in ageing), how it was collected and how to gain access to the data.
Key words
Metadata; ageing; survey data; Australian Bureau of Statistics; data archive

© Temple et al. 2021. Published under the Creative Commons Attribution-NonCommercial licence 3.0 Australia (CC BY-NC
3.0 AU). Journal website: www.australianpopulationstudies.org
66 Temple et al.                                                    Australian Population Studies 5 (1) 2021

1. Introduction
Evidence-driven gerontology and demography research relies on rigorous population-based empirical
data. However, the Australian Association of Gerontology (2017) states there is no single national
independent organisation that can collate, translate and identify gaps in evidence related to ageing
with the aim of informing Australian policy. The collection of metadata (information describing data)
can support important evidence-driven research. Mapping metadata is a preparatory step towards
understanding what information is being captured, how it is captured, as well as improving data
collection. Therefore, metadata can play a role in demonstrating the scope, foundations and gaps in
current evidence-driven gerontology research which can inform future directions.

More generally, a key task that all social scientists face when beginning a new project is
understanding the variety of data that exists in order to explore the underlying research question.
Although excellent data archives are available in Australia, including the Australian Data Archive
(ADA) and the Australian Bureau of Statistics (ABS) microdata collections, there is currently no single
point of metadata information specifically tailored to researchers working in ageing.

Our solution to this problem was to develop a metadata database as a proof-of-concept project. Our
metadata database includes metadata on Australian sample surveys relevant to ageing (e.g.,
including data dictionary elements, variable names, data types and formats, and survey and sampling
design) between the period 2010 – 2018. The scope further considers surveys collected by the ABS or
deposited with the ADA, where metadata is publicly available. The metadata database webtool we
developed enables users to search and export metadata and obtain contact details for the relevant
data custodian. In the remainder of this paper, we outline components of metadata, the
methodology employed to create the metadata database and provide a worked example of searching
and extracting data from the provided webtool. We conclude with a summary of future uses and
research priorities, as well as outlining the limitations to the approach employed.

2. What is metadata?
Metadata is data about data; it is information that describes other data. More precisely, it is the
formalised structured description of content, quality, condition, or other characteristics of data. A
principal purpose of metadata is to assist users in finding relevant information and discovering
resources through bringing similar information together and providing the location of information. In
addition, metadata provides access to information on the extent of completeness of the content; the
context of the content; and structural relationships within and between information (Gilliland 2016).
Metadata assists in identifying and organising electronic resources by relevant criteria, provides
digital identification, and supports the archiving and preservation of resources (United Nations
Statistical Commission and Economic Commission for Europe 1995).

Metadata can be stored internally, in the same file as the described data (also known as embedded
metadata), or externally, in a separate file from the described data. A metadata repository generally
stores the metadata separate from the data (NISO 2004). Many types of metadata exist including
descriptive, structural, administrative, reference and statistical metadata.
Australian Population Studies 5 (1) 2021                                                Temple et al.   67

Descriptive metadata describes a resource, typically to search and locate an object, such as title,
author, subjects, keywords, or publisher (Gilliland 2016). For example, the survey name.

Statistical metadata describes information about statistical data and the processes of collection.
Statistical data repositories have their own requirements for metadata to describe not only the
source and quality of the data but also what statistical processes were used to create the data. This is
of particular importance to both validate and improve the process of statistical data production
(Gilliland 2016).

Reference metadata describes aspects of the contents of statistical data and includes explanatory
information on the context of the data (Eurostat 2019). For example, a data item list, reporting on
the representativeness of the dataset.

Structural metadata describes information about the structure and interrelationships of data, such
as types, versions, tables, columns, keys and indexes (Gilliland 2016).

Administrative metadata describes information that assists to manage a resource, such as when and
how it was created, acquisition and location information, file type, and who has access rights. Two
subsets of administrative metadata include Rights Management Metadata, which concerns
intellectual property rights, and Preservation Metadata, which contains information needed to
archive and preserve a resource (Gilliland 2016).

The creation and archiving of metadata are important as it ensures that information and resources
will survive and continue to be accessible in the future. Archiving and preservation allow tracking the
lineage of an object, detailing physical characteristics and documenting behaviour which can be
mimicked in future technologies (Gilliland 2016).

In the CEPAR metadata database, we include components of descriptive, structural, and
administrative metadata. The database also includes links to details on statistical and reference
metadata. The metadata itself is external, i.e., detached from the underlying survey data.

3. Methods
We used a five-stage approach to collect and display the metadata (Figure 1). Ethics approval for this
project was granted by the Melbourne School of Population and Global Health Human Ethics
Advisory Group (HEAG) – Ethics ID: 1852885.2.

Stage one involved identifying relevant sample surveys to include. Stage two centred on indexing the
survey data. Stage three comprised scraping the metadata for each survey in the index file. Stage
four included appending all the metadata for construction into a database. Finally, in stage five, a
webtool was developed to enable users to search key terms in the metadata database.

For stage one, public repositories of Australian sample survey data were searched with the following
inclusion criteria: sample survey data, unit-record files, publicly available, collected in 2010 or later
and data related to participants aged 45 years and over. Surveys were excluded if they contained
qualitative or mixed-methods data or had no available details of the data custodian. The stage one
search was carried out from 17th of July 2018 until 1st of November 2018.
68 Temple et al. Australian Population Studies 5 (1) 2021
•Identification of relevant sources of surveys
•Inclusion criteria: sample survey data, unit-record files, publicly available, 2010 or
later and data related to participants aged 45 years and over.
Stage 1 •Exclusion criteria: administrative, qualitative or mixed-methods data or had no
details of the data custodian available.
•Index the available surveys
•All surveys were indexed with the following fields: file creation date, sample design,
survey type, unit of analysis, sample frame, details of fieldwork, geographic
Stage 2 sampling frame, and survey description.
•Scrape metadata from surveys
•All metadata include: variable name, label, categories and survey identifier.
Stage 3 •Statistical software programme R and manually.
•Append all metadata in a unique database
•All the scraped files were appended using Stata 15.1. This file was then used to
Stage 4 create the database.
•Development of the website/repository
•The metadata database was created and linked to a website interface with simple
search functions.
Stage 5
Figure 1: Process to develop the CEPAR Metadata Database
In stage two all files that fulfilled the inclusion criteria were indexed with the following fields: file
creation date, sample design, survey type, unit of analysis, sample frame, details of fieldwork,
geographic sampling frame and survey description.
During stage three, each survey was scraped for the following metadata: variable name, label,
categories, and survey identifier. Where possible, surveys were scraped using the statistical software
programme R. Surveys were manually scraped if they could not be scraped by R. Selected .xml files
were also made available from the ADA.
In stage four, all the scraped files were then appended using Stata 15.1. This file was then used to
create an exportable CSV file. Finally, in stage five, the CSV file was uploaded to
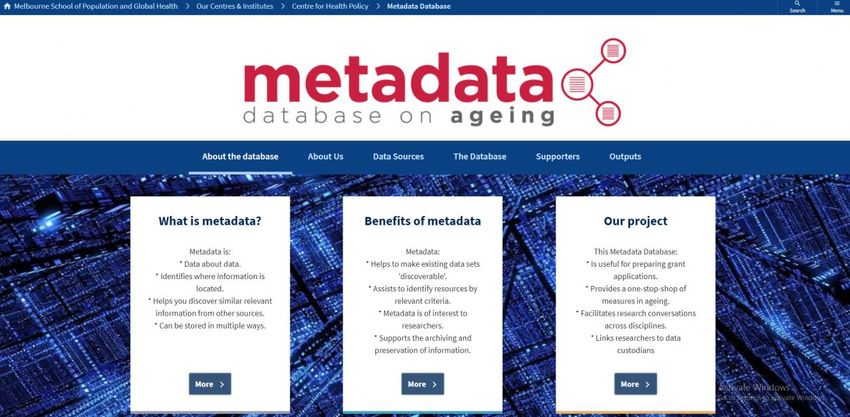
https://mspgh.unimelb.edu.au/centres-institutes/centre-for-health-policy/research-Australian Population Studies 5 (1) 2021 Temple et al. 69 group/metadata-database. This simple webtool developed by the University of Melbourne allows users to search and export the metadata. The principal repositories identified during stage one of this study were: • Australian Bureau of Statistics (ABS). The ABS holds a very detailed collection of microdata, spanning microdata datasets from the 1970s through to the present day. Microdata can be accessed as a basic CURF (Confidentialised Unit Record File) through ABS microdata download, or more detailed microdata can be obtained through the ABS Datalab. Selected microdata can also be analysed through the ABS TableBuilder product. However, for the metadata database, the scope includes only CURF and Datalab products (or former RADL – Remote Access Data Laboratory products). TableBuilder was excluded, because although the product is built from microdata, routine procedures used by researchers (e.g., regression models), are not possible with this product. The URL for ABS microdata collections, including details for access is: https://www.abs.gov.au/websitedbs/d3310114.nsf/home/microdata+entry+page. • Australian Data Archive (ADA). The ADA, situated at the Australian National University, holds over 6,000 datasets from 1838 onwards. Over ,1500 datasets are available within the ADA Dataverse for users to apply for access. The data collections cover a range of topics including health, social attitudes, and electoral and opinion surveys among others. The Household, Income and Labour Dynamics in Australia (HILDA) and Ten to Men surveys are also available through the ADA. The URL for ADA data collections, including details for access, is: https://ada.edu.au/. Included surveys from the ABS repository had a minimum of ‘expanded CURF’ or ‘microdata’ available and totalled 46 surveys and 14,011 variables. Thirty-five surveys were extracted from the ADA repository, totalling 10,457 variables. HILDA (71,014 variables available) and Ten to Men surveys were included in the ADA repository. HILDA metadata were sourced from the publicly accessible HILDA Data Dictionary (https://www.online.fbe.unimelb.edu.au/HILDAodd/Default.aspx). The Australian Longitudinal Study on Women's Health (ALSWH) included 13,174 variables from 8 waves. Details of the repositories, including the number of sample surveys (upper panel) and variables (lower panel) can be found in Table 1. From 86 indexed files, 49.4% were cross-sectional, 29.4% repeated cross-sectional and 11.8% longitudinal surveys. Thirty-five (39.3%) surveys have ‘individual’ level as the unit of analysis and almost all were ‘national’ level surveys. 4. Example of the Database In this section we detail a simple example from the metadata database. The landing page for the metadata database is found here: https://mspgh.unimelb.edu.au/centres-institutes/centre-for- health-policy/research-group/metadata-database. From the landing page (Figure 2), users can access information on: (1) all surveys included in the metadata database (Click on Data Sources); (2) the research team (Click on About Us); (3) outputs arising as part of this project (Click on Outputs); (4) details on funders of the project (Click on Supporters). By selecting ‘The Database’ button, users can choose to download a user guide (this paper) or launch the database.
70 Temple et al.                                                                Australian Population Studies 5 (1) 2021

Table 1: Summary of ageing metadata
                         Australian      Australian       Household,      Australian        Ten to Men1         Total
                         Bureau of      Data Archive      Income and Longitudinal
                         Statistics        (ADA)             Labour       Study on
                           (ABS)                          Dynamics in     Women's
                                                            Australia       Health
                                                            (HILDA)1      (ALSWH)
                                                    Number of surveys
# Surveys/files               46               35               1              1                  2              85
# Waves                        -                -              17              8                  2               -
                                                       Survey type
Census                         8                0               0              0                  0                8
                           (17.4%)           (0.0%)          (0.0%)         (0.0%)             (0.0%)           (9.4%)
Cross-sectional               11               31               0              0                  0               42
                           (23.9%)          (88.6%)          (0.0%)         (0.0%)             (0.0%)          (49.4%)
Longitudinal                   2                4               1              1                  2               10
                                                     2
                            (4.4%)         (11.5%)          (100.0%)       (100.0%)           (100.0%)         (11.8%)
Repeated Cross-               25                0               0              0                  0               25
sectional                  (54.4%)           (0.0%)          (0.0%)         (0.0%)             (0.0%)          (29.4%)
                                                  Survey unit of analysis
Business                       6                0               0              0                  0                6
                           (13.0%)           (0.0%)          (0.0%)         (0.0%)             (0.0%)           (7.1%)
Individual                     1               33               0              1                  0               35
                            (2.2%)          (94.3%)          (0.0%)        (100.0%)            (0.0%)          (41.2%)
Individual and                 4                2               1              0                  0                7
other levels                (8.7%)           (5.7%)         (100.0%)        (0.0%)             (0.0%)           (8.2%)
Household                      1                0               0              0                  2                3
                            (2.2%)           (0.0%)          (0.0%)         (0.0%)            (100.0%)          (3.5%)
Private dwellings             34                0               0              0                  0               34
                           (73.9%)           (0.0%)          (0.0%)         (0.0%)             (0.0%)          (40.0%)
                                                   Number of variables
# Variables                14,011           10,457         71,014             13,174            1,645         110,301
                                                      Survey type
Census                       1,837              0              0                0                 0              1,837
                           (13.1%)           (0.0%)         (0.0%)           (0.0%)            (0.0%)           (1.7%)
Cross-sectional              3,666            7,923            0                0                 0             11,591
                           (26.2%)          (75.8%)         (0.0%)           (0.0%)            (0.0%)          (10.5%)
Longitudinal                  128             2,532         71,014           13,174             1,645           88,493
                            (0.9%)         (24.2%)2       (100.0%)          (100.0%)          (100.0%)         (80.2%)
Repeated Cross-              8,380              0              0                0                 0              8,380
sectional                  (59.8%)           (0.0%)         (0.0%)           (0.0%)            (0.0%)           (7.6%)
                                                 Survey unit of analysis
Business                      484               0              0                0                 0               484
                            (3.5%)           (0.0%)         (0.0%)           (0.0%)            (0.0%)           (0.4%)
Individual                    105             7,704            0             13,174               0             20,983
                            (0.8%)          (73.7%)         (0.0%)          (100.0%)           (0.0%)          (19.0%)
Individual and               2,584            2,756         71,014              0                 0             76,351
other levels               (18.4%)          (26.3%)       (100.0%)           (0.0%)            (0.0%)          (69.2%)
Household                     780               0              0                0               1,645            2,425
                            (5.6%)           (0.0%)         (0.0%)           (0.0%)           (100.0%)          (2.2%)
Private dwellings           10,058              0              0                0                 0             10,058
                           (71.8%)           (0.0%)         (0.0%)           (0.0%)            (0.0%)           (9.1%)
Notes: (1) ‘Household, Income and Labour Dynamics in Australia Survey – HILDA’ and ‘Ten to Men survey’ were available in
ADA’s repository. (2) The 3 waves of the “Building a New Life in Australia (BNLA): The Longitudinal Study of Humanitarian
Migrants” are available in 4 files at ADA.
Australian Population Studies 5 (1) 2021 Temple et al. 71 Figure 2: Metadata database on ageing landing page When the ‘Launch the Database’ option is selected, the following screen of the webtool is loaded as a new tab (Figure 3). The key variables included in the database are as follows: Variable: The original variable name provided in the source documentation. Label: The description of the variable provided in the source documentation. Categories: The items available in categorical variables. DS_label: Name of the dataset. DS_format: Dataset format. DS_link: URL to find further information about the dataset, including contact details for the data custodian. DS_design: The type of survey sampling design, e.g., stratified, random sample. DS_type: Whether the survey is cross-sectional, repeated cross-sectional, or longitudinal. DS_unit: Unit of analyses of the survey instrument, e.g., individual, households. DS_samp: Details of the survey sampling design. DS_desc_fw: Simple fieldwork details where available. DS_source: Where the survey is sourced from, e.g., ABS, ADA.
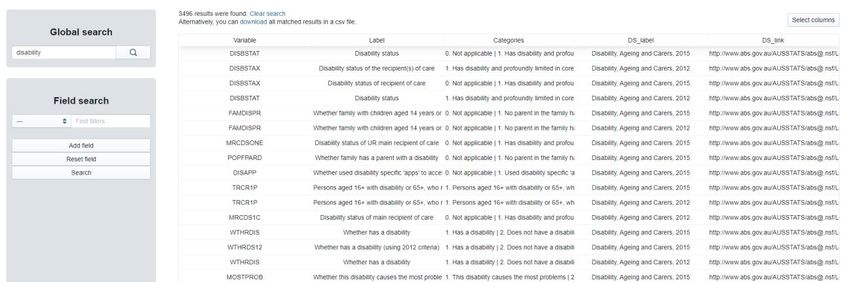
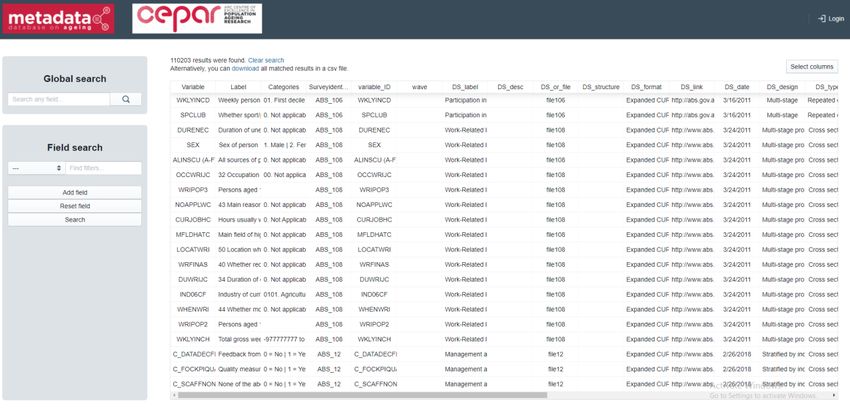
72 Temple et al.                                                      Australian Population Studies 5 (1) 2021

Figure 3: Metadata database webtool

A number of placeholder variables (e.g., DS_name, _merge) are included for administrative purposes
or for potential updates in the future. To simplify the display, click ‘Select Columns’. Ensure Variable,
Label, Categories, DS_label and DS_link are selected (highlighted in blue). The remaining variables
should be deselected or highlighted in grey (Figure 4). Click ‘Apply’.

Figure 4: Selection of variables in the Metadata database webtool.

For the purposes of this example, let us imagine a researcher is interested in investigating measures
related to disability. The user can either select ‘Global Search’ or ‘Field Search’. A global search will
search for the term across all variables in the database. A field search enables the user to specify the
search term for single or multiple variables in the database. To conduct a global search, simply enter
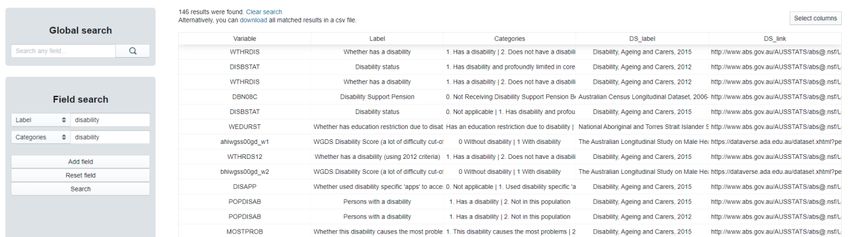
Australian Population Studies 5 (1) 2021                                                       Temple et al.   73

‘disability’ in the text box and click the magnifying glass icon. This produces 3,496 records containing
disability (Figure 5). As an example, the first record is from the Disability, Ageing and Carers survey,
with variable name DISBSTAT, variable label ‘Disability status’ with the link to dataset information
provided in the DS_link column. As this variable is a categorical variable, the column ‘Categories’
shows each category of disability considered. If the user wishes to download the results of the
search, simply click ‘Download all matched results in a CSV file’.

Figure 5: Example global search for the term ‘disability’

To clear the search, click ‘Clear Search’, delete the ‘disability’ text in the Global Search text box and
click the magnifying glass icon. This will reload the full database. The user may only be interested in
measures which include disability in the ‘Label’ and ‘Categories’ column. To complete this search,
type ‘disability’ in the Field Search text box. Select ‘Label’ from the adjacent combo-box. Next, click
‘Add Field’. Again, enter ‘disability’ in the new Field Search text box. Select ‘Categories’ from the
adjacent combo-box. Clicking ‘search’ narrows the number of records from 3,496 to 146 (Figure 6).

Figure 6: Example field search for the term ‘disability’ in ‘Label’ and ‘Categories’ columns

Clicking ‘Reset Field’ followed by ‘Search’ will once again reload the full database. With the full
database reloaded, the user can click ‘Download all matched results in a CSV file’ to download the
full database. The ‘Select Columns’ option may need to be reset if the user wishes to download all
variables in the database, by clicking ‘Select All’ followed by the ‘Apply’ button. To exit the metadata
database, simply close the tab.
74 Temple et al.                                                      Australian Population Studies 5 (1) 2021

5. Conclusions
In this paper, we have reported on our proof-of-concept project to develop a metadata database for
researchers working in the field of ageing. Our tool, alongside other metadata collections as they
become more comprehensive, will assist with:

• making unknown datasets ‘discoverable’ by researchers;
• linking researchers to data custodians to facilitate data access;
• increasing researcher productivity by providing a one-stop-shop to understand measures
  collected of interest to researchers in ageing;
• assisting with the preparation of grants by pointing to all existing data on a specific topic in a very
  efficient manner;
• assisting with understanding the potential for data linkage (when legal and/or feasible); and
• facilitating new research conversations across disciplines.

In short, metadata transparency can help empower researchers to identify what data exists around a
given topic (e.g., a specific research interest in ageing), how the data was collected, and how to gain
access to the data. Understanding the structure, limitations, definition, and description of data also
serves to protect against misinterpretation or misuse, thereby ensuring the integrity of the research
output. Metadata itself may also be of interest to academics, as a means to understand the historical
evolution of these measures and point to gaps in our knowledge. Understanding data collections
requires analysis of taxonomies of variables and their inter-relationships, theoretical frameworks,
and research methodologies employed in ageing research. Thus, collecting metadata can help inform
an epistemological map of the ‘state of play’ in Australian gerontology. In doing so, the extraction
and analysis of metadata can play a critical role in the evolution of measures relevant to ageing
research. With an increasing ageing population and reliance on data, metadata on ageing has
growing relevance now and into the future.

5.1.   Limitations
Our project considered a very specific scope of data for inclusion: sample survey data available at
two major data repositories between the period 2010 to 2018. Many other datasets are likely to be
of interest to researchers in the field of gerontology and the demography of ageing. For example,
large administrative datasets, surveys held by research institutions or researchers, qualitative or
mixed-methods data, spatial databases as well as vital statistics. These important data sources are
omitted from our project. Moreover, our search was carried out from 17th July 2018 until 1st
November 2018. Other datasets housed at both the ABS and ADA are likely to be in-scope but
published online after November 2018 and therefore not included in the metadata database for this
study.

A second major limitation of this project relates to data quality. Collating even this range of metadata
was a considerable task, with data dictionaries available in different formats (Excel, word processing
documents and PDF files). Although our procedures automated through R and Stata helped to
streamline the process, many errors had to be manually corrected. Given the size of the database,
errors are likely to remain and users of the metadata database should note this limitation. A further
limitation is that the webtool is a relatively simple search tool. Nonetheless, users are given the
option to download the full database as a *.csv file to use with other software.
Australian Population Studies 5 (1) 2021                                              Temple et al.    75

Finally, a limited number of variables have been added to the database. Curating the metadata to
include conceptual, theoretical or analytical methodologies would greatly improve the coverage of
the database. For example, tagging variables from each survey which are of use to researchers
working on particular ageing theories, or tagging variables with key areas of thematic interest from
domestic and international conferences.

5.2.   Summary and future research
In this paper we have described a proof-of-concept project which seeks to develop a metadata
database including metadata on Australian sample surveys relevant to ageing. We have outlined our
five-stage approach to create the CEPAR metadata database on ageing and provided a webtool for
users to interrogate the data, or to export the data for further use. Nonetheless, improvements can
be made with regard to coverage of data sources (to include for example administrative data),
temporal coverage (increasing the time period and spatial heterogeneity of data collections), and
procedures to improve the underlying data quality of the database – when for example, only PDF or
word processor documents are the only public source of microdata data dictionaries.

Beyond these improvements, research using the metadata database itself has strong academic merit.
Using metadata, such queries may include:
•   The availability of measures of interest to gerontologists in Australian datasets.
•   The complementarity of evolving theories and conceptual frameworks with data availability.
•   The historical evolution of measurement.
•   The strengths of current data collections.
•   Identification of weaknesses and how they can be improved in future data collections.

Improving our knowledge through metadata can limit misinformation and misuse of data, avoid
duplication of research effort while simultaneously enhancing reliability and integrity of research
outputs. Such important and wide-reaching outputs include the creation of informed social policy to
improve the lives of older Australians, both current and future.

Key messages
• This introductory guide explains the concept of metadata and its utility to researchers specifically
  in the field of ageing.

• The methodology for creating the metadata database is described and explained.

• An example of searching and extracting data using the CEPAR metadata database webtool is
  described.

• Researchers are provided with full access to the underlying database and a webtool to interrogate
  the database.

Acknowledgements
Funding for this project was provided by the ARC Centre for Excellence in Population Ageing
Research (CEPAR) and the Melbourne School of Population and Global Health, University of
Melbourne. The authors acknowledge the assistance of Sebastian Kocar, data archivist from the
76 Temple et al.                                                    Australian Population Studies 5 (1) 2021

Australian Data Archive. We also acknowledge the development work of Prof. Richard Sinnott, Glenn
Jayaputera, Zelong Cong, and Alwyn Pan on the webtool.

References
Australian Association of Gerontology (2017) Submission to Aged Care Workforce Strategy Taskforce.
        https://www.aag.asn.au/news-publications/aag-submissions/2017-1-aag-submission-to-aged-
        care-workforce-strategy-taskforce.
Eurostat (2019) Glossary: Metadata. https://ec.europa.eu/eurostat/statistics-
        explained/index.php/Glossary:Metadata#:~:text=Reference%20metadata%20(sometimes%20c
        alled%20explanatory,a%20semantic%20point%20of%20view. Accessed on 4 February 2021.
Gilliland A J (2016) Setting the stage. In: Baca M (ed.) Introduction to Metadata. Third edition. Los
         Angeles: Getty Publications. https://www.getty.edu/publications/intrometadata/setting-the-
         stage/. Accessed on 15 November 2018.
NISO [National Information Standards Organisation] (2004) Understanding metadata.
       https://www.niso.org/publications/understanding-metadata. Accessed on 14 November 2018.
United Nations Statistical Commission and Economic Commission for Europe (2000) Guidelines for the
        Modelling of Statistical Data and Metadata. Geneva: United Nations.
        https://unece.org/fileadmin/DAM/stats/publications/metadatamodeling.pdf.
You can also read