9103 Picoammeter User Guide - RBD Instruments, Inc. 2437 Twin Knolls Dr., Suite 2 Bend, OR 97701 Phone: Fax: ...
←
→
Page content transcription
If your browser does not render page correctly, please read the page content below
9103 Picoammeter User Guide

           RBD Instruments, Inc.
        2437 Twin Knolls Dr., Suite 2
              Bend, OR 97701
           Phone: 541.330.0723
            Fax: 541.330.0991
         www.rbdinstruments.com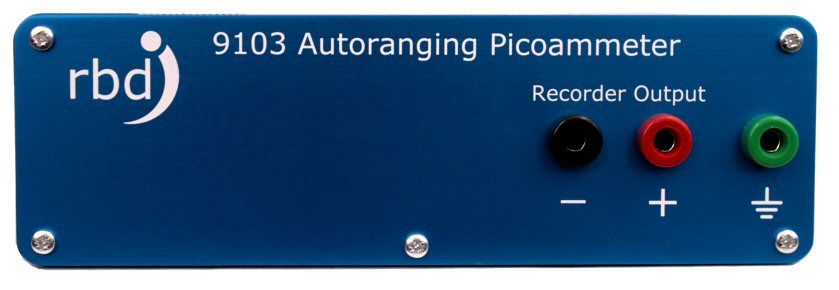
About This Guide                                                                                         3
  Additional Resources                                                                                   3
Getting Started                                                                                          4
  Installing From the Picoammeter CD (Windows)                                                           4
  Driver Only Installation (Windows and Other Operating Systems)                                         4
9103 Picoammeter Features                                                                                5
9103 Picoammeter Hardware Interface                                                                      6
  Front Panel                                                                                            6
  Back Panel                                                                                             6
9103 Picoammeter Software Interface                                                                      7
Connecting the 9103 Picoammeter                                                                          7
Using the 9103 Picoammeter                                                                               8
  Selecting the Range                                                                                    8
  Reading (Sampling) Current                                                                             8
  Selecting the Input Current Filter                                                                    10
  Grounding the Input                                                                                   10
  Setting the Current Offset                                                                            11
  Using the Chart Recorder                                                                              11
  Using the 90V Bias (optional)                                                                         12
  Resetting the 9103 Picoammeter to Factory Defaults                                                    13
  Calibration                                                                                           13
Additional Actuel Features                                                                              14
    Recording and Exporting Data                                                                        14
    Graphing Data                                                                                       16
Specifications                                                                                          18
  General                                                                                               18
  Resolution and Accuracy per Range                                                                     18
Theory of Operation                                                                                     19
Communications & Command Reference                                                                      21
  Introduction                                                                                          21
  Setting up Communications                                                                             21
  Communicating with the 9103 Picoammeter                                                               22

2                                                              © Copyright 2010 RBD Instruments, Inc.
About This Guide
The 9103 Picoammeter utilizes firmware and memory built into the device for current measurement
and control. Application software communicates with the unit using simple ASCII text over a USB
connection. This means much of the Picoammeter functionality is built into the unit, and is
independent of the application controlling it.

The features listed in the guide are described with instructions for operating the unit via RBD’s Actuel
application (for Microsoft Windows), as well as via the ASCII command interface, which may be
accessed by a serial port terminal application and third‐party control applications, as well as the Actuel
application itself. There are some features that are only directly supported by the Actuel application;
these are described in the section “Additional Actuel Features”

Some of the less‐used commands are only covered in the “Communications and Command Reference”
section at the end of this manual.

The “Getting Started” section immediately following describes the installation procedure for the
Picoammeter drivers and application software.

Additional Resources
More information on the 9103 Picoammeter, as well as software updates, is available at
http://rbdinstruments.com/Products/Picoammeter.html

Tutorial videos for the 9103 Picoammeter and other RBD Instruments’ products can be found at
http://www.youtube.com/user/RBDInstruments/videos

3                                                                   © Copyright 2010 RBD Instruments, Inc.
Getting Started
The 9103 Picoammeter provides all the features of an autoranging picoammeter with the advantage of
a USB interface for computer display, control, data logging/graphing, and an optional 90V bias.

To use the 9103, you’ll need to install appropriate drivers for your operating system. RBD provides a
full‐featured application (called Actuel) for operating the Picoammeter on Microsoft Windows.

The 9103 communicates to the computer via ASCII text over a VCP (Virtual COM Port), so for custom
applications, you can control the device on any supported operating system using any terminal or
control software that is compatible with a VCP driver (for example, National Instruments’ LabVIEW).
For more advanced applications, other programmable drivers are available.

Installing From the Picoammeter CD (Windows)

Insert the CD in the drive. Installation instructions for online and offline installation are provided on the
CD and will run automatically.

Note: If you have the “AutoRun” or “AutoPlay” feature disabled in Windows, browse to the CD and double‐click
the file “ index.html”

Note: The Windows installation of the 9103 drivers and software is compatible with virtualized instances of
Windows running on the Apple Mac OSx operating system, as well as Boot Camp.

Driver Only Installation (Windows and Other Operating Systems)

Drivers for various operating systems (Mac OSx, Linux, etc.) are available for the 9103 Picoammeter for
use in custom applications. Both Virtual COM port (VCP) and DLL / Direct (D2XXX) drivers are available,
depending on your application needs.

Compatible drivers are those listed that for the device FT232R.

VCP drivers (recommended for most applications):
http://www.ftdichip.com/Drivers/VCP.htm

Direct drivers (recommended for more advanced applications):
http://www.ftdichip.com/Drivers/D2XXX.htm

The procedure for device driver installation for various operating systems depends on the operating
system and configuration. Please consult the operating system manufacturer and FTDI for additional
information.

4                                                                       © Copyright 2010 RBD Instruments, Inc.

9103 Picoammeter Features
The following list the features of the 9103 Picoammeter that are built into the device and may be
accessed by any application communicating with the device. For example, data logging and graphing is
not provided by the device but is provided by the Actuel application, however setting an offset null
value (“zeroing the meter”) is provided by the device and can be accessed via any application.

Current Measurement
Measure current ranging from 2nA to 2mA

Auto or Manual Range
Select automatic ranging or measurement ranges from 2nA to 2mA

Interval and Single Sampling
Measure samples of current at timed intervals ranging from 25 ms to 9999 ms, or measure a single
sample of current

Auto or Manual Range
Select automatic ranging or measurement ranges from 2nA to 2mA

Offset Null
Null (zero) the offset at a particular range

Input Grounding
Enable the input to be shorted to ground when not sampling (and automatically opened when
sampling)

Output via External Chart Recorder
Convert the sample current measurement to a voltage and output to a chart recorder or similar device

Sample Filter
Select the speed and accuracy of the built in sample filter

Query Status
Query status, calibration, and diagnostic information from the device

90V Bias (Optional)
Apply a 90V bias to the input

5                                                                 © Copyright 2010 RBD Instruments, Inc.
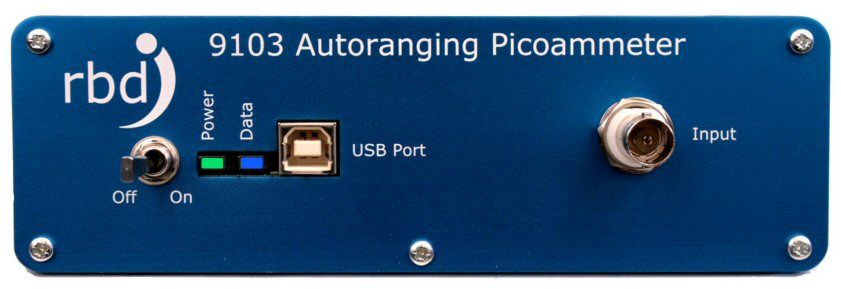
9103 Picoammeter Hardware Interface
Front Panel

Off / On Switch:    Turns the unit off and on (when connected to a USB port)

Power LED:          Stays lit (green) when there is power to the unit

Data LED:           Briefly lights (blue) when data is being transmitted by or received by the unit

USB Port:           Connector for USB serial bus cable (USB connector type B)

Input Connector:    Standard BNC for current measurement input

Back Panel

Chart Recorder Output:     Banana jacks (black negative, red positive)

Ground:                    Green banana jack grounding the unit
                           * For best results, it is strongly suggested that you use the ground cable
                           (included) to connect the unit to PC ground, or vacuum chamber
                           (where applicable)

6                                                                © Copyright 2010 RBD Instruments, Inc.
9103 Picoammeter Software Interface The 9103 Picoammeter device uses a USB interface and is controlled using an ASCII command protocol. Any application that can communicate with a virtual COM (communications) port can control the device and read current. The command interface is the same regardless of the method used to communicate with the device. Using the Actuel Application The Actuel application provides a user‐interface for controlling the Picoammeter, as well as additional features. It is currently available for Windows compatible PCs only (note that this includes Intel‐based Apple Mac systems using Boot Camp or virtualization software such as VMWare Fusion). The Actuel application also provides a “terminal” style window (the Console) that allows you to directly input commands to the device using the ASCII interface. Use caution when using the Console to control the 9103 Picoammeter ‐ most of the commands run independently of the application interface and can cause the Actuel application to run out of sync with the device. For example, you if the Actuel interface has initiated interval sampling, and you use the Console window to set the interval to zero, this may not be reflected in the Actuel interface. Should this happen, simply re‐launch the Actuel software. Using Third‐Party software Many third party software applications can be programmed to communicate with a virtual COM port, and most programming environments provide library support for programming COM ports. While the specifics for programming a COM port are out of the scope of this manual, a guide to the communication settings and command reference is included at the end of this manual. Connecting the 9103 Picoammeter USB Interface / Power Connect the 9103 Picoammeter to the PC before turning the unit on. The unit receives power from the USB connection. The green LED labeled “Power” should be lit when the unit is on. Current Input Input to the 9103 Picoammeter is connected through the BNC connector on the front of the unit. Ground (IMPORTANT) The 9103 Picoammeter comes supplied with a connector for grounding the unit. For best results, it is strongly suggested that you use the ground cable (included) to connect the unit to PC ground, or vacuum chamber (where applicable). 7 © Copyright 2010 RBD Instruments, Inc.
Using the 9103 Picoammeter

Selecting the Range
The 9103 Picoammeter can be operated in auto or manual range mode. When Auto Range is selected,
the device dynamically sets the range based on the last few current samples. When first reading
current (or after the input current moves outside of the previous range), it may take a few readings
before the values read are stable and accurate (see Interpreting Sample Results under the section
Reading (Sampling) Current below.

Using Actuel
To select the range, click the Range combo box and select either Auto or one of the manual ranges..

Using the Command Interface
To select the range, use the range commands “&R0” – “&R7”
0‐7 corresponds to the selected range.
“&R0” corresponds to Auto range.
“&R1” – “&R7” correspond to manual ranges.
See the Communications and Command Reference at the end of this manual for more details.

Reading (Sampling) Current
Of course the main function of the 9103 Picoammeter is reading current, and this can be accomplished
in a variety of ways.

Current Reading Modes
The device itself supports both an interval and a single sample mode of operation. Interval sampling
allows you to take and record current samples at a specified interval. Single‐sample mode allows you
to take a single sample data. Using third‐party software, you can automate the acquisition of single
samples in order to acquire data at longer intervals than supported by the device (over 10 seconds), as
well as mixed intervals (for example, 5 samples per second for 2 seconds each minute).

Reading Current at a Specific Rate
The 9103 Picoammeter supports sampling at intervals of between 15 mS and 9,999 mS (approx. 10
seconds).
Note that if you set the option to ground the input, the input will be opened automatically prior to
sampling and re‐grounded afterwards. Likewise, if you turned on the bias option, the 90 V bias will be
applied when the input is opened after sampling begins.

Using Actuel
To setup interval sampling using Actuel, first select a sampling rate from the Sampling Rate field. Click
the Start Sampling button or hit the ‘s’ key to begin sampling. Click the button again (it will not read
Stop Sampling) to stop.
8                                                                   © Copyright 2010 RBD Instruments, Inc.
Using the Command Interface
To setup interval sampling using the command interface, send the Picoammeter the “&I” command
with the next 4 digits specifying the sampling rate in milliseconds. For example “&I0100” begins
sampling at an interval of 100 mS.
To stop sampling, send the “&I” command with a value of 0 (“&I0000”)

Reading a Single Current Sample
The 9103 Picoammeter supports the reading of a single sample of current. Acquiring a single sample
during interval sampling stops interval sampling.

Note that if you set the option to short the input when current is not being read, the input will be
opened automatically for 5 seconds, during which you may wish to acquire subsequent samples (since
the first few may not be stable due to the shorted input). If the bias option is turned on it will be
applied at this time.

Using Actuel
To acquire one current sample, simply click the Sample Once button.

Using the Command Interface
To acquire a single sample send the command “&S”.

Interpreting Current Sample Results
The 9103 Picoammeter is capable of reporting current value, units, and polarity, along with stability
and over/under range status.

While the device is capable of reporting current using up to 8 digits in standard notation with units,
please note that the accuracy of the lowest‐order digits is dependant on the selected range (see
Specifications)

Stability is reported by the device for each current sample taken. When the unit first begins sampling,
or a new range is selected (either manually by the user, or automatically by the device when auto‐
ranging is selected and the input current moves outside the current range), the device may take a few
seconds to stabilize. Stability time is also affected by the filter setting (see “Selecting the Filter Type”
below). If the current is unstable, a warning appears over a dimmed display.

Current values that are greater than selected range (or the range of the device when auto‐ranging is
selected) are reported as being over‐range; values that are less then the selected range are reported as
under‐range.

Using Actuel
Current is displayed in a fixed 5 digit (plus decimal) format. Stability and Over/Under range warnings
are displayed in the Current display section of the application.

9                                                                     © Copyright 2010 RBD Instruments, Inc.
Using the Command Interface
Sample current data (including stability, range, polarity, value, and units) is reported by the unit using
the “&S” command. As an example, the result “&S=,Range=002nA,‐0.0692,nA” represents a stable
reading in the 2 nA range, with a value of negative 0.0692 nA. Unstable values are reported with an
asterisk character (for example, “&S*,Range=002uA,‐0.0724,uA”), and range is reported with a “>”
(over) or “
before an accurate reading can be made. If this is a problem (especially when automating the device
using a third‐party programming environment), it is suggested you either disable input grounding then
delay a few seconds before the sample is acquired, or take multiple samples over a 5 second period to
ensure a stable, accurate value.

Using Actuel
To enable grounding the input, select the Input option “Grounded”. To open the input for normal
operation, select the “Normal” option.

Using the Command Interface
Use the command “&G1” to enable input grounding; the command “&G0” disables the feature.

Setting the Current Offset
The 9103 Picoammeter can be instructed to apply a null offset correction, automatically subtracting
the current sampled at the time the option is selected from any subsequent current readings
(effectively “zeroing” the meter) This offset cannot be used during auto‐ranging.
Changing the range or cycling power to the device automatically discards the offset.

Using Actuel
Select the Offset Null radio option to turn the offset null feature on or off (not available when the auto‐
ranging is selected). Selecting a new range when the offset is on will automatically turn it off.

Using the Command Interface
To turn the offset null feature on, send the “&N” command. To turn the offset null off, simply send a
range command (“&R0” – “&R7”). Note that you can select the same range as you are currently using
to turn of the offset adjustment – for example, if you previously selected “&R3”, sending “&R3” after
“&N” will turn the feature off.

Using the Chart Recorder
The 9103 Picoammeter provides a chart recorder output that produces a 0‐10V voltage in response to
the sample current, allowing you to interface a chart recorder for logging sample data over time. You
can set the logging interval, as well as calibrate the chart recorder output to match your device. The
chart recorder updates every 200 ms by default, however this is user‐selectable.

Setting the Chart Recorder Options

Using Actuel
Actuel does not currently provide a dedicated interface for setting up the chart recorder, however the
command interface may be utilized by opening the Console window. See “Using the Command
Interface” immediately below for more information.

11                                                                  © Copyright 2010 RBD Instruments, Inc.
Using the Command Interface
To set the chart recorder (logging) interval, use the “&L” command with a value between 0050 and
9999 milliseconds. For example, “&L0100” sets the interval to 100 milliseconds.

To calibrate the chart recorder, use the “&C” command as follows:
“&C5”: Reset chart constants to default (adjust while input disconnected)
“&C6”: Adjust chart zero to be more positive (adjust while input disconnected)
“&C7”: Adjust chart zero to be more negative (adjust while input disconnected)
“&C8”: Increase chart gain (adjust while input 1 nA, chart output should be 1.00 Vdc)
“&C9”: Decrease chart gain (adjust while input 1 nA, chart output should be 1.00 Vdc)

For more information, see the Communications and Command Reference at the end of this manual.

Calibrating the Chart Recorder Output
Using Actuel
Actuel does not currently provide a dedicated interface for setting up the chart recorder, however the
command interface may be utilized by opening the Console window. See “Using the Command
Interface” immediately below for more information.

Using the Command Interface
If the chart recorder output is not in spec, adjust as follows:
1) Send &R1 to select 1 nA manual range, disconnect the input current, wait for readings to stabilize
2) Send &N command to NULL any minor errors, send &C5 command to reset the chart contents
3) While observing the voltmeter, send &C6 to increase the reading toward zero, or &C7 to decrease the reading
toward zero
4) Reconnect the input current, set to +1 nA, wait for readings to stabilize
5) While observing the voltmeter, send &C8 to increase the reading toward 1.00 Vdc, or &C9 to decrease the
reading toward 1.00 Vdc

Using the 90 V Bias (optional)
The 9103 Picoammeter has an optional 90 V bias that can be applied to the input. Note that the bias is
automatically turned off when the input is grounded – this is a function of the 9103 Picoammeter and
occurs automatically regardless of the method used to control the device.

Since the bias and input ground are mutually exclusive, you can select the 90 V bias and grounded
input at the same time – whenever current is sampled, the bias will be turned on and the input
opened. After sampling, the bias will be turned off and the input grounded.

Using Actuel
Select the Bias On radio button to turn the 90 V bias on, and the Bias Off radio button to turn the 90V
bias off.

Using the Command Interface
Use the command “&B1” to turn the 90 V bias on, “&B0” to turn the 90V bias off.
12                                                                    © Copyright 2010 RBD Instruments, Inc.
Resetting the 9103 Picoammeter to Factory Defaults

You can reset the 9103 Picoammeter to factory defaults – this does not erase or change the calibration
settings.

Using Actuel
Actuel does not currently provide a dedicated interface for resetting the factory defaults, however you
can do so by opening the Console window and sending the “D” command.

Using the Command Interface
Use the command “&D” to reset the device to factory defaults.

Calibration

It is recommended that the 9103 Picoammeter be calibrated each year as part of your normal
instrumentation maintenance program.

The 9103 Picoammeter does not need to be sent to RBD Instruments to be calibrated. It is
recommended calibration be performed by a certified calibration facility. Calibration procedure
information is available from RBD Instruments upon request or at
http://rbdinstruments.com/Products/Picoammeter.html

13                                                                © Copyright 2010 RBD Instruments, Inc.
Additional Actuel Features
Actuel provides features for recording, graphing, and exporting data.
To access data recording features, click the Data button in the main Actuel window.
To access additional recording, formatting, graphing, and exporting options, click the Show Options
button in the Data window. You can also use this button to hide the options.

Recording and Exporting Data
Actuel provides features for recording data samples over time. These samples can be copied or
exported as text for use in graphing, spreadsheet, etc. applications. To access data recording features,
click the Data button in the main Actuel window.

Data recorded by Actuel is time‐stamped. Although the time‐stamp is not displayed, it can be exported
with the data in a variety of formats.

Starting / Stopping Data Recording
To start recording data, simply click the Record button, or hit the “r” key (If the unit is not already
sampling, pressing the record button will begin sampling automatically). Data is displayed in the
selected format in the field below.

If the Data field is not empty, any new data recorded is appended to the previously recorded data.

To stop recording data, click the Stop Recording button.

Saving, Copying, and Clearing Recorded Data
To save (export) data to a text file, simply click the Save button. You will be prompted for a file name,
and the data will be saved as an ASCII text file.

To copy data to the clipboard, click the Copy button.

To set the options for exporting data, click the Show Options button. The export options affect data
that is copied to the clipboard as well as data saved to a file.

To delete all data / clear the Data field, click the Clear button.

Note that closing the Data window deletes all previously recorded data.

Setting the Data Recording Options
There are various options available that determine what data is recorded.

14                                                                    © Copyright 2010 RBD Instruments, Inc.
Selecting the “Record out of range values” option will record all sample values regardless of whether
they fall within the selected range of the Picoammeter. If this option is not selected, only values that
fall within the selected range are recorded.

Selecting the “Record unstable values” option will record all samples regardless of whether the data
was sampled in a stable or unstable state. If not selected, only stable data values are recorded.

The “Record every” option allows you to specify recording or averaging over a number the number of
samples entered. For example, if you set this value to 4, every 4th sample will be recorded. This allows
you to specify a data logging sample rate higher than the 9103’s maximum sample rate of 10 seconds,
which is especially handy for recording over a long period of time when you do not want to produce
large data sets. Note that the unused samples are discarded. Set this value to “1” to record every
sample.

By clicking the “Average” option, Actuel will record the average of the number of selected samples,
and use this as the recorded value.

Setting the Data Formatting Options
There are various options available that determine how recorded data is formatted:

Selecting the “Display stability / range” determines whether the stability and range status of a sampled
value is displayed along with the value. This only applies if you chose to record those values that are
unstable and/or out‐of‐range. If this value is not checked the stability and range are not displayed.
You can select the notation used to display sample data values by selecting a choice in the “Sample
Value Notation”. The following notations are available:
Engineering (units): Decimal notation with units suffix, example: 0.0777534 nA
Engineering (no units): Decimal notation with no units, example: 0.0777534
Scientific (E) Notation: Scientific notation using the “E” suffix (often used by spreadsheet applications,
etc.), example: ‐7.690850E‐011

Setting the Data Export Options
There are various options available that determine how recorded data is exported. Note that these
options affect not only how data is saved to files, but also how data is copied to the clipboard.

Selecting the Export Absolute Time option will export the data with an additional column containing
the time‐stamp. You can format the time‐stamp for either UTC (universal) or local time.

Selecting the Export Relative Time option will export the data with an additional column containing the
relative time. The time scale begins at zero, with each data point reflecting the accumulated sampling
time. Though not as accurate as the absolute time, this will create a uniformly spaced time axis more
suitable for graphing and analyzing most data.

Selecting the Comma, Tab, or Space delimiter option selects the character used between data columns.

15                                                                  © Copyright 2010 RBD Instruments, Inc.
Graphing Data
Actuel automatically graphs data while you record, and displays it in the Data window (for more
information, see the previous section, “Data Recording”). Various options are available for determining
how graph data is display. There is also a feature to copy the graph as a bitmap.

How the Graph Time Scale is Calculated
Actuel displays sample data as current vs. time, with time being calculated by the sample rate. Keeping
this in mind, please note how the following affect the time displayed on the graph vs. real‐time:
     • If “Record unstable values” is not checked in the data recording options, graphing stops until
        sampling is stabilized.
     • If “Record out‐or‐range values” is not checked in the data recording options, graphing stops
        when data is out of range.
     • If recording is paused then restarted, the graph begins displaying data from where it left off.
     • The sample rate used for all data in the graph is the current rate, regardless of the rate when
        data was collected.
If you need a more accurate display of current vs. real‐time, set the recorder to record all values and
do not pause recording or change the sample rate while graphing.

Data Information Displayed on the Graph
The minimum and maximum of the data is displayed at the top left of the graph.

Copying the Graph
To copy the graph to the Clipboard, click the Copy button below the graph. You can copy the graph
while sampling.

Setting the X‐axis (Time) Options
There are three options for determining how the graph is displayed with respect to time:

Expand: Selecting this option will cause the x‐axis to grow with respect to the total acquisition time. As
the data gets closer to the end of the graph, the graph will redisplay with extended time proportional
to the total.
Last: Selecting this option displays the last minutes of the graph as determined by the field to the right
of the option. The left side of the time axis is always referenced to 0. For example, if you select “Last 5
mins.”, the x‐axis of the graph will display 0 – 5 minutes. Once there is more than 5 minutes of data,
the graph will continue to add data points to the end and remove them from the beginning, so that the
data flows from right to left through the time axis.
From (to): Selecting this option displays the data from the time specified in the first field to the time in
the last field to the right of the option. Note that if you collect data past the point in the “to” field, that
data is not displayed unless you increase the time, or select the Last or Expand option.

16                                                                     © Copyright 2010 RBD Instruments, Inc.
Setting the Y‐axis (Current) Options There are three options for determining how the polarity of current displayed on the y‐axis, as well as an option for selecting the baseline of the y‐axis. +/‐ (Pos./Neg.): Selecting this option will display all current regardless of polarity , with the y‐axis adjusting automatically depending on the full range of data. The top of the graph is the positive maximum. + (Pos.): Selecting this option displays only positive polarity current values. Negative values are truncated and displayed as 0. The top of the graph is the positive maximum. ‐ (Neg.): Selecting this option displays only negative polarity current values. Positive values are truncated and displayed as 0. Note that when this option is selecting, the direction of the graph is reversed and the top is the maximum absolute negative‐polarity value. Zero (0) Baseline: Selecting Zero (0) Baseline references the bottom of the y‐axis to zero (0), regardless of the absolute minimum current value. This option is not available if “+/‐ (Pos./Neg.)” polarity is selected. 17 © Copyright 2010 RBD Instruments, Inc.
Specifications

General

Feature                            Specification
USB Interface                      160 mW power consumption
2 nA minimum DAC Resolution        0.1 pA
2 mA minimum DAC Resolution        100 nA
Range                              2 nA to 2 mA with 100 fA resolution
Input Protection                   Reverse diode 1 VDC
Recorder Output Voltage            +/- 2.000 V per range
Warm-up                            1 hour to rated accuracy
Environment                        Operating 0o C to 40o C
Dimensions                         55 mm high x 170 mm wide by 165 mm deep
Net. Weight                        0.816 kg / 1.5 lbs.
Connections                        Input: BNC; Analog Output: Banana jacks
Safety                             Conforms to USB Power Specification – for user by
                                   qualified personnel who are trained in the use of
                                   test and measurement instrumentation
Accessories Included               Instructions manual, low noise BNC cable, USB
                                   power cable, USB driver, installation instructions,
                                   Actuel software

Resolution and Accuracy per Range

Range                     Resolution                       Accuracy
2 nA                      100 fA                           0.4 +/- %
20 nA                     1 pA                             0.2 +/- %
200 nA                    10 pA                            0.15 +- %
2 uA                      100 pA                           0.1 +/- %
20 uA                     1 nA                             0.1 +/- %
200 uA                    10 nA                            0.1 +/- %
2 mA                      100 nA                           0.1 +/- %

18                                                           © Copyright 2010 RBD Instruments, Inc.
Theory of Operation A low noise BNC cable provides the input current to the 9103. A low leakage double diode protects the 9103 amplifier from over voltage with respect to ground. The current is then input to a low femtoampere input current precision amplifier where the DC current is converted to a voltage. The converted voltage is fed into a precision high input impedance buffering amplifier before finally being converted to a digital value by the 24 bit digitally filtered ADC. The A/D converter is fed with a 2.50V reference. This produces a conversion of ‐8388608 to +8388607 for the maximum differential input of [‐2.50V, +2.50V) (223 = 8388608). With no error, an input of 0.000000000000A will produce an output conversion of 0. The margin between maximum differential input Voltage ±2.50V and nominal range ±2.00V allows offset calibration to accurately place the 0 conversion for 0 input current. Thus the nominal range is ‐6710886 for ‐2.0V to +6710886 for +2.00V. The filtering is user selectable with the effect of increased noise performance of the current measurement with a corresponding increase in the acquisition time. The ADC continually measures the current but the output can be averaged depending on the acquisition time selected by the user. The fastest acquisition time is 15mS with a typical acquisition time of 500mS or longer. The USB interface circuitry utilizes and industry standard flash microcomputer for ease of installation. Typical current draw for the 9103 is 160mA. Magnetic isolators are used to provide signal isolation between the micro controller and USB interface, and the current measurement circuitry and power supplies. Ten signals transition the isolation barrier, eight of which act as controlling inputs to the current measurement circuitry, and two of which provide feedback to the micro controller. Bias option – The bias option incorporates a low‐noise 90 VDC supply, with a 100k ohm resistor to limit the current to the 9103 in the event that the input becomes shorted while the 90V bias is applied. 19 © Copyright 2010 RBD Instruments, Inc.
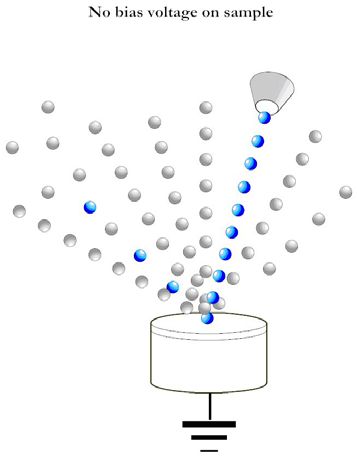
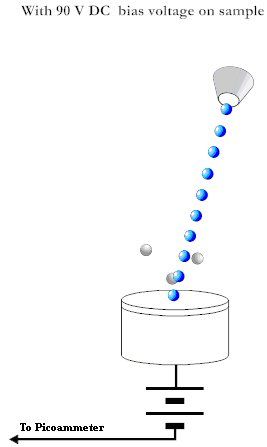
How the +90 Volt DC Bias Improves the Accuracy of Electron and Ion Current Measurements:
When the electron or ion beam impacts the target, secondary electrons are ejected. When measuring
the target current the secondary electrons will subtract from the total current, resulting in an
inaccurate current measurement.

Adding an ultra‐low noise +90 V DC supply in series with the picoammeter will bias the target and
substantially reduce the number of secondary electrons that leave the target; greatly increasing the
accuracy of the target current measurement.

       No Bias Voltage on Sample                           With 90 VDC Bias Voltage on Sample

20                                                                © Copyright 2010 RBD Instruments, Inc.
Communications & Command Reference Introduction The 9103 Picoammeter utilizes a communications protocol consisting of human‐readable ASCII text for all message content. By properly setting the VCP (Virtual COM Port), you can use applications that communicate with the VCP ‐ from Microsoft Hyperterminal for simple terminal communications to National Instruments’ LabVIEW for more sophisticated control. If you are using the Actuel application supplied with your Picoammeter, there is a built in console window that allows you to communicate directly with the Picoammeter using the commands outlined in this the following section – simply click the Console button to open the window at any time. Note that when using Actuel, you don’t need to manually setup communications. Also, note that the ampersand character “&” that precedes all commands is automatically entered for you – you do not have to type it. Setting up Communications Microsoft Windows The 9103 Picoammeter uses a USB‐serial converter chip manufactured by FTDI for communications. After installing the device drivers, the 9103 Picoammeter will, when plugged into the PC and turned on, appear listed in the Windows Device Manager under the Ports heading as USB Serial Port (COMx), where x is the COM port number assigned by Windows. To setup the COM port, double‐click this entry (or right‐click and select Properties) to bring up the Properties dialog. Note that the Manufacturer listed will be FTDI (not RBD). Click the Port Settings tab and set the fields as follows: Setting Value Bits per Second (Baud Rate) 57600 Data Bits 8 Parity None Stop Bits 1 Flow Control None Some serial communications applications supply their own interface for setting up COM ports and storing settings. In that case, the settings shown above still apply. Other Operating Systems Refer to your operating system for specific instructions on setting up virtual COM ports. 21 © Copyright 2010 RBD Instruments, Inc.
Communicating with the 9103 Picoammeter

Sending and Receiving Commands

For most commands, messages are sent from the computer to the Picoammeter, which
asynchronously sends an acknowledgement back after the command execution completes. If a
command message is incomplete, and error message is sent at the end of the timeout period.

Message Structure

The following table illustrates the structure of messages sent to and from the Picoammeter:

Attribute    Values         Length    Description                                                 Comments
                            (bytes)
PREFIX       ‘&’            1         Start of message
MESSAGE ID   ASCII alpha    1         Indicates content of message, whether command or            Supports 52
             character                data, etc. (See Message ID table below)                     characters (upper
                                                                                                  & lower case)
DATA         ASCII alpha‐   0‐80      For sample data messages:                                   Variable length
             numeric                  Formatted as comma separated string:                        messages are
             characters               “range, value, value, units”                                allowed
                                      Over‐range status indicated by ‘>’ or “=” in front of the
                                      range. Value is 8 digits plus a moving decimal point,
                                      dependant on the range. Units are nA, uA, or mA.
                                      For command messages:
                                      Parameter strings depend on the individual commands
CR/LF        End of line    2         End of message, standard carriage return / line feed        1
                                      (CR = ASCII character 13, LF = ASCII character 10)

22                                                                         © Copyright 2010 RBD Instruments, Inc.
Message IDs
The following table illustrates the message identifiers used when communicating with the
Picoammeter. Note that all messages are preceded by the character ‘&’.
Message ID Description
‘A’ From device or PC, sent after receiving and processing a valid command message that does not have its
own reply. May be used from the PC to acknowledge sample data messages, keeping the USB LED lit.
‘B’ From PC, controls the (optional) Bias supply. Parameter is either 1 (turn bias on) or 0 (turn bias off). This
setting will be stored in the Picoammeter eprom if the store (‘&Z’) command is sent. (Note that the bias
is automatically turned off when the input is grounded – see command ‘G’)
‘C’ From PC, command message for calibration. Parameter string: single character as follows:
1 = start offset calibration, device reports when complete
2 = start factory gain calibration, device prompts for applied reference currents, requires offset
calibration to be completed first, requires reference current source (IMPORTANT – this parameter
cannot be adjusted without special access codes and should not normally be selected by the user – it
will change the factory calibration settings)
5 = reset Chart constants to default (adjust while input disconnected)
6 = adjust Chart zero to be more positive (adjust while input disconnected)
7 = adjust Chart Zero to be more negative (adjust while input disconnected)
8= increase Chart Gain (adjust while input 1 nA, Chart output should be 1.00 Vdc)
9 = decrease Chart Gain (adjust while input 1 nA, Chart output should be 1.00 Vdc)
A = Enable (‘&CA1’) or Disable (‘&CA2’) Autocal of offset at power‐up
F = apply a factory offset adjustment to the active range
R = report runtime calibration values (updated at range change, but not stored in eeprom)
Q = report stored calibration constants (eeprom)
‘D’ From PC ,reset device. Default stored parameters reloaded, device initialized as for power up.
‘E’ From device, sent if there was an error. Includes string description of error.
‘F’ From PC, controls the filter settings for the sample data. Allowed values are 000, 002, 004, 008, 016,
032, and 064.
‘G’ From PC, enables shorting the input to ground. When enabled the input is grounded when the device is
not interval sampling. (Note that the bias is automatically turned off when the input is grounded – see
command ‘B’)
1 = Input grounded
0 = input normal
If interval sampling is begun, the inputs are opened until sampling is stopped. For single samples, the
input is opened for 5 seconds after a sample is requested
‘I’ From PC, command message to set the data sample interval, parameter is in milliseconds, 0015 to 9999
‘L’ From PC, command message to set the Logging Chart (chart recorder) update interval, parameter is
milliseconds, 0050 to 9999
‘M’ From PC, requests a command menu, from the device, sends a formatted command menu.
‘N’ From PC, trigger the External Offset Null, function (not allowed if Auto Range is selected, correction is
lost with new range or power cycle
‘Q’ From PC, query device for current configuration. From device, report configuration
‘R’ From PC, sets the device range, parameter options are 0=Auto Range, 1=2nA, 2=20nA, 3=200nA, 4=2uA,
5=20uA, 6=200uA, 7=2mA
‘S’ Contains one sample of measured data (sent from device) or requests an immediate sample (sent from
PC)
‘T’ From PC, request Test. Parameters are as follows:
000000 ‐ chip select test
100000 ‐ isolated power control
200000 – AD7767 reset test
23 © Copyright 2010 RBD Instruments, Inc.300000 – data latch tests
400000 – DAC latch pin test
500000 – DAC data tests
600000 – DACZero latch pin test
700000 – DACZero data tests
‘V’ Sets the number of digits, displayed values are 5, 6, 7, 8. Default is 5.
‘Z’ Stores current configuration in eeprom
24 © Copyright 2010 RBD Instruments, Inc.You can also read