WINDOW ON ASSESSMENT SPRING 2019
←
→
Page content transcription
If your browser does not render page correctly, please read the page content below

S P R I N G 2019

WINDOW ON ASSESSMENT
C A L I F O R N I A S TAT E U N I V E R S I T Y, S A C R A M E N T O O F F I C E O F A C A D E M I C A F FA I R S

                                                                                                    Table of Contents
                                                                                         1. Using Technologies to Effectively Create
                                                                                         and Document the 21 Century Learning
                                                                                         Paradigm and Use the New Data to
               Spring 2019 | Issue 23                                                    Improve and Showcase Student Learning
                                                                                         and Success Dr. Amy Liu
      Office of Academic Program Assessment
      (OAPA)
                                                                                         2. Our ARC Presentation, Our Vision Dr.
      Dr. Amy Liu, Director
                                                                                         Chia-Jung Chung
      Location: South-End Library 67
      Phone: 916-278-2497                                                                3. Sharing our Progress across the CSU
      Email: liuqa@csus.edu                                                              System Dr. Milica Markovic, Dr. Jacqueline
                                                                                         Brooks

      Office Open: Monday - Friday
                                                                                         4. 2017-2018 Annual Assessment
      Phone: 916-278-2497 | oapa-02@csus.edu
                                                                                         Summary Dr. Amy Liu, Shelby Zahn
      Contact us anytime for updates or support!

                                                                                         5. Reflection: Collaboration as a Means to
      Visit us at: csus.edu/programassessment                                            Success Shelby Zahn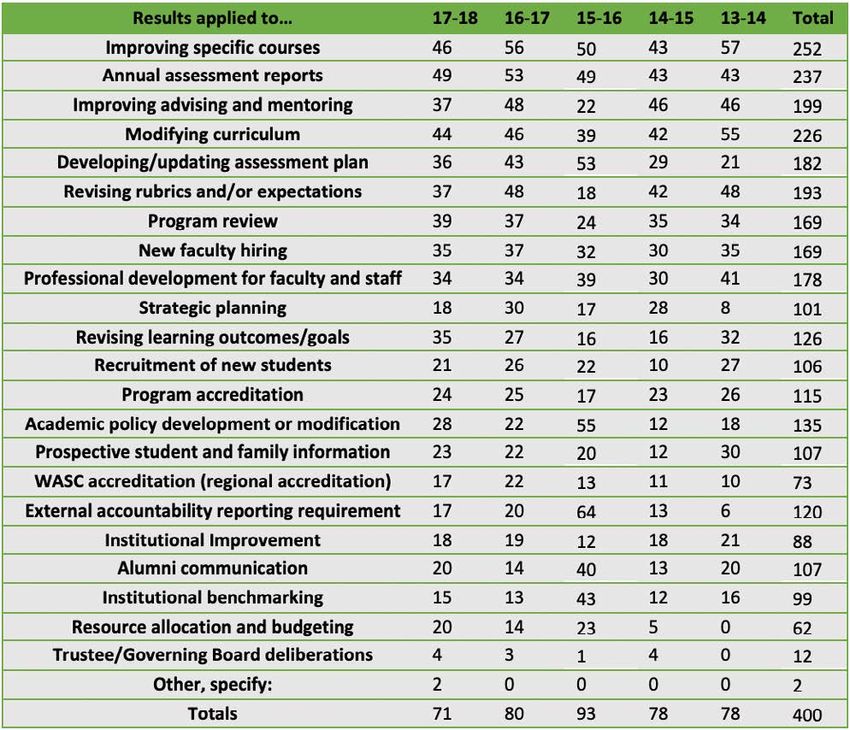
1. Using Technologies to Effectively Create and Document the 21
Century Learning Paradigm and Use the New Data to Improve and
Showcase Student Learning and Success
Amy Liu, Ph.D., Director, OAPA, and Professor of Sociology

Since 2017, the Office of Academic Program Assessment (OAPA) has initiated
and overseen a revolutionary Technology & Learning Pilot Project that utilizes
technologies (Canvas, and in the future, Campus Labs) to implement a new                                Amy Liu
learning vision with a grading system that explicitly highlights student learning
outcomes. This strategic assessment project has creatively used Canvas and other
technologies (Excel, SharePoint, and SPSS) to:
    •• Make annual assessment, 6-year program review, and accreditation processes and data
        simple, clear, and useful;
    •• Integrate assessment data with other existing student success data to improve student
        learning and success;
    •• Improve and promote institutional effectiveness at the course, program, department,
       college, and the university levels;
    •• Facilitate WASC and other specialty accreditations including ABET, AACSB, CCNE,
       or CCTC.

  We care deeply about student learning and success, and constantly strive to improve them.
However, we are often asked to do more with less. Sacramento State has used information
systems to identify student achievement gaps, progression toward graduation, and
graduation rates. Academic Affairs; Student Affairs; Institutional Research, Effectiveness, and
Planning (IREP); and outside research agencies (EAB, NSSE, and WestEd) have collected data to
determine which practices most effectively enhance learning and close gaps.

  Currently, our campus is lacking the explicit creation and documentations of the knowledge
and skills needed for the holistic development of our students into local and global citizens.
Such knowledge and skills are necessary for our students to contribute to the social, economic,
and environmental good of the world, as well as are invaluable in the modern workplace. The
demands for faculty to simultaneously balance teaching, grading, and assessment have also
increased significantly and make it difficult for faculty to effectively demonstrate the value
of teaching.

  Canvas plus the creative use of Campus Labs products (Outcomes, Program Review, and
Insight) would allow us to easily:
    •• Create and document a new learning-outcome-based grading system at the program
       and university levels that allows faculty to collect individual student learning data
       about their leadership or critical thinking skills, in addition to data collected relating to
       the traditional course grading system (A, B, C, D, F, or W);
    •• Allow faculty to use real-time data to improve student learning and success while
       students are taking the class;
    •• Allow students to use real-time data to improve their own learning and success while
       taking the class;
    •• Allow other faculty, staff, and administrators to use real-time data to improve
       student learning.

                                                                          Office of Academic Program Assessment Spring 2019 | 2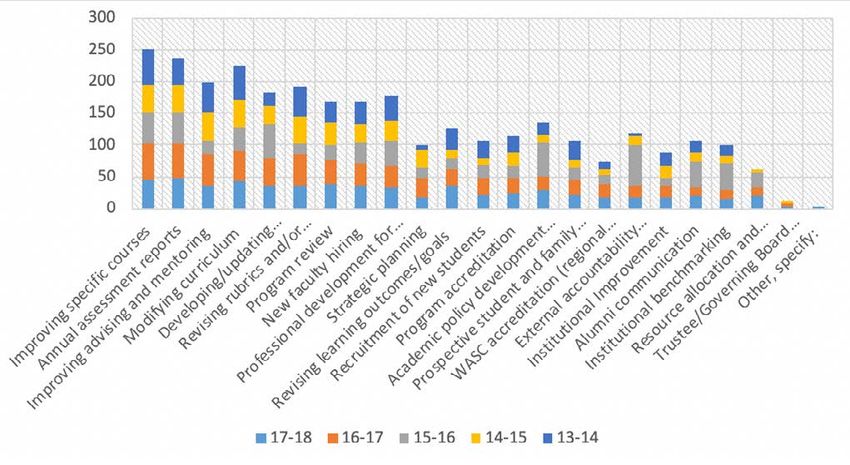
This data can also be used effectively and more easily for annual assessment, 6-year program
review, and accreditations and to truly understand and report on student learning and success
for each individual student and at each level (the course, program, department, college, and
university levels).

  Most importantly, this project would significantly reduce our feedback and action cycle from
6-8 years (based on the 6-year program reviews, review team report and external consultant
report) or 1-2 years (based on current annual assessment and feedback reports) to a semester,
allowing faculty, staff, and administration to quickly identify student learning and achievement
gaps and to give immediate feedback and support to our students at each level.

  The Graduation Initiative 2025 is California State University’s ambitious initiative to increase
graduation rates for all CSU students while eliminating opportunity and achievement gaps.
Through this initiative, the CSU will ensure all students have the opportunity to graduate in a
timely manner according to their personal goals, positively impacting their future while
producing the graduates needed to power California and the nation. Our Technology &
Learning Pilot Project can help Sacramento State:
    •• Create quality learning data and provide insight for student learning at each level;
    •• Create dashboards to track student learning and progress toward graduation;
    •• Examine programs’ overall graduation rates and perceived barriers through
         data visualizations;
    •• Focus on students’ life-cycle from identifying applicants most likely to succeed to
       students who may struggle;
    •• Identify and design strategies to close student learning and achievement gaps.

  This project is possible with the help from colleagues and friends inside and outside the
campus. Our deep thanks and gratitude go to:
    •• Our assessment consultants, both past and present (Judith Kusnick, Beth Strasser, Jing
         Pang, Milica Markovic, and Jackie Brooks);
    •• Our former and current student assistants (Paul Schoenmann, Christian Schoenmann,
         Shelby Zahn, and Dylan Baker);
    ••   Amy Wallace (Associate Vice President, Academic Excellence, Academic Affairs), Dr. Don
         Taylor (Former Interim Assistant Vice President, Academic Programs and Educational
         Effectiveness), and Kathy Mine (Administrative Support Coordinator, Academic Affairs);
    ••   IRT (Information Resources & Technology): Shawn Luong Sumner (Course Evaluation
         Consultant, Academic Information Tech) and Matthew Kay (Online Course Developer,
         Academic Information Tech);
    ••   Center for Teaching and Learning: Dr. Lynn Tashiro, April Qian and Kyle Cage;
    ••   Michael Weisman, Vice President and Co-Founder of Campus Labs;
    ••   Dr. James Dragna, Executive Director, Office of University Initiatives and
         Student Success.

                                                                          Office of Academic Program Assessment Spring 2019 | 3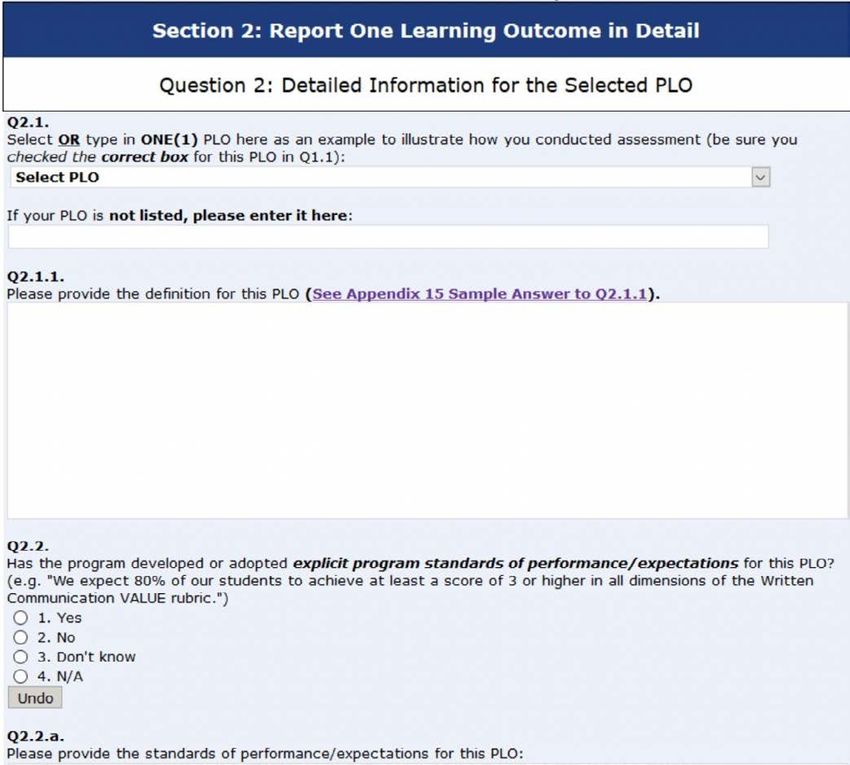
2. Our ARC Presentation, Our Vision
                                Chia-Jung Chung, Ph. D., Consultant, OAPA, and Professor of iMET

                                It has become one of the most exciting highlights to attend and present at the
                                WSCUC Academic Resource Conference (ARC) every year.

                              This year, Drs. Amy Liu and Chia-Jung Chung, representing the OAPA
                            team, presented and facilitated a Deep Dive1 workshop titled “Creative Use of
                           Technology to Effectively Document and Improve Student Learning and Success”.
    Chia-Jung Chung        In our presentation, we were fortunate to have a group of attendees who have
                     significant familiarity with Canvas and are seeking advanced information from our
             structure of data system and Canvas pilot. It is interesting to find our presentation topic nicely
             combined some key themes presented in the ARC conference, including: use of technology,
             meaning of data, and assessment in higher education.

                Most attendees’ campuses have adopted Canvas as their LMS, but they are using it mostly at
              the course level. Therefore, the data collection is still not structured and planned at the
              program and university level and lacks effective faculty program collaboration.

                To bridge this gap, the OAPA team was able to present our current assessment key processes
              (Prepare Data, Collect Data, Analyze Data, Report Analyzed Data, Store Data and Use Analyzed
              Data) and share our Canvas pilot and future directions, especially the integration of analytic
              technology and Canvas. The attendees were inspired by seeing our long-term and
              comprehensive data collection plan and asked great questions about our plan to implement
              and facilitate the process. What most attendees took away from our presentation is the vision
              for university data collection, specifically how to integrate all data sources to make the data
              more meaningful and relevant to student learning and student success.

                Technology is merely the tool, but collaboration among the people who collect data is more
              important than the use of technology, as we at OAPA have found through our Canvas pilot
              and experiences with assessment. I felt grateful to present and prepare this presentation with
              my OAPA colleagues. It took us tremendous effort and discussion to come up with this vision
              after years of data collection. We don’t know the most desirable solution yet, but we are firmly
              confident we are on the right track to making assessment simple, useful and meaningful.

The ARC conference categorizes the level of information addressed in the presentations as Fundamental, Strategic, and Deep Dive.
1

                                                                                                              Office of Academic Program Assessment Spring 2019 | 4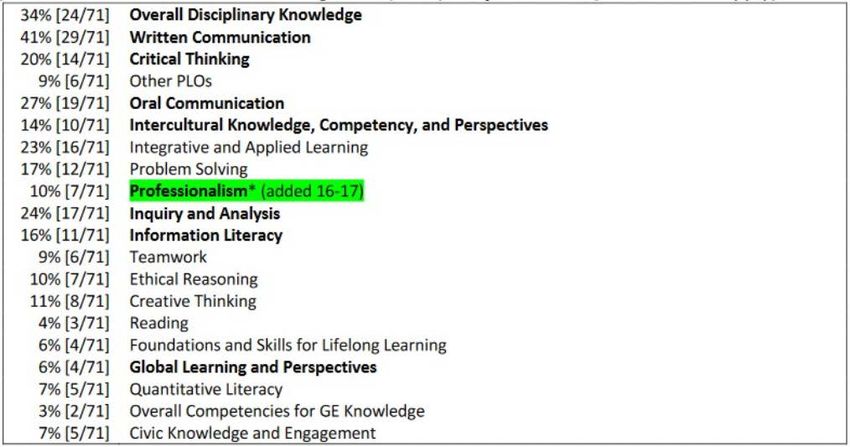
3. Sharing our Progress across the CSU System
Milica Markovic, Ph. D., Consultant, OAPA, and Professor of Electrical and
Electronic Engineering
Jacqueline Brooks, Ph. D., Consultant, OAPA, and Professor of Sociology

Drs. Milica Markovic and Jackie Brooks, faculty consultants representing the OAPA
team (Office of Academic Program Assessment), participated in the CSU Teaching
Symposium held March 9 at Fresno State. The annual event gathers educators
from across the CSU system to share teaching innovations and best practices. This                     Jacqueline Brooks
year’s theme was, “Educating Our Golden State: Reaching the Next Generation of
Californians.” Our presentation titled, Program Level Assessment Pilot Using
Outcomes in Canvas, described an on-going study focused on the use of
technology as a tool of academic assessment. Overall, the experience reinforced
the need to study how various technological aids can support the assessment
process from data collection to analysis, ultimately helping programs close the
loop, thereby promoting student success. Our study began fall 2017, with OAPA
consultants Milica Markovic, Chia-Jung Chung, and Jackie Brooks, each “teaching”
a simulated course established in Canvas. The data collected from each course
was aggregated at the program level, and analyzed using additional software.
The following is a brief overview of our presentation, highlighting the important                      Milica Markovic
points shared with colleagues at the Symposium. The full presentation
can be found on OAPA’s website.

  First, it was important for us to relay to the audience that our efforts will hopefully identify
ways to reduce faculty workload relative to the assessment process, and report our findings.
Faculty are often asked to do more with less. In this case, we seek to discover how faculty can
use Canvas to collect and analyze assessment data.

  Second, we outlined our process:

     Step One: Worked with IRT to create a virtual “OAPA Program.”
     Step Two: Created three courses under the newly established “OAPA Program.”
     Step Three: Enrolled thirty virtual students to each course.
     Step Four: Created PLOs/rubrics at the OAPA administrative level.
     Step Five: Aligned PLOs to course assignments.
     Step Six: “Graded” each assignment using the rubrics created at the program level.
     Step Seven: Analyzed the data using SPSS and Excel.

   We fully described each step, using screenshots of various points in the process to better
illustrate our methodology. We would have spent more time discussing the creation of PLOs/
rubrics in Canvas; however, time was short.

                                                                             Office of Academic Program Assessment Spring 2019 | 5
Third, we thought it was important to show the audience what the raw data looks like when
the initial report is generated in Canvas. In addition, we offered examples of how to process
and report the data. Each step is integral to understanding how Canvas can improve the
assessment process. Rather than spend time collecting data from various instructors, Canvas
allows programs to simply generate a report that contains assessment data from across the
program. If using additional software, such as SPSS or Excel, faculty will be required to
transform the data from its raw state to usable tables, charts, and graphs.

  Since our project was merely a simulation, we did not address how the data could be used
to improve student success. After all, our students, assignments, and courses, were not real.
However, we closed out our presentation by discussing the importance of meaningful data
analysis. It is how we interpret the data, and apply our discoveries to our programs that
indicates how much we can affect student success.

 Overall, we enjoyed the experience, and look forward to sharing our study at other venues.

                                                                       Office of Academic Program Assessment Spring 2019 | 6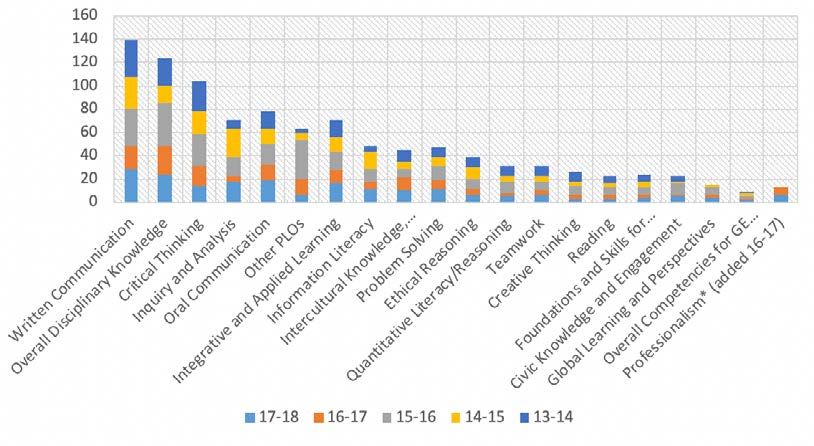
4. 2017-2018 Annual Assessment Summary
                  Amy Liu, Ph. D., Director, OAPA, and Professor of Sociology
                  Shelby Zahn, Student Assistant, OAPA, and Graduate Student in Sociology

                  Our academic programs have made significant progress in their annual
                  assessment for the 2017-2018 academic year. Many programs have improved
                  their assessment process through the refinement and alignment of, and better
                  methods used to measure, their Program Learning Outcomes (PLOs), as well as
                  increased usage of assessment results to improve student learning and success.
  Amy Liu
                  For example, more programs are utilizing results to improve their annual
                  assessment reports and plans. Based on Tables 4B and 4C, the percentage of
                  programs that applied previous assessment results “quite a bit” to their annual
                  assessment reports almost tripled in the 2017-2018 academic year. Likewise, the
                  percentage of programs that applied previous assessment results “quite a bit” to
                  developing or updating their assessment plans almost doubled in 2017-2018.

                  Program Learning Outcomes (PLOs) Assessed in 2017-2018

                     For the 2017-2018 academic year, 71 programs (46 undergraduate programs, 17
                     graduate programs, 5 credential programs, and 3 doctorate programs) submitted
Shelby Zahn          annual assessment reports. Approximately 11% of programs reported not having
       developed an assessment plan, and 6% did not know when their program’s plan was
       developed. Encouragingly, 75% of programs have updated their assessment plan within the
       last six academic years (2011-2019) (see the 2017-2018 University Data Summary on our
       website: https://www.csus.edu/programassessment/annual-assessment/2017-18Reports/
       Data%20Summaries/17-18%20Prelim.%20Uni.%20Data%20Report.pdf – Q20.1).

       Programs continue to assess a wide range of PLOs and improve their alignment with the
     mission of the University and the program. For the 2017-2018 academic year, thirty-four
     percent (34%) of our programs assessed competencies in the majors/disciplines (also called
     overall disciplinary knowledge), and as was the case for the 2016-2017 academic year,
     two-thirds assessed intellectual and practical skills (see Table 1 for raw numbers). Compared
     to last academic year when 25% of programs assessed written communication, this academic
     year, 41% selected the PLO. The amount of programs that assessed critical thinking remained
     constant (20% this year versus 22% last year). Similarly to last year, many programs assessed
     inquiry and analysis (24%), problem solving (17%), and creative thinking (11%); these
     percentages have more than doubled since the 2016-2017 academic year (see Table 1B for
     a comparison).

                                                                           Office of Academic Program Assessment Spring 2019 | 7
Table 1 (relates to Q1.1 in the Annual Assessment Report)
Q1.1. Which of the following Program Learning Outcomes (PLOs,) Sacramento State
Baccalaureate Learning Goals (BLGs,) and emboldened Graduate Learning Goals (GLGs)
did you assess? [Check all that apply] (raw numbers)
Table 1A (relates to Q1.1 in the Annual Assessment Report)
Q1.1. Which of the following Program Learning Outcomes (PLOs,) Sacramento State
Baccalaureate Learning Goals (BLGs,) and emboldened Graduate Learning Goals (GLGs)
did you assess? [Check all that apply] (raw numbers)
Office of Academic Program Assessment Spring 2019 | 8Table 1B (relates to Q1.1 in the Annual Assessment Report)
Q1.1. Which of the following Program Learning Outcomes (PLOs,) Sacramento State
Baccalaureate Learning Goals (BLGs,) and emboldened Graduate Learning Goals (GLGs)
did you assess? [Check all that apply] (raw numbers)
Based on the data from our 2017-2018 annual assessment reports, 83% of our programs
said that their PLOs closely aligned with the mission of the university (see Table 1B). When
asked if their program aligned with the missions, goals, and outcomes of their respective
accreditation agencies (if they answered yes on Q1.4: Is your program externally accredited?),
97% (n = 33) answered yes. In response to Q2.2 of our 2017-2018 annual assessment report,
79% of programs stated that they have developed explicit standards of performance and 75%
have developed curriculum maps.
Continuing the trend from last year, programs publicly published their PLOs. According to
the results for Q2.4, programs most commonly published their PLOs in: 1) annual assessment
reports and program review reports/plans (62%); 2) some course syllabi where the PLO is
addressed (41%); and 3) program websites or newsletters (31%). The top three places where
programs published their PLOs is the same as it was for the 2016-2017 academic year (see
OAPA Fall 2017 Newsletter, Issue 20, on our website for more details: https://www.csus.edu/
programassessment/Docs/news/oapanewsletter1/Fall%202017%20OAPA%20Newsletter%20
Final.pdf ).
Office of Academic Program Assessment Spring 2019 | 9Data Collection and Evaluation
Out of the 71 programs that submitted reports for the 2017-2018 academic year, 92%
collected data or evidence for the selected PLO and 89% scored or evaluated it. Based on Q3.3
and Q3.7, 86% of programs used direct measures to evaluate the data while 23% used indirect
measures. In terms of direct measures that were used, 38% of programs used capstone
projects. Like last year, this year’s most common direct measure used to assess student work
was key assignments from required classes in the program (47%). Capstone projects and
classroom based performance assessments accounted for 38% and 20%, respectively, of the
other most common direct methods (see Table 2). Based on the results for Q3.4, 73% of the
programs used rubrics to directly evaluate the data and 6% used no rubric (see Table 3).
Table 2 (relates to Q3.3.1) (uses valid percent)
Table 3 (Q3.4) (uses valid percent)
Office of Academic Program Assessment Spring 2019 | 10Use of Assessment Data
Many programs care deeply about improving the quality of their courses and curriculum. From
2013-2018, with the exception of 2015-2016, programs have had a fairly consistent primary
focus on applying their previous assessment results to improving specific courses (see Tables
4-4A). From 2017-2018, programs have primarily applied their results to improving specific
courses, annual assessment reports, and modifying curriculum, differing slightly from the
previous academic year where programs applied their results to the first two, as well as
improving advising and mentoring and revising rubrics and/or expectations. From 2015-2016,
programs focused on external accountability reporting requirement, academic policy
development or modification, and developing or updating assessment plan. In 2014-2015,
programs chose the same first three options as programs in 2016-2017 (improving specific
courses, annual assessment reports, and improving advising and mentoring), excluding
revising rubrics and/or expectations. In 2013-2014, programs also chose improving specific
courses and modifying curriculum, and as with 2016-2017, revising rubrics and/or
expectations. See Table 4A for a visual representation.
With regards to programs applying previous assessment feedback from OAPA to the
improvement of their program learning outcomes, standards of performance, measure,
rubrics, alignment, data collection, data analysis and presentation, use of assessment data,
and other areas, the results are split. For instance, although 55% of programs said that they
used “very much,” “quite a bit,” and “some” of OAPA’s feedback to improve their PLOs, 45% said
that they either did not at all, or else said “N/A” or did not answer (see Q5.3 in our 2017-2018
University Summary Data). For standards of performance, 56% said that they used the
feedback ranging from some to very much, whereas 44% answered “not at all” or “N/A,” or did
not answer at all. Data analysis and presentation is what programs reported using the most
from OAPA; 61% said that they applied it “very much,” “quite a bit,” or “some,” in contrast to
about 40% of programs who answered “not at all” or “N/A”, or who did not answer at all.
Office of Academic Program Assessment Spring 2019 | 11Table 4A (Q5.2): A Comparison from 2013-2018
Q5.2. To what extent did you apply previous assessment results collected through your program
in the follow areas?
[Check all that apply] (raw numbers)
Office of Academic Program Assessment Spring 2019 | 12Table 4A (Q5.2): A Comparison from 2013-2018
Q5.2. To what extent did you apply previous assessment results collected through your program
in the follow areas?
[Check all that apply] (raw numbers)
Office of Academic Program Assessment Spring 2019 | 13Table 4B (Q5.2) 2016-2017 Academic Year
Use of Assessment Data [Check all that Apply] (uses cumulative percent)
Office of Academic Program Assessment Spring 2019 | 14Table 4C (Q5.2) 2017-2018 Academic Year
Use of Assessment Data [Check all that Apply] (uses cumulative percent)
Office of Academic Program Assessment Spring 2019 | 155. Reflection: Collaboration as a Means to Success
Shelby Zahn, Student Assistant, OAPA, and Graduate Student in Sociology
During my two years at the Office of Academic Program Assessment (OAPA), I have
witnessed how deeply Sacramento State University’s faculty cares about student
learning and how eager they are to facilitate student success. Our own office is
comprised of faculty rather than administrators, meaning that they have key insight
as to how assessment directly affects student learning at the course and program
levels through their own experiences. In addition to their teaching experiences, the
faculty at OAPA have used data and technology to improve and promote our Shelby Zahn
university’s programs.
For instance, OAPA has conducted a pilot using Canvas test courses with fake students to
generate examples of student learning data (see Milica and Jackie’s article for more details).
This data, when applied to real courses, can be extremely meaningful, as Canvas provides
insight as to what percentages of students are exceeding, meeting, meeting minimum
standards, or not meeting standards of performance based on VALUE rubrics. Thus, it is our
office’s goal to have several programs in the fall perform their own pilots by using Canvas,
as well as Campus Labs, for data collection and analysis in their real courses. Once those
programs have experimented, we can potentially move from the individual course-level of
collection and analysis to the program-level, with each department collecting and analyzing
their data in Canvas and Campus Labs. Once each department has its programs on Canvas
and Campus Labs, we can have university-level data and analysis that can provide insight as to
what actions to take for courses or departments where students seem to need the most help.
It can also be easier to write assessment plans and have a visual representation of the data via
Campus Labs.
Aside from the Canvas pilot and potential uses for Campus Labs, since the 2013-2014
academic year, we have been collecting and analyzing data from our annual assessment
reports using SharePoint, Excel, and SPSS. Each year, programs complete the report via
SharePoint, and once the submission deadline has passed, we export that data into Excel. In
Excel, we clean the data, removing any reports that were left blank, and then import the Excel
sheet into SPSS to run frequencies and crosstabs. This has provided us historical data that
we can use to identify trends in various programs, departments, and colleges’ reported PLOs,
standards of performance, direct and indirect measures, rubrics, assessment plans, curriculum
maps, and other information. This gives us a frame of reference as to where programs,
departments, and colleges can improve or benefit from some assistance in order to insure the
best learning environment for both faculty and students.
Additionally, our director, as well as consultants, are open to meeting personally with
interested programs to facilitate the program review process. We are constantly reaching out
to different colleges to address their needs and concerns, and on a broader level, each semes-
ter, we host at least two workshops—typically Program Review and Annual Assessment &
SharePoint—to provide tutorials as to how to complete the annual assessment template, how
to more simply and clearly analyze and collect data, and what information to have for program
Office of Academic Program Assessment Spring 2019 | 16review. Our office is all about collaboration and community outreach.
On a personal note, OAPA has enabled me to develop and refine numerous skills that
have greatly aided in my professional development. I am grateful to the experiences and
opportunities that I have had thanks to Director Amy Liu; OAPA consultants Milica Markovic,
Jacqueline Brooks, Chia-Jung Chung, and Jing Pang; and former student assistants, Christian
and Paul Schoenmann, and Dylan Baker.
For the 2016-2017 academic year, I was responsible for:
•• Department-coding the 2016-2017 Annual Assessment Reports and checking them for
feedback and clarity
•• Editing newsletter articles for grammar, clarity, and consistency
•• Organizing materials for OAPA workshops
•• Granting permissions to programs to be able to access their reports via SharePoint and
trouble-shooting issues with the software
•• Running crosstabs via SPSS and inputting data for the 2016-2017 College
Data Summary
•• Updating the OAPA website with newsletters, data summaries, materials from
workshops and workshop dates, and important information or instructions related to
SharePoint and annual assessment reports
During the 2017-2018 academic year, I completed the following:
•• Department-coded the 2017-2018 Annual Assessment Reports, checked them
for feedback and clarity, and created the 2017-2018 Annual Assessment Feedback
Template
•• Edited newsletter articles for grammar, clarity, and consistency
•• Organized materials for OAPA workshops
•• Created the 2018-2019 Annual Assessment Template
•• Imported the 2018-2019 Annual Assessment Template to SharePoint and granted
permissions to respective programs
•• Ran frequencies via SPSS and input data for the 2017-2018 University Data Summary
•• Ran crosstabs via SPSS and input data for the 2017-2018 College Data Summary
•• Began creating an original database with variables related to each programs’ PLOs,
BLGs/GLGs, assessment plans, and curriculum maps
•• Continuously updated the OAPA website with the 2017-2018 Annual Assessment
Reports and Feedback, newsletters, data summaries, materials from workshops and
workshop dates, and important information or instructions related to SharePoint and
annual assessment reports
Because of OAPA, I now have experience using Canvas (a Learning Management System) at
the administrative level to create and import VALUE rubrics and related outcomes; creating
annual assessment report templates in InfoPath; uploading annual assessment report
templates onto SharePoint; exporting SharePoint data to Excel and cleaning data; importing
data into SPSS and running frequencies and crosstabs; presenting data using Pivot Tables in
Excel; collaborating with consultants and Dr. Liu via Google Docs and Sheets; organizing and
maintaining a Google Drive directory; uploading files onto, creating webpages for, and
maintaining the OAPA website using Cascade; and writing University and College Data
Summaries. See the images below for some examples of my work.
Office of Academic Program Assessment Spring 2019 | 17Question 1: Program Learning Outcomes (PLOs) Assessed in 2017-2018.
Q1.1. Which of the following Program Learning Outcomes (PLOs,) Sacramento State
Baccalaureate Learning Goals (BLGs,) and emboldened Graduate Learning Goals (GLGs) did you
assess? [Check all that apply] (raw numbers)
From the 2017-2018 University Data Summary: https://www.csus.edu/programassessment/annu-
al-assessment/2017-18Reports/Data%20Summaries/17-18%20Prelim.%20Uni.%20Data%20Report.pdf
Office of Academic Program Assessment Spring 2019 | 18From 2018-2019 Annual Assessment Template
Office of Academic Program Assessment Spring 2019 | 19Question 1: Program Learning Outcomes (PLOs) Assessed in 2017-2018
From the 2017-2018 University Data Summary: https://www.csus.edu/programassessment/annu-
al-assessment/2017-18Reports/Data%20Summaries/17-18%20Prelim.%20Uni.%20Data%20Report.pdf
It has been an immense privilege to work for OAPA for these two years, and the experiences
that I have made in this office have taught me the true value of collaboration. This office has
been successful in its endeavors due to Dr. Liu’s tireless commitment to making assessment
simple, clear, and meaningful (or of high quality), the consultants’ dedication to providing
quality feedback and assistance to programs in and outside of their respective colleges, and
the student assistants’ (including all those before me) data analysis and organizational skills.
Together, through our weekly OAPA consultant meetings and through our collaborative
projects throughout the academic year, we are all successful due to our support for each other
and the unique insight that each of us brings to the group. Thank you for allowing me to grow
and learn in such a positive, helpful environment. Through this kind, collectivist spirit, I know
that this office will continue to guide and shape Sacramento State’s assessment for the better.
Office of Academic Program Assessment Spring 2019 | 20You can also read