Enhancement and Development of Next Generation Data Mining Photolithographic Mechanism - IOPscience
←
→
Page content transcription
If your browser does not render page correctly, please read the page content below

Journal of Physics: Conference Series

PAPER • OPEN ACCESS

Enhancement and Development of Next Generation Data Mining
Photolithographic Mechanism
To cite this article: D Geetha et al 2021 J. Phys.: Conf. Ser. 1964 042092

View the article online for updates and enhancements.

                                This content was downloaded from IP address 46.4.80.155 on 12/08/2021 at 17:27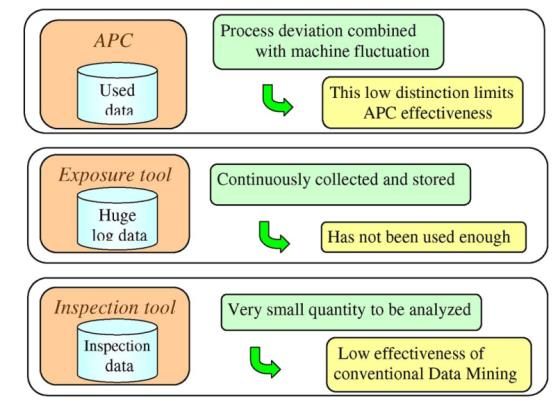
ICACSE 2020                                                                                                     IOP Publishing
Journal of Physics: Conference Series                         1964 (2021) 042092          doi:10.1088/1742-6596/1964/4/042092

Enhancement and Development of Next Generation Data
Mining Photolithographic Mechanism

                     D Geetha1*, V Kavitha2, G Manikandan3 , and D Karunkuzhali4
                     1
                       Department of Information Science and Engineering, BNM Institute of Technology,
                     Bengaluru, Karnataka, India
                     2
                       Department of Computer Science and Engineering, Sri Sairam Engineering College,
                     Chennai, Tamil Nadu, India
                     3
                       Department of Computer Science and Engineering, Kings Engineering College,
                     Sriperumbudur, Tamil Nadu, India
                     4
                       Department of Information Technology, Panimalar Engineering College, Chennai,
                     Tamil Nadu, India
                     Email: *1dgeetha78@yahoo.com, 2kavitha.cse@sairam.edu.in, 3mani4876@gmail.com.
                     4
                       Karunkuzhali@gmail.com

                     Abstract. The analytical data of project management was established. In a stereolithography
                     method, the APC system was already implemented in essential dimensions and overlays.
                     Productivity and system efficiency have been enhanced. The new APC, however, is created on
                     the inspection information where the method anomalies are blended with the fluctuation of the
                     system and which have to evaluate very small quantities, and it has the impact cap. The
                     inspection data for the CD, overlay and log information of the acquaintance tool in ainteractive
                     data base have been compiled and processed. We have also investigated how the earlier in this
                     thread problem can be paid and resolved. First of all, in the enormous tool log data we have
                     extracted ties between inspection informationbesides several parameters, particularly factor
                     loadings. We then discussed problems with big relationships and have, thus, gathered valuable
                     knowledge which did not come out of the traditional system. In order to show the stabilising
                     machine fluctuation effect, we developed, along with APC, a second-generationinformation
                     mining system.
                     Keywords: Data mining, photolithographic mechanism, inspection data, hug log data, APC,
                     XML

1. Introduction
It is necessary to enhance the machine productivity, i.e., the performances and the throughputs, to get
an advantage over semiconductor output. In also complicated and tight operating conditions,
machinery was presumed to work with stability. The execution system and engineering system for
production and equipment have been designed and applied for this reason. EES has captured and
processed a lot of data, particularly for advanced process management, from equipment to be used for
a variety of purposes, in which extremely intelligent systems are needed for the control of specific
operation besidesconservation of infrastructure to be adjusted in each process but also among
applications.
    To that end, EES must capture also store log information of the vast amount of different accurate
equipment data. The programme for data analysis extracts different forms of statistical variations that
are useful for improving overall machinery reliability and for extracting the causes of fault. Different
              Content from this work may be used under the terms of the Creative Commons Attribution 3.0 licence. Any further distribution
              of this work must maintain attribution to the author(s) and the title of the work, journal citation and DOI.
Published under licence by IOP Publishing Ltd                          1
ICACSE 2020 IOP Publishing
Journal of Physics: Conference Series 1964 (2021) 042092 doi:10.1088/1742-6596/1964/4/042092
quantities of data are large to be analysed, so the statistical variations can hardly be easily extracted
using the traditional data analysis technique. In addition, these data intertwine in many cases
complicatedly and alter. We have also started to explore information mining submissions [1] as one of
the approaches of information processing besides since 1998 it has been very valuable. We've had
several tales of success [2],[3]. In order to accurately extract the source of errors, data mining is a
mathematical tool for the poor yields.
We define objectively which system and what stage of production have product yield and
efficiency issues, then determine which countermeasures to enhance. A photolithographic process is
one of the most powerful procedure steps for creation yield and output. This method uses inspection
details that combine process anomalies with system variability and that has to be evaluated in an
extremely limited amount, which reduces its efficacy [5]. This lack of differentiation. The method
divergence from the system fluctuation is difficult to distinguish for the lots processed constantly,
despite the EES frequently tracking the machine volatility. We used an internal APC system that stores
in a relativized database the essential measurements and the overlay examinationinformation as well as
log information from the experience tool [6].
In the current conditions, this allows a fast besides effective understanding of efficiency challenges
and enables the detection of sources of errors. We have also investigated how the above-mentioned
problem can be paid and resolved. In the first step, we extracted associations between work orders and
several parameters of the system in big tool logs with, in particular, correlation coefficients. Next, we
explored the problems with critical relationships to obtain valuable knowledge that was not extracted
by the traditional approach. Figure 1 derived the process flow of data mining photolithographic
mechanism
Figure 1: Process flow of Data Mining Photolithographic Mechanism
So, we developed a data mining method of second generation to derive valuable information from
the exposure tool's log data. Through this method, considering the poor correlation between all data,
we can extract strongly correlated parameters effectively and precisely in a specific record group. As a
consequence, we can detect completely undiscovered sources of error that are inherited in the large
amount of data managed by APC in order to make the visibility and inspection method more efficient.
Data mining is an excerpt from tremendous amount and several forms of data by mathematical
techniques from entered knowledge and laws. In consumer research, POS predictive analytics etc.,
various success reports have been documented, but barely any reportages have been reported in
process data analysis such as semi conducers. Using the data mining to manipulate LSI device data
was stated to be not feasible because data records were inadequate even though certain equipment
parameters were usable. The use of the initial approach we have been improving has already made data
extraction technically useful. By collecting vast amounts of buried identifying characteristics and laws
and several forms of data, we will determine the plans or techniques for a more effective and reliable
analysis of data.
By doing logistic regression examination, we can recognize the inspirations of the equipment
situation at any point and the broad variety of parametric wafer results [7]. Moreover, even the
phenomenon arising in unusual circumstances of the devices used in plural periods and under the
2ICACSE 2020 IOP Publishing
Journal of Physics: Conference Series 1964 (2021) 042092 doi:10.1088/1742-6596/1964/4/042092
minimal wafer parametric information are apparent, which has almost been inaccessible before. The
report [8] states that phases of breakdown and appliances were indicated six times as easily as typical
manual procedures. This approach has also been extended to many other sectors, such as the Dave
Hand, Social work student.
2. Related Work
This is one of the most efficient commodity yield and output process steps. The APC system for CD
besides overlay panels has also been implemented. Efficiency and system efficiency have been
improved. Now we look from the point of view of the data again at the condition and the issue of this
method. The outcome was summed up [9].
APC currently uses data from inspection to mix a procedure discrepancy with fluctuation of a
system. This disparity limits its production. But for the commodity lots processed constantly, it is
impossible to distinguish the process unconventionality from the vacillation of the system, considering
the fact that the APC periodically track the machine fluctuations [10]. The result must be better and
more valuable. While big log data were gathered and stored continually by APC, it was not generally
used enough. More valuable knowledge we want to extract. Compared to the current exposure
instrument, the output of the control tool besides the CD tool are very poor [11].
The review data obtained, i.e., the objective limit for traditional information mining, has to be
evaluated in very limited numbers. This reality leads to a low productivity of traditional information
mining since reviewinformation is invaluable as a target limitation. Example of regression tree map
[12], the traditional data mining outcome of regression tree analysis. The aim limitation is yield and
the system numbers in each point are explanatory parameters. In this case we have assumed that the
AM1 otherwise AM2 differential in the ST-A process is the furthermost prevalent of the output,
besides the AM1 output is above AM2. Each lot is split into two classes on the basis of the evaluation
value. In [13] examined about that how the data analysis method of information mining slams into
enormous information investigation with comparative works. The prediction result affirms that [14]
Androidspy can be improved to distinguish vindictive applications by utilizing the framework for
bunch assessing with the previous work. In [15] the method executed a guess mechanized construction
as Filtered Wall (FW) and it separated discarded substance from OSN customer substances
The production of lots handled by AM1 in the ST-A stage is frequently influenced by the
modification in system number CM1 otherwise CM2 in the ST-C stage. The rates of loads processed
by AM2 at the ST-A stage are primarily influenced by the differential BM1 or BM2 system numbers
at the ST-B stage. This regression tree map is obtained afterwards, as identical distinctions are
replicated for the separated classes. Table I is the corresponding table which shows at the particular
stages of each group of lots the relationship between the outputs and the equipment used. It can be
concluded that the more powerful the lots group production occurs on the top layer of the explanatory
parameters.
While the average return by 65 lots is 89%, the lots are split by the used apparatus into a few
categories, so we will immediately figure out what results each divided lot category would produce,
i.e. 65%, 85%, 92% and 98%. The resulting outcomes of these changes are not always obvious. We
may describe as explanatory parameters machine numbers and other category data, for example WET
information and in-process information. The goal parameter such as the yield is appropriate. It should
be stressed.
Judgement of traditional statistics mining and information mining of second group. These 2 kinds
are very distinct in terms of data mining. We need to ex-tract belongings on data review by using log
tool data as we apply traditional information mining to photolithograph data.However, the inspection
data as the aim parameter must be analysed in very limited amounts as inspection data are gathered
and processed in every lot for only specified chips. In addition, the AP C has operated on the basis of
the inspection information from chips besides wafers designated in each lot. It is unworkable to check
all chips in the lot for costs and turnaround times. In general, inspection details on a production line
are not adequate to allow production priority.
3ICACSE 2020 IOP Publishing
Journal of Physics: Conference Series 1964 (2021) 042092 doi:10.1088/1742-6596/1964/4/042092
The new exposure tool has a very high efficiency of up to 100 wafers per hour or more. We may
also capture and store log data through the APC method on a continuous basis. Despite minimal
inspection data, there are a significant number of tool log data. So in view of the above-mentioned
scenario, our generation statistics mining system has been industrialized to easily locate the
correlations buried, and the result is reported [4]. The log information of the introduction tool is
processed by the inspection data as descriptive parameters. The mixture of the limits with associations
greater than a convinced value can be simply detected using explanatory parameters between exposure
tool log data or descriptive parameters in log and inspection information. In general, product yields
and output differences are observed.
A comprehensive factorhas been identified that impact product efficiency and productivity is
therefore important. One of the assessment values for our purposes is the correlation coefficient. It
displays two numeric parameters in contrast to one another. The effect of the shift in one numeric
parameter is quantitatively demonstrated by this value. It is expected to be a positive relationship
where an upward trend is to the right and when we have a downward inclination to the right in a
distributed map there is a negative association. The coefficient of differentiation is 1 to 1. The higher
the complete value, the stronger the association between the 2 number parameters. It's like a clear line
in a dispersion scheme. The scrawnier the correlation is, the lower the completeworth in a dispersion
map. We measure the "R-square" worth, the square worth of the Pearsonconnection as the force.
The R-square value for the relationship between numerical parameters is a basic evaluation value.
Our key method is to measure the R-square worth of variations of variables for all archivesin addition
individual greatest classes in our second-generation data mining process. The mixture of the
limitationsthrough correlations greater than a certain value is easily calculated using primarily
exposure tool log data as explanatory parameters. Efforts high-noise raw instrument log information
that intertwines convolutelysecond-generationinformation mining. This results in the second-
generation data mining with a short noise test outcome, i.e., a parameter ratio that reaches the specified
value with a in height R-square worth.
3. Proposed System
The raw information includes noise from multiple sources also complex interlaces. Uniform if there is
clear association - between two particular limitations, in certain situations, since one parameter is
affected by and may have modified, it seems like there are no significant associations between them.
These secret associations can hardly be readily extracted. Figure 2 elaborates the proposed method
with execution steps
Figure 2: Proposed method Processing steps
Not often does the study of all data create a precise connection of data. However, for a small record
set with low noise we can eliminate the durable correlations which initially occur as high R-square
worth. In data mining of the second generation, all documents are grouped in several record categories
and E n quantities are determined for each document group. We have detailed one of the examples.
4ICACSE 2020 IOP Publishing
Journal of Physics: Conference Series 1964 (2021) 042092 doi:10.1088/1742-6596/1964/4/042092
First, by buying things which exist simultaneously in the register, we compute all Possible sale of
all configurations of parameters listed for all those record classes. We then obtain knowledge where
the R-square value measured is greater than that recommended. Thus, essential connections may be
derived which are buried in enormous data.
Defines the way all documents are subdivided. This paper reveals only two processes. Often
available are other approaches. To assemble one data category, or a set of partitions for all records,
specify a number of records. Specify the number of archives to shape one greatest category besides the
number of record motions to signify the starting point for the next best group. Define the names of the
parameters whose combination values are determined in R-square. If the number of copies for the first
group is ten and for the second album group the number of record movements is five, all records are
split into three records groups.
4. Results and discussions
Our device is eligible for data in XML or csv format. By specifying input data file and divisions
process, we can get research results automatically. When input layer and the division method is PatG1,
it displays a portion of our system's measurement result. It displays information on the correlations for
which the R-square value between three features is greater than specified values. Includes the R-square
value, conjunction and linear assumption tendency, name of parameters, begin & end substantial
number, divided number, sequence number of each record group. Figure 3 discusses about prediction
result of data Mining Photolithographic Mechanism
Figure 3: Prediction Result of Data Mining Photolithographic Mechanism
In order to expose the relationship between tool parameters and inspection data, the tool parameter
corresponding to the log data should be obtained when a large correlations with the inspection data are
observed and one is involved in the phenomenon. The vertical axis shows instrument parameters and
the horizontal plane displays inspection results. It suggests the correlation between all p2-related
inspection results and all p1-related method variables R-square was a low correlation of the magnitude
0.342. Typically, by measuring R-square values for all documents, we determine the relation between
digital specifications. In this case, we conclude there is no clear correlation. But for each database
category that is also separated as described above, we compute the R-square worth. The connection
between the chosen portion of the test data also the parameters of the tool is seen.
The R-square was an astonishing association of 0.88. This was just one indication of how the
exposure tool was improved. We found that the study findings suggest that process variance is isolated
from machinery fluctuation, considering the physical circumstance of the correlation and other factors.
We have thus agreed on the tool system control countermeasure. This stabilised the fluctuation of the
unit. This data is difficult to obtain by traditional methods from large log data and inspection data. One
of the interesting ways to forecast the degradation of precision is the second generation data mining
method.
5. Conclusion
5ICACSE 2020 IOP Publishing
Journal of Physics: Conference Series 1964 (2021) 042092 doi:10.1088/1742-6596/1964/4/042092
A newly discussed method for "Virtual Metrology" is our second generation data mining system. It
balances the absence of actual data in the inspection by using tremendous log data. It derives
variations of descriptive variables which, without a lot of human capital, have an r-square worth
greater than aarranged value. The new method shows what explanatory parameters affect the
production and inspection data of the target parameters, tool results, the most. Enormous amount of
log data is produced and processed in processing and examination software. From these log files, our
data mining system of second generation will retrieve various useful details. We mentioned in this
article the study results of the data kept in our in-house scheme on photolithographic contactapparatus.
The approach is highly fundamental and irrespective of the data type. Our system is appropriate to
semi-directing manufacturing, otherwise other sectors, processes besidesapparatus. So, in the huge
volume of data, you can extract valuable and previously indefinitedata. The analysed process data of
many applications was collected for extended periods and then fused for analysis. Thus, when the
greatest group is self-possessed of just a certain order in a file, a few similarities can be derived. So,
the record collection is rendered in the order of importance of a certain parameter, as seen later the
record is sorted and the value R-square is determined for any record group.
References
[1]. Song, R., Sun, W., Zheng, B., & Zheng, Y. (2014). PRESS: A novel framework of trajectory
compression in road networks. arXiv preprint arXiv:1402.1546.
[2]. Liu, J., Zhao, K., Sommer, P., Shang, S., Kusy, B., & Jurdak, R. (2015, April). Bounded
quadrant system: Error-bounded trajectory compression on the go. In 2015 IEEE 31st
International Conference on Data Engineering (pp. 987-998). IEEE.
[3]. Long, C., Wong, R. C. W., & Jagadish, H. V. (2013). Direction-preserving trajectory
simplification. Proceedings of the VLDB Endowment, 6(10), 949-960.
[4]. Long, C., Wong, R. C. W., & Jagadish, H. V. (2014). Trajectory simplification: On minimizing
the direction-based error. Proceedings of the VLDB Endowment, 8(1), 49-60.
[5]. Cudre-Mauroux, P., Wu, E., & Madden, S. (2010, March). Trajstore: An adaptive storage
system for very large trajectory data sets. In 2010 IEEE 26th International Conference on Data
Engineering (ICDE 2010) (pp. 109-120). IEEE.
[6]. Ranu, S., Deepak, P., Telang, A. D., Deshpande, P., & Raghavan, S. (2015, April). Indexing and
matching trajectories under inconsistent sampling rates. In 2015 IEEE 31st International
Conference on Data Engineering (pp. 999-1010). IEEE.
[7]. Popa, I. S., Zeitouni, K., Oria, V., Barth, D., & Vial, S. (2011). Indexing in-network trajectory
flows. The VLDB Journal, 20(5), 643-669.
[8]. Ni, J., & Ravishankar, C. V. (2007). Indexing spatio-temporal trajectories with efficient
polynomial approximations. IEEE Transactions on Knowledge and Data Engineering, 19(5),
663-678.
[9]. Chen, Z., Shen, H. T., Zhou, X., Zheng, Y., & Xie, X. (2010, June). Searching trajectories by
locations: an efficiency study. In Proceedings of the 2010 ACM SIGMOD International
Conference on Management of data (pp. 255-266).
[10]. Yan, D., Cheng, J., Zhao, Z., & Ng, W. (2015). Efficient location-based search of trajectories
with location importance. Knowledge and Information Systems, 45(1), 215-245.
[11]. Zheng, K., Trajcevski, G., Zhou, X., & Scheuermann, P. (2011, March). Probabilistic range
queries for uncertain trajectories on road networks. In Proceedings of the 14th International
Conference on Extending Database Technology (pp. 283-294).
[12]. Zhan, L., Zhang, Y., Zhang, W., Wang, X., & Lin, X. (2015, October). Range search on
uncertain trajectories. In Proceedings of the 24th ACM International on Conference on
Information and Knowledge Management (pp. 921-930).
[13]. Manjula Pattnaik., & Shahidafridi (2019) Infrastructure of Data Mining Technique with Big
Data Analytics.Journal of MC Square Scientific Research 11(1): 23-30.
6ICACSE 2020 IOP Publishing
Journal of Physics: Conference Series 1964 (2021) 042092 doi:10.1088/1742-6596/1964/4/042092
[14]. Bala Naidu Barani sundram., & Swaminathan M,(2018). Data Mining Based Malicious
Application Detection of Android. Journal of MC Square Scientific Research 10(2) : 8-16
[15]. Prakash, G., Saurav, N., & Kethu, V. R. (2016). An Effective Undesired Content Filtration and
Predictions Framework in Online Social Network. International Journal of Advances in Signal
and Image Sciences, 2(2), 1-8.
7You can also read