The ATLAS EventIndex and its evolution based on Apache Kudu storage
←
→
Page content transcription
If your browser does not render page correctly, please read the page content below
Proceedings of the VIII International Conference "Distributed Computing and Grid-technologies in Science and
                                                                                       Education" (GRID 2018)
                                                                        Dubna, Moscow region, Russia, September 10 - 14, 2018

                                                                The ATLAS EventIndex and its evolution
                                                                    based on Apache Kudu storage
                                                    Dario Barberis1,a, Fedor Prokoshin2,b, Evgeny Alexandrov3,
                                            Igor Alexandrov3, Zbigniew Baranowski4, Luca Canali4, Gancho Dimitrov4,
                                              Alvaro Fernandez Casani5, Elizabeth Gallas6, Carlos Garcia Montoro5,
                                               Santiago Gonzalez de la Hoz5, Julius Hrivnac7, Aleksandr Iakovlev3,
                                              Andrei Kazymov3, Mikhail Mineev3, Grigori Rybkin7, Javier Sanchez5,
                                                  José Salt Cairols5, Petya Vasileva4 and Miguel Villaplana Perez8
                                                                            on behalf of the ATLAS Collaboration
                                                          1
                                                            Università di Genova and INFN, Via Dodecaneso 33, I-16146 Genova, Italy
                                                      2
                                                         Universidad Técnica Federico Santa Maria, 1680, Av. España, Valparaíso, Chile
                                                        3
                                                          Joint Institute for Nuclear Research, Joliot-Curie 6, RU-141980 Dubna, Russia
                                                                             4
                                                                               CERN, CH-1211 Geneva 23, Switzerland
                                             5
                                               Instituto de Física Corpuscular (IFIC), Univ. de Valencia and CSIC, C/Catedrático José Beltrán 2,
                                                                                 ES-46980 Paterna, Valencia, Spain
                                                          6
                                                            University of Oxford, Wellington Square, Oxford OX1 2JD, United Kingdom
                                                              7
                                                                LAL, Université Paris-Sud and CNRS/IN2P3, FR-91898 Orsay, France
                                                            8
                                                               Università di Milano and INFN, Via G. Celoria 16, I-20133 Milano, Italy

                                                                 E-mail: a Dario.Barberis@cern.ch, b Fedor.Prokoshin@cern.ch

                                            The ATLAS experiment produced hundreds of petabytes of data and expects to have one order of
                                            magnitude more in the future. This data are spread among hundreds of computing Grid sites around the
                                            world. The EventIndex catalogues the basic elements of these data: real and simulated events. It provides
ATL-SOFT-PROC-2018-017

                                            the means to select and access event data in the ATLAS distributed storage system, and provides support
                                            for completeness and consistency checks and data overlap studies. The EventIndex employs various
                                            data handling technologies like Hadoop and Oracle databases, and is integrated with other elements of
                                            the ATLAS distributed computing infrastructure, including systems for data, metadata, and production
                         06 November 2018

                                            management (AMI, Rucio and PanDA). The project is in operation since the start of LHC Run 2 in 2015,
                                            and is in permanent development in order to fit the analysis and production demands and follow
                                            technology evolutions. The main data store in Hadoop, based on MapFiles and HBase, can work for the
                                            rest of Run 2 but new solutions are explored for the future. Kudu offers an interesting environment, with
                                            a mixture of BigData and relational database features, which looked promising at the design level and
                                            is now used to build a prototype to measure the scaling capabilities as a function of data input rates, total
                                            data volumes and data query and retrieval rates. An extension of the EventIndex functionalities to
                                            support the concept of Virtual Datasets produced additional requirements that are tested on the same
                                            Kudu prototype, in order to estimate the system performance and response times for different internal
                                            data organisations. This paper reports on the current system performance and on the first measurements
                                            of the new prototype based on Kudu.

                                            Keywords: Scientific computing, BigData, Hadoop, Apache Kudu, EventIndex
                                                                 © 2018 Copyright CERN for the benefit of the ATLAS Collaboration. CC-BY-4.0 license.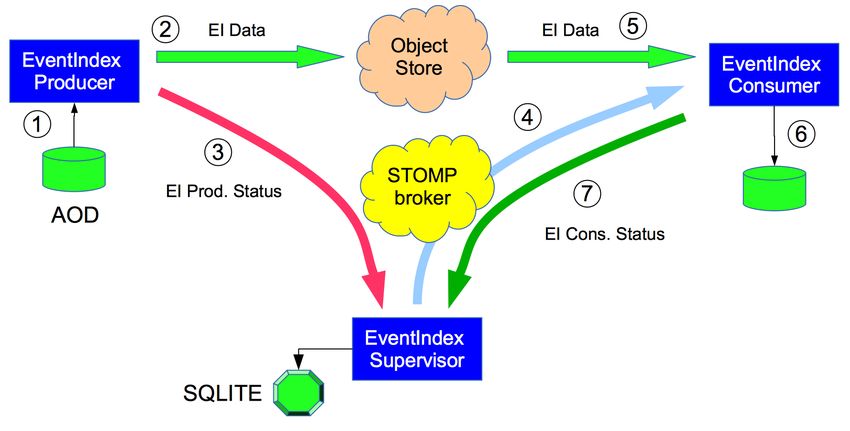
Proceedings of the VIII International Conference "Distributed Computing and Grid-technologies in Science and
Education" (GRID 2018)
Dubna, Moscow region, Russia, September 10 - 14, 2018
1. Introduction
When software developments started for the ATLAS experiment [1] at the Large Hadron
Collider (LHC) and all other similar experiments about 20 years ago, the generic word "database"
practically referred only to relational databases, with very few exceptions. The ATLAS EventIndex [2]
is the first application that was entirely developed having in mind the usage of modern structured storage
systems as back-end instead of a traditional relational database. The design started in late 2012 and the
system was in production at the start of LHC Run 2 in Spring 2015.
The EventIndex is a system designed to be a complete catalogue of ATLAS events, including
all real and simulated data. Its main use cases are event picking (find and give me “this” event in “that”
format and processing version), counting and selecting events based on trigger decisions, production
completeness and consistency checks (data corruption, missing and/or duplicated events) and trigger
chain and derivation overlap counting. It contains for each event record the event identifiers (run and
event numbers, trigger stream, luminosity block, bunch crossing number), trigger decisions and
references (GUID [3] of the file with this event plus the internal pointer) to the events at each processing
stage in all permanent files generated by central productions.
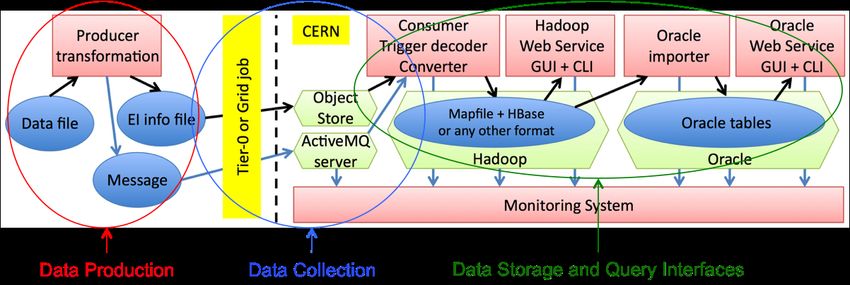
Figure 1: EventIndex architecture and data flow.
2. EventIndex architecture and operations during LHC Run 2
The EventIndex has a partitioned architecture following the data flow, sketched in Figure 1. The
Data Production component extracts event metadata from files produced on ATLAS resources at CERN
or world-wide on the LHC Computing Grid (WLCG [4]). For real data, all datasets containing events in
AOD format (Analysis Object Data, i.e. the reconstruction outputs) and some of the datasets in DAOD
format (Derived AODs, i.e. selected events with reduced information for specific analyses) are indexed;
as there are many DAOD formats, they are indexed only on demand of the production managers
involved. Indexing information extracted from AOD datasets contains also the references to the
corresponding raw data, so it is subsequently possible to extract events in RAW data format too. For
simulated data, all event generator outputs are indexed, as well as all datasets in AOD and some of those
in DAOD formats, similarly to real data.
As soon as a production task is completed and its output dataset is registered in the ATLAS
Metadata Interface database (AMI, [5]), the corresponding indexing task is launched automatically, on
CERN Tier-0 resources for the data produced there, and on the WLCG for datasets produced on the
Grid. Each job runs on one or more input files and extracts the EventIndex information for all events,
which is packed into small files that are transferred to the CERN Object Store [6]. Over 7.4 million
indexing jobs were run since 2015, 1.9 million of which only during the last year, with a very low
number of failures. As indexing jobs are the first jobs run on data files just after they are produced, they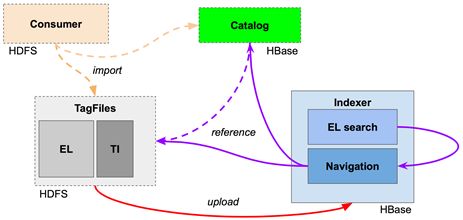
Proceedings of the VIII International Conference "Distributed Computing and Grid-technologies in Science and
                                           Education" (GRID 2018)
                            Dubna, Moscow region, Russia, September 10 - 14, 2018

check data integrity immediately. Occasionally jobs fail for transient site problems, usually fixed by
retries at the same or another site, or for corrupted data files, which are then discarded and reproduced.
         The Data Collection system [7] transfers EventIndex information from the production sites to
the central servers at CERN; the bulk of the information is sent to the Object Store, and the ActiveMQ
messaging system is used to inform the Data Collection Supervisor, a process that oversees all
EventIndex data transfer operations, of the data location in the Object Store. When all files of a given
dataset have been indexed and the corresponding information is available in the Object Store, the
Supervisor informs the Consumer processes, which also run in servers at CERN, to fetch the EventIndex
data for that dataset from the Object Store, check them for integrity, completeness (all events are there)
and duplicates (each event is there only once), format them into a single file and store the file in the
Hadoop [8] cluster at CERN. Figure 2 shows the data flow and messaging system usage between the
Producer processes extracting indexing information from event data files, the Supervisor process and
the Consumer processes packing the information for the Hadoop store.

       Figure 2: EventIndex Data Collection flow from distributed jobs to the central Hadoop store.

        The Data Storage units provide permanent storage for EventIndex data and fast access for the
most common queries, plus finite-time response for complex queries. The full information is stored in
Hadoop in compressed MapFile format [9], one file per dataset; an internal catalogue in HBase [10] (the
relational database of the Hadoop system) keeps track of the status of each dataset and holds dataset
metadata, such as the number of events, the data format and other global information. The trigger
decision record, a bit mask for each event, is also stored in Hadoop but in decoded format, in order to
speed up searches and other trigger-related operations [11]. All event records are also inserted into an
HBase table, used for fast event lookup for the event picking use case. Lookup in HBase is faster than
in Hadoop MapFiles as it consists in a direct access to the HBase relational table instead of firing up a
MapReduce job. Figure 3 shows schematically the data import flow within the Hadoop system. At the
time of writing the Hadoop system stores almost 200 billion event records, using 21 TB for real data
and 5 TB for simulated data, plus the auxiliary data (input and transient data and archive).
         Client code provides access to the Hadoop store. A command-line interface (CLI) provides
access to all information in Hadoop. One can search events filtering on any of the event properties with
the generic “ei” command and retrieve the full records or parts of them, or just count the events that
satisfy the query; the results will come back in real time for quick queries or will be stored and a link
will be sent by email for more complex queries. The “el” command queries the HBase tables to return
the event location (GUID of the file and internal pointer) of all events satisfying the search criteria. With
the “ti” command users can access the trigger tables, count events by trigger for a giver run and create
Proceedings of the VIII International Conference "Distributed Computing and Grid-technologies in Science and
Education" (GRID 2018)
Dubna, Moscow region, Russia, September 10 - 14, 2018
and visualise the tables of trigger overlaps for all active triggers or for subsets of them (for example, all
high-level triggers involving muons). A graphical interface (GUI) is also available to help users to
formulate correct and coherent queries and display relations and correlations between selected datasets.
Figure 3: Data import flow within the central Hadoop store.
Real data records, without the trigger information that constitutes most of the data volume, are
also copied to an Oracle database. The relational features of Oracle allow connecting the dataset
metadata derived from the EventIndex with other metadata derived from the Run and Conditions
databases, which are also stored in the same Oracle cluster, providing added value to this information.
Oracle is also much faster in event lookup operations, once the data schema has been well designed [12].
The main data tables storing EventIndex
information in Oracle are depicted in Figure 4. In Oracle
we currently have over 150 billion event records, stored
in a table of 2.7 TB with 2.4 TB of index space.
A powerful GUI provides access to the
EventIndex information in Oracle. Users can provide
search filters, connect to other Oracle information, check
for duplicate events and also display the overlaps
between derived datasets. The derivation overlap counts
are executed a few times per year to keep data duplication
on disk at a minimum.
Functional tests of the event picking
functionality, the primary use case, are executed
automatically twice per week. A random set of events is
selected out of those that were recently imported, plus a
Figure 4: EventIndex data tables in the
random set of older events; event lookup and picking
Oracle store. jobs are then launched to make sure that all components
keep working properly.
A monitoring system keeps track of the health of the servers and the data flow, providing a
visualisation of the system status and of the amount of stored data, as well as displaying the status of the
functional tests. Its first implementation using ElasticSearch [13] and Kibana [14] has been replaced
recently by a much better version using InfluxDB [15] to store the data and Grafana [16] to display them
[17].Proceedings of the VIII International Conference "Distributed Computing and Grid-technologies in Science and
Education" (GRID 2018)
Dubna, Moscow region, Russia, September 10 - 14, 2018
3. EventIndex evolution towards LHC Run 3
The current EventIndex was designed in 2012-2013 selecting the best BigData technology
available at that time (Hadoop), then implemented in 2014 using MapFiles and HBase, and is in
operation since 2015 with satisfactory results. The use cases extended in the meantime from event
picking and production completeness checks to trigger overlap studies, duplicate event detection and
derivation streams (offline triggers) overlaps. The fast data querying based on a traditional relational
database technology (Oracle) involving only a subset of information for real events is no longer
sufficient to cover all requests, and in addition the event rate increased steadily throughout Run 2 beyond
the initial expectation. The BigData technologies advanced in the meantime and now we have many
different products and options to choose from.
An active R&D programme to explore different, and possibly better performing, data store
formats in Hadoop was started in 2016. The "pure HBase" approach (database organized in columns of
key-value pairs) was one of the original options on the table in 2013, but was not selected because of its
poor parallelism that made the performance degrade when data volumes increase; it is more promising
now as it shows good performance for event picking but not for all other use cases. The Avro [18] and
Parquet [19] data formats have been explored, with tests on full 2015 real data, and also look promising
[20]. Kudu [21] is a new technology in the Hadoop ecosystem, implementing a new column-oriented
storage layer that complements HDFS and HBase. Data ingestion and query scanning are distributed
among the servers holding the data partitions, thereby decreasing substantially the time taken by each
operation. Kudu appears to be more flexible to address a wider variety of use cases, in particular as it
is addressable also through SQL queries, placing it midway between Oracle and the NoSQL world; tests
continued since then and show promising results [20].
Possible benefits of using Kudu for the EventIndex are the unification of storage for all use cases
(random access and large-scale analytics) and the fact that related data (through reprocessings) will sit
close to each other on disk, reducing redundancies and improving navigation. With Kudu we can also
reduce the ingestion latency by the removal of multi-staged data loading into HDFS, enable in-place
data mutation, enable common analytic interfaces like Spark and Impala, and finally improve the random
lookup and analytics performance.
Figures 5 to 7 show the performance measurements of the current Kudu prototype [22]. The
Kudu cluster used for these tests at CERN consisted of 12 machines with 2x8 cores, 2.60 GHz clock, 64
GB of RAM and 48 SAS drives; data were imported from the current EventIndex implementation in
Hadoop. Figure 5 shows the time taken to import a typically large dataset, consisting of 100 million
event records (over one day of continuous data taking), as function of the number of parallel threads
used. The average writing speed was 5 kHz per thread, with a maximum overall writing speed into the
Kudu cluster of 120 kHz, which is over 10 times the current need and promises well for the future when
data-taking, processing and simulation production rates will increase.
Searching and retrieving information for a few thousand event records from the several tens of
billions in storage is a relevant use case that stretched the current EventIndex implementation in Hadoop
when it was first proposed in 2015. Figure 6 shows the time needed to retrieve just the event location
information (GUID) or the full record, the first time and when the result is already in the Kudu cache,
as function of the number of parallel threads used. As expected the execution time is higher when the
results are not in the cache, but retrieval rates of over 400 records per second have been achieved for the
worst-case test and 64 active threads.
Studying the overlaps and correlations between related triggers within a run is important to
optimise the trigger menus and make sure that all interesting events are collected, as well as minimising
the backgrounds. The same run with 100 million event records was used to test this use case in Kudu;
the results in Figure 7 show that it is now possible to run this tool routinely as it takes only 20 minutes
to compute all this information from the thousands of possible trigger chains (millions of correlations)
active for each event. Most of the time is spent in the computation and not in data access, which is very
good as it shows that the storage technology is not a bottleneck for this application.Proceedings of the VIII International Conference "Distributed Computing and Grid-technologies in Science and
Education" (GRID 2018)
Dubna, Moscow region, Russia, September 10 - 14, 2018
Figure 5: Kudu tests: time to import a dataset of 100M event records
as function of the number of parallel threads [22].
Figure 6: Kudu tests: time to find and retrieve 8000 event records
as function of the number of parallel threads [22].
Time to compute trigger correlations for 100M of events
1000000
Computing time [s]
100000 Storage access time [s]
189376
Elapsed time [s]
10000 90848
45408
22704
14232
1000
5674
3196
1717
100
2624
1312
672
336
10 168
86
44
23
1
1 2 4 8 16 32 64 128
Number of parallel threads used
Figure 7: Kudu tests: time to compute trigger correlations within a dataset with 100M event records
as function of the number of parallel threads [22].Proceedings of the VIII International Conference "Distributed Computing and Grid-technologies in Science and
Education" (GRID 2018)
Dubna, Moscow region, Russia, September 10 - 14, 2018
Complementary tests were run at IFIC in Valencia (Spain) [7]. That cluster is composed of 5
machines with 2 x Xeon E5-2690 CPU, and 256 GB of memory each. There are 8 x 6 TB data hard disk
per machine configured as one big Raid10 disk to store tablets, summing up 22 TB per machine to a
total of 88 TB of storage. The write ahead log is located in the extra NVMe SSD of 1.5 TB per machine
to improve the performance of the write operations. The current Kudu configuration uses one of these
machines as master, and the other four as tablet servers. Two types of tests were run: on trigger record
compression formats and on the ingestion rates for different internal data organization schemas.
Compressing the trigger records is important for the data sizes but the compression must be
transparent for the tools reading this information efficiently. It was found that the best ratio of bytes per
event is obtained with the “bitshuffle” encoding [23], which rearranges the bits for achieving better
compression ratios relying on neighbouring elements. In addition, for our trigger use case there are
usually many bits that are 0, i.e. not signal. In this case we do not explicitly set them to 0, but leave the
field as null as much as possible. Then we apply a compression algorithm, with LZ4 [24] being the best
option for this kind of bit shuffle encoding. In the end all trigger information occupies only 60 and 15
bytes/event for Level-1 and High-Level Triggers respectively.
The data ingestion tests run in Valencia measured the write performance for different data
schemas. Schemas with partitions based on quantities that distribute the incoming events evenly across
partitions provide the best performance, with ingestion rates between 5 and 6 kHz, in the same range as
for the CERN tests. The Consumer spends 1% of the time waiting for data from the Object Store, then
4% of the time parsing and converting the input data; the insertion phase into Kudu client buffers is
roughly 23% of the time, with the last flush phase taking the bulk of the time (72%).
4. Conclusions
The EventIndex project started in 2012 at the end of LHC Run 1, driven by the need of having
a functional event picking system for ATLAS data. The data storage and search technology selected in
the first phase of the project (Hadoop MapFiles and HBase, in 2013-2014) was the most advanced
available at that time in the fast-growing field of BigData; indeed after a couple of initial hiccups it
proved reliable and performed satisfactorily. Part of the data are replicated also to Oracle for faster
access but mainly to have a uniform environment between event and dataset metadata. Nevertheless the
current implementation of the EventIndex started showing scalability issues as the amount of stored data
increased in the last couple of years: slower queries, lots of storage (compression helped of course).
Kudu looks like a very promising solution that can carry the EventIndex through Run 3 (2021-
2024), with faster data injection and queries, the possibility of using analytics tools, and the
compatibility with SQL queries for the connections to other information in relational databases. The
ATLAS plan is to finalise the schemas by the end of 2018 and then upload all Run 1 and Run 2 data
from the Hadoop EventIndex and run Hadoop and Kudu in parallel until we are satisfied with the
performance in terms of speed, ease of use and system stability. If all goes well, by the end of 2019 we
will be able to run only Kudu and decommission the Hadoop infrastructure for the EventIndex.Proceedings of the VIII International Conference "Distributed Computing and Grid-technologies in Science and
Education" (GRID 2018)
Dubna, Moscow region, Russia, September 10 - 14, 2018
References
[1] ATLAS Collaboration 2008 The ATLAS Experiment at the CERN Large Hadron Collider,
JINST 3 S08003 doi:10.1088/1748-0221/3/08/S08003
[2] Barberis D et al 2015 The ATLAS EventIndex: architecture, design choices, deployment and
first operation experience, J. Phys.: Conf. Ser. 664 042003, doi:10.1088/1742-
6596/664/4/042003
[3] GUID: Global Unique IDentifier, https://en.wikipedia.org/wiki/Universally_unique_identifier
[4] Bird I et al 2005 LHC Computing Grid Technical Design Report, CERN-LHCC-2005-024,
http://lcg.web.cern.ch/LCG/tdr
[5] Albrand S. 2010 The ATLAS metadata interface, J. Phys. Conf. Ser. 219 042030,
doi:10.1088/1742-6596/219/4/042030
[6] Sánchez J et al 2015 Distributed Data Collection for the ATLAS EventIndex, J. Phys.: Conf.
Ser. 664 042046, doi:10.1088/1742-6596/664/4/042046
[7] Fernandez Casani A et al 2018 Distributed Data Collection for the Next Generation ATLAS
EventIndex Project, to be published in the Proceedings of the 23rd International Conference on
Computing in High-Energy and Nuclear Physics, Sofia (Bulgaria) July 2018.
[8] Hadoop and associated tools: http://hadoop.apache.org
[9] Favareto A et al. 2016 Use of the Hadoop structured storage tools for the ATLAS EventIndex
event catalogue, Phys. Part. Nuclei Lett. 13: 621, doi:10.1134/S1547477116050198
[10] HBase: https://hbase.apache.org
[11] Mineev M et al. 2018 Trigger information data flow for the ATLAS EventIndex, these
proceedings.
[12] Gallas E J et al. 2017 An Oracle-based Event Index for ATLAS, J. Phys.: Conf. Ser. 898
042033, doi:10.1088/1742-6596/898/4/042033
[13] ElasticSearch and Kibana: https://www.elastic.co
[14] Barberis D et al. 2016 ATLAS Eventlndex monitoring system using the Kibana analytics and
visualization platform, J. Phys.: Conf. Ser. 762 012004, doi:10.1088/1742-6596/762/1/012004
[15] InfluxDB: https://www.influxdata.com
[16] Grafana: https://grafana.com
[17] Alexandrov E et al. 2018 BigData tools for the monitoring of the ATLAS EventIndex, these
proceedings.
[18] Avro: https://avro.apache.org
[19] Parquet: http://parquet.apache.org
[20] Baranowski Z et al. 2017 A study of data representation in Hadoop to optimise data storage
and search performance for the ATLAS EventIndex, J. Phys.: Conf. Ser. 898 062020,
doi:10.1088/1742-6596/898/6/062020
[21] Kudu: http://kudu.apache.org
[22] Baranowski Z et al. 2018 Kudu prototypes for the ATLAS EventIndex, to be published in the
Proceedings of the 23rd International Conference in Computing in High-Energy and Nuclear
Physics, Sofia (Bulgaria) July 2018.
[23] Masui K et al. 2015 A compression scheme for radio data in high performance computing,
Astronomy and Computing 12 181–190, doi: 10.1016/j.ascom.2015.07.002
[24] LZ4: https://en.wikipedia.org/wiki/LZ4_(compression_algorithm)You can also read