Developing a Smart Telemetry Feedback System for Sim Racing
←
→
Page content transcription
If your browser does not render page correctly, please read the page content below
Developing a Smart Telemetry Feedback System for
                            Sim Racing
                                                                  Daan Assies
                                                          University of Twente
                                                     PO Box 217, 7500 AE Enschede
                                                            the Netherlands
                                                     d.assies@student.utwente.nl

ABSTRACT                                                                    In car racing, the remote points are hundreds of sensors attached
With the field of esports and sim racing becoming more popular,             to the car [11].
the question of how to become the best driver arises. Current
                                                                            These include, but are not limited to, temperature sensors of the
answers to that question lack several elements. This study aims
                                                                            engine, gearbox oil and brakes, positions of the ride height, wheel
to make up for the lack of public research and accessibility
                                                                            speeds, and some rigorous ones like RPM (revolutions per
because professional teams keep research to themselves or need
                                                                            minute), impact measurements and GPS [11].
too many people analysing data, as well as contributing to the
initial development of a feedback system that fosters the                   Formula One teams build very elaborate simulators on which
performance improvement of sim racing drivers. This initial                 they can tune their setup and learn each track [12]. Converting
development is taking shape through interviews with sim racers              this to sim racing, on any of the many simulation games, is
and the creation of a data collection tool that is used to see how          difficult. Firstly, the games are limited in possibilities to what is
this data can be efficiently stored and used. The conclusion is             possible outside the games. There is less data available and
comprised of a preliminary dashboard as a feedback system                   collecting it may be dependent on how accessible the game is.
which is deemed more useful to sim racers as current feedback               Another problem, which is what this paper will focus on, is that
systems in place.                                                           data collected and shown in Formula One needs experts to be
                                                                            analysed, and each team has hundreds of people working on data
Keywords                                                                    analysis [11]. Having such a team is far from comparable to sim
esports, sim racing, feedback system, telemetry data, simulator,            racing, in which drivers most commonly coach themselves.
dashboard, telemetry-based feedback system                                  Therefore, the problem becomes: How does a sim racer foster
                                                                            improvement?
1.         INTRODUCTION
In the past few years, esports has seen significant growth [5]              There have been several studies on the physiological aspects of
Competitions with millions of dollars in prize money are being              sim racing and how to make sure the driver can be at their best
organized, and some esports are being recognized as a real sport            e.g., [4], [8]. In both studies, eye gazing is used, together with lap
[6]. To support the growth esports has seen, the 2021 Olympics              times set around a circuit, as a metric to how good a driver is. In
will be hosting official esports events.1 One of the esports events         these papers, telemetry and game data is not used – other metrics
is a racing event, showing the significance of racing on virtual            – to support their research. There have been several papers that
simulators (hereafter called sim racing). Not only the Olympic              have created their own simulation and gathered data from this for
Committee but also an influx of Formula One drivers have                    their research purposes [1], [4], [8], [10]. However, these are not
influenced the mainstream status of sim racing [10]. The goal in            suitable for a ‘professional gamer’ or someone who want to
sim racing, just like in any sports events, is winning. Just like in        improve their driving but do not have the capabilities to race in a
Formula One racing, which is arguably the most advanced car                 custom simulator. In race car driving, telemetry data is a valuable
racing competition, for sim racing competitors (sim racers) to              source of information. Used by both coaches and drivers, it is
drive as fast as possible, data analysis is used. A part of the data        directed to strategically build up a race and foster driver training
used for this data analysis is the use of telemetry data [4].               and development. Developing a feedback system using this
Telemetry data are measurements at remote points that are                   telemetry not on physiological levels but on game metrics fill the
automatically transmitted to other points for monitoring.                   gaps in such a way that this feedback system and the data it uses
                                                                            can be used for other research in this area as well. Like physical
Permission to make digital or hard copies of all or part of this work for   racing, this data also is valuable for sim-racing. However, despite
personal or classroom use is granted without fee provided that copies are   the relevance, the application to sim racing has not been
not made or distributed for profit or commercial advantage and that
copies bear this notice and the full citation on the first page. To copy    explored.
otherwise, or republish, to post on servers or to redistribute to lists,
requires prior specific permission and/or a fee.                            This research is aimed at exploring and extracting an initial
35th Twente Student Conference on IT, July. 2 , 2021, Enschede, The
                                                nd                          design of a smart telemetry feedback system that gives an
Netherlands. Copyright 2021, University of Twente, Faculty of Electrical    automated analysis comparable to the analysis done in
Engineering, Mathematics and Computer Science.                              professional Formula One teams. This feedback system can be

     1
      https://olympics.com/ioc/news/international-olympic-
     committee-makes-landmark-move-into-virtual-sports-by-
     announcing-first-ever-olympic-virtual-series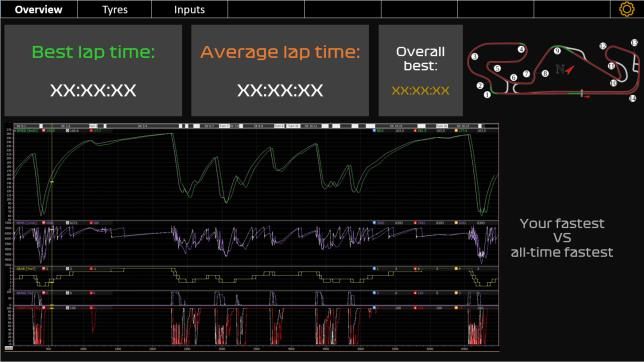
used in training as well as real-time sim-racing conditions. This        Firstly, a special software environment TeAR was created. This
aim is guided by the following research questions:                       software does not map to accessible software and is therefore not
                                                                         useful to the public. Secondly, the paper focuses on whether the
RQ1: What are the non-functional requirements for a telemetry-           metrics of serious gaming can be applied to sim racing, rather
   based feedback system?                                                than what the best way for drivers to improve is. Thirdly, the
RQ2: What are the functional requirements for a telemetry-based          feedback created was limited to audio cues when the driver did
   feedback system?                                                      something wrong on track when it comes to race lines or braking.
RQ3: When applied to a sim racing environment, how can the
   use of the system by the driver, or the coach, foster                 Research into the calculation of the optimum racing line to obtain
   performance improvement?                                              the lowest lap time was conducted by Braghin et al. [1]. This
                                                                         research is relevant for modelling a new race car that can follow
These questions are answered through user interviews, designing          this optimum racing line. The driving of and reaching this
a data collection tool in an accessible sim racing game, and             optimum racing line can also be mapped onto driver inputs.
creating a basic, preliminary feedback system using data analysis        Braghin et al. discusses and identifies driver inputs, summing
on data gathered from sim racers.                                        them up into numerical results to get to the ideal racing line.
                                                                         Calculations of the ideal racing line are out of the scope of this
2.         STATE OF THE ART                                              research but with research being done relating to the ideal racing
To understand how a can feedback system can contribute to the            line, a feedback system that can indicate how to reach the ideal
state of the art, some aspects of sim racing, as well as existing        racing line is relevant as well.
solutions will be discussed.

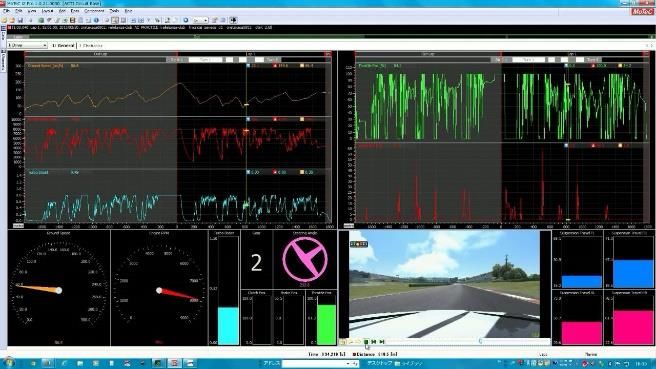
Firstly, there are a lot of dashboards available as shown in Figure
                                                                         3.        METHODS
                                                                         In this section, the phases of the design process will be discussed.
1. These dashboards take game data and present them in graphs.
                                                                         Two main methods are used. First, interviews with sim racers are
These dashboards are used aplenty by drivers and are commonly
                                                                         held and throughout the research, a data collection tool was
available on forums of racing games. These graphs can be
                                                                         developed to help develop an initial feedback system design as
difficult to comprehend and do not show clear information. These
                                                                         well as validate that the feedback system works.
graphs are at a level that professional teams use and are not
suitable for individual sim racers [11]. As stated in the
introduction, this research tries to achieve the opposite, which is
                                                                         3.1       Interviews
                                                                         To get an initial idea of the needs of sim racers and how they
to give drivers feedback in the clearest way possible, to foster
                                                                         think they can improve best using a feedback system, a semi-
driver improvement.
                                                                         structured interview was held. The sim racers that were
                                                                         interviewed are a part of Esports Team Twente (ETT) and
                                                                         represent ETT in several competitions.

                                                                         3.1.1     Participants
                                                                         The people represented in the interviews can be split up into
                                                                         different participant categories, ranking the sim racers from
                                                                         novice to veterans. The distinction between these categories is
                                                                         made because there is a big correlation between the driver level
                                                                         and perception to feedback, as well as general skill level [1], [7].
                                                                         The characteristics of each rank can be found in Table 1.

                                                                         Five interviews were conducted. People with different
Figure 1: Modern solution of showing telemetry data.                     experience levels were chosen because of the difference in how
                                                                         they would perceive feedback. This perception of feedback can
There is currently but one paper on feedback systems to improve          be applied to both sim racing and driving, once again illustrating
one’s driving, by Bugeja et al. [3]. In the research by Bugeja et        the difference in driver levels [1]. In total one novice driver, two
al., a telemetry assisted racing software was created in which           moderately experienced and two veterans were interviewed. The
drivers get feedback through audio cues. There are a few                 interviews consisted of several components, splitting the
shortcomings in this paper when it comes to this research’s goals.       interview into separate parts for better analysis.

 Driver Level                       Experience         Improvement                                    Driving
 Novice                             < 2 years          Among several areas                            Drive casually
 Moderately experienced             2-3 years          Know how to improve themselves                 Drive competitively
 Veteran                            3+ years           On detail level                                At the peak of performance
Table 1: Interview participant categories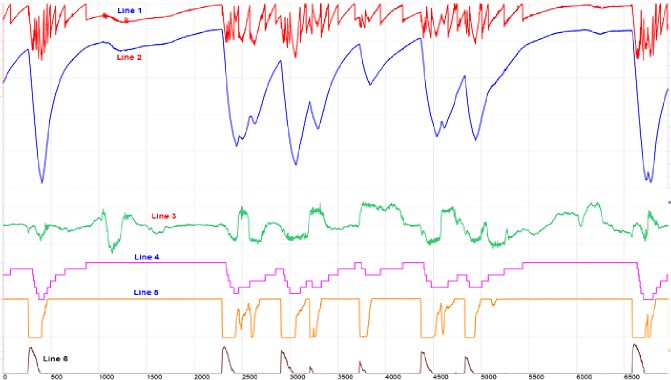
3.1.2      Procedure                                                   After the considerations of what data to gather were complete,
First, the interviewees were told about the plans of developing        the functions to gather them from the API were implemented. To
this feedback system and that the goal is to have the system help      test the functions, a live dashboard was used to check the validity
them improve their driving. After that, data that can be collected     of the functions. After all the functions needed for further
is presented to the interviewees (A. Data available from Assetto       analysis were deemed valid, the data needed to be gathered rather
Corsa) to give them an understanding of what will be possible to       than being shown in a live display. To do this, separate files are
give them feedback on. If they did not know what telemetry data        created while driving in which the data is stored in JSON
was and what it is used for, it was explained to them carefully.       libraries. These files contain separate libraries, with data being
                                                                       split up into three categories: input, car data and lap data. This
After that, a series of questions were posed. These questions were     distinction is created to make traversing and accessing the data
aimed at understanding what the interviewees use to improve            easier.
their driving, and what they think they can improve on most.
Finally, the interviewees were shown a telemetry graph and were        The data gathering tool is used as a basis for further
asked to recognize each telemetry trace for what they are. This        implementation during this research. With the data collected,
last part is most useful to understand what the level of knowledge     graphs can be made like the one seen in Figure 3 and comparisons
is between the driver levels and whether this difference of            can be made between laps you have driven yourself and compare
knowledge needs to be considered to make sure the feedback             yourself with other people if the data gets stored remotely.
system is comprehendible by any sim racer.

3.2       Data collection tool2
To answer RQ3, data is needed. This data can be used to create
a preliminary feedback system and confirm that drivers who use
this feedback system improve their driving, thus answering RQ3.
Because this is such an important part of this research, a separate
section will be dedicated to the creation of this.

3.3       Testing
In order to test whether the preliminary feedback system that will
be built satisfy RQ3, making sure drivers can improve using the
feedback system, the preliminary feedback system will be tested
against a feedback system based on current solutions.                  Figure 2: Telemetry traces used in Formula One.

4.        DATA GATHERING TOOL                                          5.          RESULTS
For the creation of the data collection tool, Assetto Corsa3 is        In this section, the results of the user interviews are portrayed in
used. Assetto Corsa is very accessible as a game since they have       the form of system requirements, answering RQ1 and RQ2. as
a lot of users, which serves as a better platform than a custom        well as the results of the implementation for data collection.
simulator. As well as being accessible, Assetto Corsa has a data-
collection infrastructure, as well as a refresh rate of 90 per         Firstly, system requirements are made based on shortcomings of
second, meaning you can gather data practically live. They have        relevant research. Namely, the inaccessibility of the simulation
an API in python version 3.3.5 with which you can capture data         software, the lack of focus on driver improvement and the limited
in real-time. There is a very big list of data points available,       feedback given to the participants. Converting these
which means that feedback can be given in many areas.                  shortcomings into requirements relevant for this research would
                                                                       result        in        the        following       requirements.
To start the development of this data gathering tool, a list was       REQ: The feedback system should be open source, making it
created in which all the data points of Assetto Corsa were written     accessible.
down. Since there is no official documentation of the API, noting      REQ: The feedback system is to foster driver improvement.
down the data points is an essential part to keep an overview. A       REQ: The feedback system is to give feedback on as many
decision on which data points were deemed useful was made and          aspects of racing as possible.
the functions to go with the collection of these were implemented
(A. Data available from Assetto Corsa). This decision was driven       As mentioned in the state-of-the-art section, in previous research,
by several aspects. Firstly, essential points like driver inputs and   feedback was limited to audio cues while driving. In contrast to
car speed were included since these dictate how the car handles        the feedback being given live, the conclusion from interviews
and measure how fast it is going. Secondly, inspiration was taken      held is that sim racers prefer their feedback to be given non-live.
from real-life data traces like those used in Formula One, which       In line with what is being used nowadays, like in Figure 1, a
can be seen in Figure 2, and which data points are shown to the        dashboard deems useful, which can also be formed as a
public. This results in using data points for lap times, gears and     requirement.
brake temperatures which are essential for running the car.            REQ: The feedback system is to be shaped in the form of a
Lastly, some details are added for the veteran drivers to bow          dashboard.
down over in the form of tyre details as well as aero drag.

2                                                                      3
    https://github.com/DaanAssies/AC_data_gathering_tool                   https://www.assettocorsa.it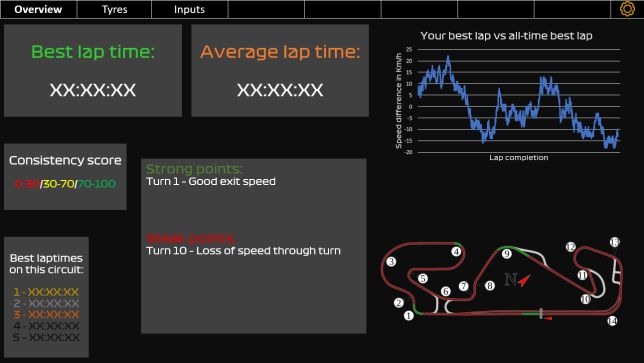
Secondly, analysis and comparisons between the questions
answered and the correlation between the driver levels were
done. The way the drivers practice for upcoming races or just to
improve themselves differ. The novice driver drives around a lot,
sometimes repeating certain sections of a track to improve e.g., a
certain turn. In contrast to this, more experienced drivers tend to
look to other people to compare themselves to, which helps them
understand how turns can maybe be taken differently or where
other drivers win time in braking or traction zones. This all
combined with practising, since, to quote one of the interviewees,
“practice makes perfect”. To put this in concrete results, novice
drivers may think they need more practising compared to more
experienced drivers who take away from other experienced
drivers. When creating feedback, the driver level should be
considered, since they might need either comparing or general
feedback. Converting this into a requirement would be that this
feedback system needs to be user-friendly and understandable           Figure 3: Speed trace from data collection tool.
when used by any person from each of the three driver levels.
REQ: The feedback system must be able to be used by drivers of         Combining the results from the interviews and data collection
any experience level.                                                  tool, a preliminary dashboard was built in the same python
                                                                       project. This dashboard is focused on comparing the driver to
A theme that came up in every single interview was comparing           laps that are driven faster than what they have done. The
data. Two of the interviewees uses a feedback system that simply       dashboard also shows information, rather than data, in the form
shows while driving whether you are faster or slower than their        of strong and weak points, to show how they are either doing well
current fastest lap and two others watch other people drive to         or how they can improve. This information can be gathered from
compare themselves with through videos and replays. Two of the         the data collection tool, but still needs analysing.
interviewees also commented that both positive and negative
feedback is useful. This way they know on what part of the race
circuit they do well, and on which part they can improve. In
conclusion, comparing data and watching other people drive was
a recurring theme over the interviews and needs to be a key part
of the feedback system. The way this will be incorporated is that
lap data is saved and used for comparison to the targeted driver.
If the system then detects that, for example, the current driver
loses time in a turn by braking too early compared to someone
else,    the    system    will give       that   as    feedback.
REQ: As a driver, I want to compare myself to other people.
REQ: As a driver, I want to get positive and negative feedback.

In the interviews, it also became apparent that current solutions      Figure 4: Feedback system design based on research.
are not suitable for them. After asking if they can recognize
telemetry trace graphs from Figure 2 for what they represent –         6.        VERIFICATION
engine RPM (Revolutions per Minute), speed, steering input,            In order to verify that drivers think this new feedback system is
gear choice, gas input and brake input – only the sim racers from      useful, which will be used in answering RQ3, a survey was
the veteran driver-category could recognize the traces for what        created to compare between two dashboards. In this survey, the
they are, and what the use of them is. With the requirement of the     driver’s experience and the preference of dashboard to be used
feedback system being able to be interpreted by drivers of any         was asked. This way, it can be verified that drivers of all
level set in mind, the use of such telemetry graphs is not feasible.   experience levels think they can improve faster using the
Rather than showing data like in these graphs, showing and             dashboard designed based on this research (Figure 4) or using the
giving information that is based on data is more suitable.             dashboard based on current solutions (Figure 5). The results of
REQ: The feedback system is to display information that can be         this survey can be seen in Table 2. From these results, it can be
well interpreted by sim racers.                                        concluded that the new feedback system design is
                                                                       overwhelmingly more popular, with an average of 66 per cent of
With the specially built data gathering tool, from which the data      the people from each experience category preferring the feedback
collected will be used for data analysis and giving feedback,          dashboard designed based on this research, where the responders
graphs can be made like the one in Figure 3. These graphs are not      assume they can improve faster using the said dashboard.
necessarily useful when used alone like discussed above, but they
can be used for comparison when combined with the graph of              Driver experience Figure 4                  Figure 5
another driver, which is also done in some comparison tools, like       0-1 years             12 votes              6 votes
in Formula One.                                                         2-3 years             7 votes               4 votes
                                                                        3-5 years             6 votes               2 votes
                                                                       Table 2: Results of survey on dashboards
interviews from the different driver categories would have been
good to have a better basis for the decisions made, but
unfortunately no more were available in the time window.
7.2 Implications
The results of this research should have a good impact on the
field of accessible feedback systems in sim racing. Having a basis
for decision making and a data-gathering tool in place, further
development can continue in the form of analyzing the data and
building a fully functional feedback system. Smaller esports
organizations can use this research to build up their own
understanding of useful information for their sim drivers.
8. RECOMMENDATIONS
Figure 5: Feedback system based on current solutions. When it comes to further work, it mainly comes down to
implementation. A good first step is to define a proper library
With the data collection tool working as intended and data being structure, rather than the JSON structure in place because of this
able to be saved in a way that it can be used for further analysis, research. With the data collection tool in place and the
combining the success of the preliminary feedback system, all requirements known, implementing a fully functional feedback
system requirements are met. system is the next step. After that, using data collected, a machine
learning algorithm can be used to personalise feedback based on
7. CONCLUSIONS AND DISCUSSION what improves times the most, as well as coming up with a
In conclusion, the feedback system proposed and initially consistency score to rate drivers on their driving. This
designed in Figure 4, based on interviews and research is a good consistency score is a good base for machine learning to learn
indication of what a smart telemetry feedback system will entail. what constitutes perfect driving, which is the goal of any sim
This feedback system fills the gaps missing in current solutions racer.
and perhaps it might bridge the gap between the complex
Formula One systems and accessible sim racing. 9. REFERENCES
When it comes to answering research questions RQ1 and RQ2,
[1] Braghin, F., Cheli, F., Melzi, S., Sabbioni, E. 2008.
which are focused on requirements, we can create a list of Race driver model. Computers & Structures, vol. 86,
requirements that have been discovered throughout this research: issues 13-14. pp. 1503-1516. July 2008. DOI:
10.1016/j.compstruc.2007.04.028
- The feedback system is to be accessible to as many
[2] Brown, I.D., Groeger, J.A. 1987. Risk perception and
people as possible. decision taking during the transition between novice
- The feedback system is to foster driver improvement. and experienced driver status. Ergonomics, vol. 31,
- The feedback system is to give feedback on as many 1988, pp. 585-597. DOI:
aspects of racing as possible. 10.1080/00140138808966701
- The feedback system is to be shaped in the form of a [3] Bugeja, K., Spina S. and Buhagiar, F. 2017.
dashboard. Telemetry-based optimisation for user training in
- The feedback system must be able to be used by drivers racing simulators. 2017 9th International Conference
of any experience level. on Virtual Worlds and Games for Serious
- As a driver, I want to compare myself to other people. Applications (VS-Games). pp. 31-38. DOI:
- As a driver, I want to get positive and negative 10.1109/VS-GAMES.2017.8055808
feedback. [4] Corcoran, P. M., Nanu, F., Petrescu, S. and Bigioi, P.
Real-time eye gaze tracking for gaming design and
- The feedback system is to display information that can
consumer electronics systems. 2012. IEEE
be well interpreted by sim racers. Transactions on Consumer Electronics, vol. 58, no. 2,
pp. 347-355, May 2012. DOI: 10.1109.
When these requirements are combined with RQ3 in mind, the
[5] Hamilton, J. August 2019. The rise of Esports.
result is the dashboard in Figure 4. This dashboard was deemed
ITNOW. pp. 28-29. DOI: 10.1093/itnow/bwz068
more useful in the eyes of sim racers of all levels. [6] Kane, D. May 2017. Recognizing ESports as a sport.
The Sport Journal. URL:
7.1 Challenges https://www.researchgate.net/profile/Daniel-Kane-
Some challenges arose with the creation of the data collection 6/publication/317929457_Recognizing_ESports_as_a
tool. Firstly, the outdated python version used in the Assetto _Sport/links/597f4db5a6fdcc1a9acd7fe1/Recognizing
Corsa API prevented the use of a data analysis library like -ESports-as-a-Sport.pdf accessed: 13-6-2021
pandas. This steered the implementation into the direction of [7] Patten, C.J.D., Kircher, A., Östlund, J., Nilsson, L.,
JSON libraries, which are – on large scale – slower and less Svenson, O. 2006. Driver experience and cognitive
convenient to use. An initial implementation of the data gathering workload in different traffic environments. Accident
tool was to dump the data into a single file and sort it from there, Analysis and Prevention 38 (2006). pp. 887–894.
but this was not possible because of the two-thousand lines limit DOI: 10.1016/j.aap.2006.02.014
Assetto Corsa can put out into a single file. This was then [8] van Leeuwen, P. M., de Groot, S., Happee, R. and de
Winter, J. C. F. 2017. Differences between racing and
bypassed by outputting the data into separate files. Some more
non-racing drivers: A simulator study using eye-tracking. PLoS ONE 12(11). DOI:
10.1371/journal.pone.0186871
[9] Reynolds, J. and May, J. 2021 Hamilton vs
Verstappen – The data that shows what was really
happening in the cockpit during their Bahrain battle.
Formula1.com. March 30. URL:
https://www.formula1.com/en/latest/article.hamilton-
vs-verstappen-the-data-that-shows-what-was-really-
happening-in-
the.3dmzzH3DVmuwqB2yI0OnAd.html. Accessed:
17-06-2021
[10] Robeers, T. 2020. ‘Roads?! Where we’re going, we
don’t’ need, roads’: Framing online sim racing during
Covid-19 by motorsport forum participants. Journal
of Motorsport Culture & History, 1 (1). ISSN: 2766-
1113
[11] Waldo, J. August 2005. Embedded computing and
Formula One racing. IEEE Pervasive Computing, vol.
4, no.3, pp. 18-21, August 2005. DOI:
10.1109/MPRV.2005.56
[12] Wloch, K., Bentley, P.J. 2004. Optimising the
Performance of a Formula One Car Using a Genetic
Algorithm. Yao, X. et al. (eds) Parallel Problem
Solving from Nature - PPSN VIII. PPSN 2004.
Lecture Notes in Computer Science, vol 3242. DOI:
10.1007/978-3-540-30217-9_71APPENDIX A. DATA AVAILABLE FROM ASSETTO CORSA A selection of the data to be gathered from the Assetto Corsa racing simulator. Laps Best lap Last lap Average lap times Sector Splits Consistency score Input Gas input Brake input Steering input Deltas Delta to cars ahead/behind Car data Speed trace Gear trace RPM trace ERS trace Fuel usage Aero drag Brake temperature Position Track position – racing lines Tyre Cambers Load Slip Wear Dirt Temperature
You can also read


