Quantitative and Qualitative Analyses of Invasive EEG for Epileptic Seizure Prediction
←
→
Page content transcription
If your browser does not render page correctly, please read the page content below
Open Access

Austin Journal of Clinical Neurology

Original Article

Quantitative and Qualitative Analyses of Invasive EEG for
Epileptic Seizure Prediction
Hussein R1,2* and Ward R1
                                                                     Abstract
1
 University of British Columbia, Electrical and Computer
Engineering, Canada                                                       This study aims at explaining why existing machine learning methods
2
 Stanford University, Center for Artificial Intelligence in          have achieved limited performance when applied to the problems of seizure
Medicine & Imaging, USA                                              prediction using human invasive EEG (iEEG) data. We provide quantitative and
*Corresponding author: Ramy Hussein, Electrical                      qualitative analyses of iEEG data, as this data has commonly been used for
and Computer Engineering, University of British                      seizure prediction tasks. Analyzing and understanding the iEEG signals provide
Columbia, Vancouver, BC V6T 1Z4, Canada; Center for                  insights into the characteristics of the preictal and interictal brain signals (i.e., the
Artificial Intelligence in Medicine & Imaging, Stanford              signals preceding and between epileptic seizure attacks). Experimental results
University, Stanford, CA 94305, USA                                  show that: (1) the iEEG data varies from one patient to another. Therefore,
                                                                     iEEG features collected from a patient over a specific time period may not
Received: February 09, 2021; Accepted: March 06,                     achieve reliable seizure prediction performance for other patient neither for the
2021; Published: March 13, 2021                                      same patient at some future times, (2) for iEEG dimensionality reduction, the
                                                                     exclusion of any individual iEEG channel may result in losing spatial information
                                                                     needed for accurate seizure prediction, as the different iEEG channels contain
                                                                     complementary information. Also, Principal Component Analysis is found to
                                                                     be efficient for iEEG dimensionality reduction in seizure prediction tasks, and
                                                                     (3) For a particular patient, the distribution of the preictal and of the interictal
                                                                     iEEG data vary over time, and thus negatively affect the predictive ability of pre-
                                                                     trained seizure prediction methods.
                                                                        Keywords: Seizure prediction; EEG; PCA; Channel selection; Data
                                                                     mismatch

Introduction                                                                       In 2013, a big dataset of long-term iEEG recordings has been recorded
                                                                                   (for 374-559 days) from three patients with drug-resistant epilepsy
     Epilepsy is a neurological disorder that affects around 70 million            [8]. A subset of this dataset was made publicly available and used in
people worldwide [1]. It is characterized by recurrent seizures                    the Melbourne University Seizure Prediction Competition organized
that strike without warning. Symptoms may range from a brief                       in November 2016 on Kaggle.com. In [12], Kuhlmann et al. describe
suspension of awareness to violent convulsions and sometimes loss                  the human iEEG dataset used in this contest and the results achieved
of consciousness [2]. Currently, anti-epileptic drugs are given to                 by the top eight seizure prediction solutions. Most of these solutions,
epileptic patients in sufficiently high dosages. These drugs could result          however, are patient-specific and have a lower chance of being able
in undesirable side effects such as tiredness, stomach discomfort,                 to generalize beyond the statistical patterns of the training examples.
dizziness, and also blurred vision. Further, the patient’s quality of life
is severely affected by the anxiety associated with the unpredictable                   Neuroscientists have found that the temporal dynamics of the
nature of seizures and the consequences therefrom. This motivated                  brain activity of epileptic patients can often be categorized into four
researchers to develop automatic seizure prediction systems [3].                   different states: preictal (directly prior to a seizure), ictal (during a
The ability to predict seizures with high accuracy could make                      seizure), postictal (directly after a seizure), and interictal (between
individualized epilepsy treatment possible (e.g., tailored therapies               two consecutive seizures). Accurate seizure prediction solutions
with fewer side effects). By having warnings of impending seizures,                necessitate that prediction methods are able to differentiate between
the patients can take their precautions and avoid any probable                     the preictal and interictal brain activities with high levels of accuracy.
injuries. This vision inspired the proposed research.                              In this work, we provide extensive analyses of the human iEEG data
                                                                                   preceding seizures (i.e., preictal) and between consecutive seizures
    Even though epileptic seizures seem unpredictable and often
                                                                                   (i.e., interictal). These analyses present some insights into the brain
occur without warning, recent investigations have demonstrated
                                                                                   data and help us to better understand the unpredictable nature of
that seizures do not strike at random [4,5]. Most existing seizure
                                                                                   epileptic seizures that we have been attempting to quantify.
prediction methods, however, achieve limited performance [6-11].
Only patient-specific solutions that are tailored to individual patients                As the success of seizure prediction solutions rely on their ability
have given good results [12,13], however, these methods have poor                  to differentiate between the interictal and preictal brain states, we
ability to adapt to new unseen data gathered from other patients.                  first investigate whether interictal and preictal iEEGs are statistically
Intracranial Electroencephalogram (iEEG) is a common tool used                     different. We also study dimensionality reduction of iEEG data, as the
for seizure prediction. The iEEG data that directly precede seizures is            huge amount of iEEG data involved in seizure studies could hamper
analyzed to identify the biomarkers that indicate upcoming seizures.               the practical applicability of feature engineering and classification

    Austin J Clin Neurol - Volume 8 Issue 1 - 2021            Citation: Hussein R and Ward R. Quantitative and Qualitative Analyses of Invasive EEG for Epileptic Seizure
    ISSN : 2381-9154 | www.austinpublishinggroup.com          Prediction. Austin J Clin Neurol 2021; 8(1): 1144.
    Hussein et al. © All rights are reserved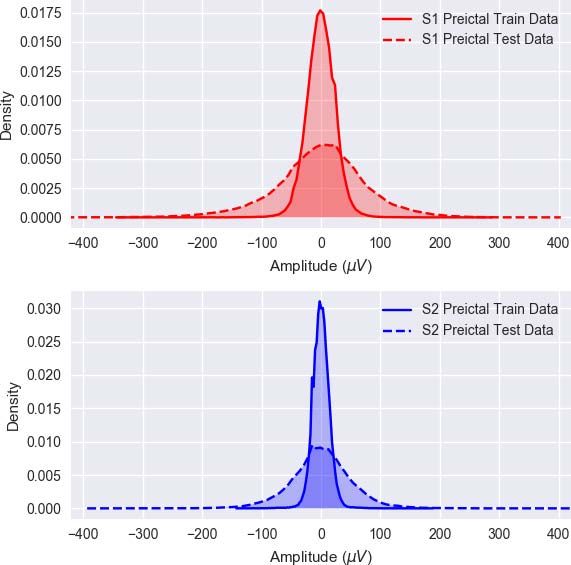
Hussein R                                                                                                                              Austin Publishing Group

 Figure 1: CT scan of the NeuroVista seizure advisory system implanted in a patient [8].

 Figure 2: Examples of one-hour preictal iEEG signals with a 5-minute offset before seizures. Sz stands for the seizure onset.

procedures. We study whether the popular Principal Component                       51 and 53 years old at the time of the clinical trial (i.e., in time of iEEG
Analysis (PCA) could be effectively used for reducing the iEEG                     acquisition), but were diagnosed with epilepsy at the age of 16, 10 and
dimensional space, and whether excluding some iEEG channels (i.e.,                 15, respectively.
sensors) could result in reliable dimensionality reduction. Finally,
                                                                                        As stated above, the key challenge in seizure prediction is to
we examine the cross-correlations between the different iEEG sensor
                                                                                   differentiate between the preictal and interictal brain states in people
readings during the preictal and interictal brain states and how could
                                                                                   with epilepsy. In our study and also in previous seizure prediction
this knowledge be used. Below we first describe the human iEEG data
                                                                                   work, only the lead seizures of every patient were used. Lead seizures
and the subjects employed in this paper.
                                                                                   are those that occur at least 4 hours after a previous seizure. The
Subjects and Data                                                                  captured iEEG data were labeled and separated into training and
                                                                                   testing sets. The testing data clips were recorded a long time (a few
    The iEEG data used is from the 2016 Kaggle seizure prediction
                                                                                   months) after recording the training data clips. As shown in (Figure
competition and is described in [12]. The data were recorded
                                                                                   2), the preictal data clips were extracted from the 60 minutes prior to
constantly from humans suffering from refractory (drug-resistant)
                                                                                   the lead seizures, with 5 minutes offset from the Seizure onset (Sz).
focal epilepsy using the NeuroVista Seizure Advisory System
                                                                                   Interictal clips were segmented from 60 minutes iEEG recordings that
(described in [8]). Sixteen electrodes (4×4 contact strips) were
                                                                                   started at an arbitrarily time that was 4 hours after any seizure and
implanted in all patients, directed to the presumed seizure focus,
                                                                                   ended at least 3 hours before the consecutive seizure.
and connected to a telemetry unit embedded in the subclavicular
area. Data were sampled at 400Hz, digitized using a 16-bit analog-                 Are Interictal and Preictal iEEGs Statistically
to-digital converter, wirelessly transmitted to an external hand-held              Different?
advisory device, and continuously stored in a removable flash drive.
                                                                                       Most seizure prediction problems focus on the difference between
(Figure 1) shows an example of a Computerized Tomography (CT)
                                                                                   the interictal and preictal brain states. Then the following question
scan of the head of one of the patients and reveals the locations of the
                                                                                   arises: Are the interictal and preictal iEEGs statistically different? If
16 iEEG electrodes on the cortical surface of the brain.
                                                                                   yes, then can we use their statistical features to distinguish between
    Three drug-resistant patients who also had the least seizure                   them? In an effort to address this question, we use boxplot-a popular
prediction performance in [8] were chosen for our study. The selection             descriptive statistics tool-to present the interictal and preictal
of these patients was propelled by the intention to understand why                 iEEGs distributions across all channels. The boxplot presents the
40% of the epileptic patients do not respond to medications. The large             data distribution using the five-number summary: minimum, first
number of seizures recorded per patient (~380) gives us the chance                 quartile, median, third quartile, and maximum. The first quartile
to explore the common signatures or biomarkers within the iEEG                     is the median of the data whose values are less than the median
recordings preceding seizures. The three patients were females and                 and the third quartile is the median of the data whose values are
they all had resective surgery (i.e., removal of a small portion of the            above the median. The difference between the maximum and the
brain) before the trials. The first, second, and third patients were 22,           minimum numbers is referred to as “overall range” and the difference

Submit your Manuscript | www.austinpublishinggroup.com                                                           Austin J Clin Neurol 8(1): id1144 (2021) - Page - 02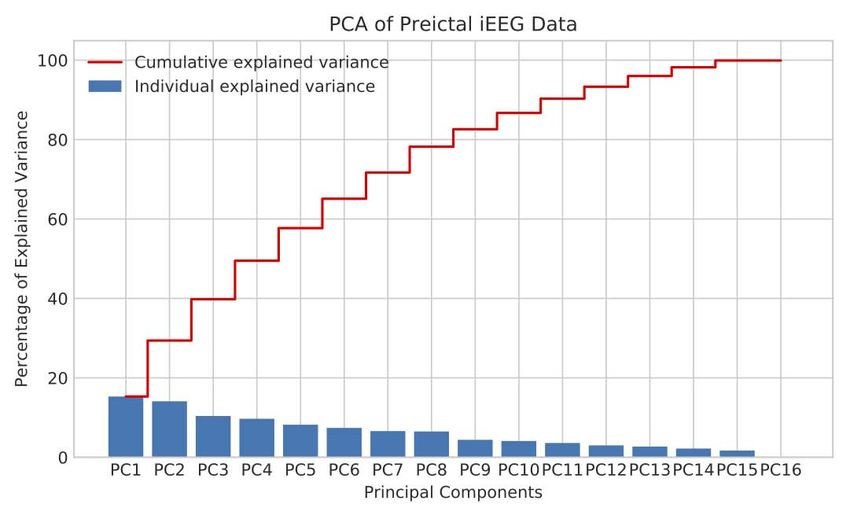
Hussein R                                                                                                                            Austin Publishing Group

 Figure 3: Boxplots of Patient 1’s interictal and preictal iEEG data.

 Figure 4: Explained variance by different principal components of preictal iEEG data for Patient 1.

between the first quartile and the third quartile is referred to as the             maximum and the minimum values) and Interquartile Range (IQR:
“interquartile range, IQR”.                                                         represented by the vertical length of the box) of the preictal data are
                                                                                    much greater than those of the interictal data. For the second patient,
    Figure 3 shows a comparative boxplot for Patient 1’s interictal                 however, the overall range and IQR of the preictal data are smaller
and preictal iEEG sensor readings. For each of the 16 sensors, the                  than those of the interictal data. For both patients, we also observe
interictal data boxplot (in blue) is on the left of the preictal data boxplot       that both interictal and preictal iEEG data series include large outliers
(in green). It can be noticed that, for most of the iEEG channels,                  (an outlier is a point which falls more than 1.5 times the interquartile
the overall range (represented by the vertical distance between the                 range below the first quartile or above the third quartile).

Submit your Manuscript | www.austinpublishinggroup.com                                                         Austin J Clin Neurol 8(1): id1144 (2021) - Page - 03
Hussein R Austin Publishing Group
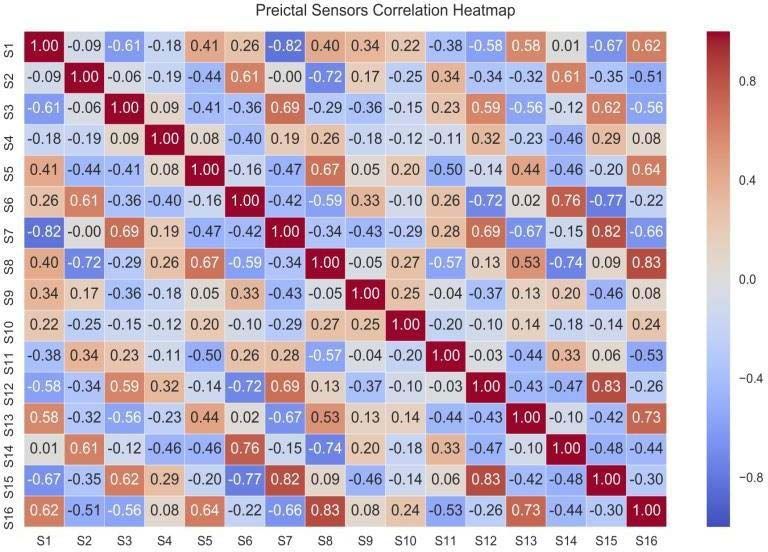
Figure 5: Heatmap of pairwise correlation values of iEEG sensor readings of Patient 1.
The difference between Patient 1 and Patient 2 and also patient 3 has been a popular tool for dimensionality reduction as it projects
shows that the interictal and preictal data of any patient have different higher dimensional data to lower dimensional data. Efficient PCA
dispersion (which implies that they are statistically different), however holds a great potential for reducing the dimension of multi-channel
their statistical features may only be used for building patient-specific EEG data, and hence speed up the subsequent machine learning
seizure prediction systems. Based on our observations for different algorithms (e.g., feature extraction and classification), minimizing
patients, we came to the conclusion that “There are no typical trends the computation time of the overall EEG-based diagnostic tools
in either interictal or preictal data across different epileptic patients. for neurological disorders. PCA can help remove the redundancy
The iEEG data of each patient has its own characteristics, and the in multi-variate EEG data, while maintaining most of the variance
statistical features can solely be meaningful for building patient- (information) in the observed variables. A useful measure is the
specific seizure prediction systems”. “explained variance”, which can be calculated from the eigenvalues
to measure how much information can be represented by each of the
Dimensionality Reduction for Seizure principal components.
Prediction Purposes
The work presented in [15] demonstrated how PCA could
Investigating the use of Principal Component Analysis
be effectively used in selecting the optimal feature subset from the
(PCA) for iEEG dimensionality Reduction in seizure
original EEG feature set, and therefore improve the epileptic seizure
prediction
detection performance and also detection time. PCA has been shown
Health care personnel should be informed as soon as possible to be an efficient data reduction tool that preserves the crucial EEG
when patients are experiencing a seizure attack. Similarly, patients data variance and achieves reliable seizure detection results. The
and health personnel should be also warned as soon as possible about question that arises here is: Can we also use PCA for efficient iEEG
an impeding seizure a patient may experience. It is therefore crucial dimensionality reduction in epileptic seizure prediction tasks? To
to carry seizure detection and seizure prediction in real-time or as answer this question, we applied PCA to the invasive EEG data under
fast as possible. For such methods to be of practical use, the reduction study. We then tested whether the 16 iEEG channels can be mapped
of EEG/iEEG data is thus necessary for their fast implementation. into a fewer number of principal components. The common criterion
Here we investigate two methods for iEEG data reduction. The first is to select the minimum number of principal components such that
is Principal Component Analysis (PCA) and the second is channel 90-95% of the data variance is retained.
reduction. PCA been widely used in reducing the dimensionality of the
scalp Electroencephalogram (EEG) data for seizure onset detection. In Figures 4 shows the individual principal components (colored
this study, we investigate the possibility and effectiveness of PCA for in blue) and the cumulative principal components (colored in red)
iEEG dimensionality reduction for seizure prediction purposes. PCA for both the preictal iEEG data of Patient 1. Unexpectedly, Figure 4
Submit your Manuscript | www.austinpublishinggroup.com Austin J Clin Neurol 8(1): id1144 (2021) - Page - 04Hussein R Austin Publishing Group
Figure 6: Hierarchically clustered iEEG sensors with dendrograms and clusters in Patient 1.
shows that, the first Principal Component (PC1) accounts for a small detection. This is because for seizure prediction, one major factor
amount of the data variance (~16%), and the crucial 95% of the data is the differentiation between preictal and interictal data, while for
variance is contained in 14 principal components. Therefore, only the seizure detection it is the differentiation between ictal and interictal
15th and 16th principal components can be dropped without losing data.
too much information. This implies that we cannot rely on the PCA
Figure 5 depicts the correlation heatmaps of preictal iEEG sensor
method for considerable iEEG dimensionality reduction in seizure
data of Patient 1, displaying the dependency relationships between
prediction problems.
the 16 iEEG sensor readings. As proven in [17], if the predictive
Investigating the Exclusion of some iEEG Channels/ ability of a certain channel X is covered by another channel, then
Sensors channel X can be safely removed. (Figure 6) displays the clustered
Since PCA has (unexpectedly) been found to be inefficient in heatmaps of the preictal iEEG sensor data for Patient 1. The data
reducing the dimensionality of the human iEEG data in seizure displayed in (Figure 5) can be re-organized to uncover that it can
prediction problems, we study whether channel selection (using be categorized into three main clusters; each cluster includes a set of
only the data from some particular channels) could be used for sensors (channels) that have similar correlations. These are shown in
reliable iEEG dimensionality reduction. The channels to be excluded (Figure 6). The first cluster comprises the sensors S3, S4, S7, S12, and
are those that will be found to be less relevant or redundant. There S15, while the second cluster includes S2, S6, S11 and S14, and the
is always a trade-off between selecting fewer iEEG channels and third cluster includes S1, S5, S8, S9, S10, S13 and S16. If two sensors
retaining as much spatial information as possible. The work presented have analogous correlation profiles, one of them could be excluded.
in [16] investigated the epileptic seizure detection performance for Following this rule, the first cluster could be represented only by S3,
different channel selection configurations. Using all EEG channels S4 and S12, and the second cluster could be represented only by S6
(22 channels) achieved the highest seizure detection performance. and S11, and the third cluster could be represented by S1, S5, S8 and
Selecting a moderately fewer number of EEG channels (e.g., 16 and S9.
8) reduces the amount of data to 36-72 % of its original size, and For Patient 2, the same procedure was carried out, but a different
results in a minor decay in the seizure detection performance [16]. combination of channel clustering was obtained. This is despite the
Channel selection of scalp EEG data was then found to be a successful fact that both Patients 1 and 2 have been diagnosed with focal epilepsy,
dimensionality reduction tool in seizure detection tasks. However, yet (it should be noted that) we have found that they have different
studies on channel selection of iEEG data for seizure prediction is preictal iEEG channel correlation clusters. The main reason why the
still lacking and cannot be deduced from those carried for seizure iEEG of different patients have different clustered heatmaps is that
Submit your Manuscript | www.austinpublishinggroup.com Austin J Clin Neurol 8(1): id1144 (2021) - Page - 05Hussein R Austin Publishing Group
Figure 7: Data mismatch in Patient 1’s preictal iEEG sensor data.
patients have seizures with different epileptogenic zones. Patient 1, the training set of the preictal iEEG signals recorded by Channel S1
for example, was diagnosed as parietal-temporal lobe epilepsy, while differs from that of the testing set. The testing data was recorded a
Patient 2 was diagnosed as occipito-parietal lobe epilepsy. In brief, few months after recording the training data. Similarly, the bottom
the correlations between iEEG sensors vary depending on which brain plot demonstrates the variation in the preictal iEEG density for
region is affected and whether the seizure is focal (partial) or generalized. Channel 2. The above implies that the training of a seizure prediction
Therefore, if seizure prediction researchers decided to use channel system should be repeated once the system is observed to not work
selection for the important reason of dimensionality reduction, it is accurately, or the system should be designed so that it’s training is
important that the selection be customized for individual patients. done in an adaptive fashion, i.e., the system continuously learns from
its new experiences and updates its coefficients accordingly.
iEEG Data Mismatch?
The terms “data mismatch”, “concept drift” and “covariate shift” Conclusion
have been used to refer to situations where the data distribution This work provided, for the first time, a detailed quantitative
changes over time [18]. Often, the distribution of a particular data and qualitative examination of the characteristics and behavior of
class (e.g., interictal or preictal) is assumed to not change over time, the human brain iEEG data during the preictal and interictal brain
implying that the distribution of the historical data is the same as the states. From the conducted analyses, we can deduce the following
distribution of the new data. While this assumption holds for many recommendations for researchers building future EEG-based seizure
machine learning problems, it is not necessarily true for all problems. prediction algorithms: i) There is no typical trend in either interictal
In some cases, the characteristics of the data vary over time, and or preictal data across different epileptic patients. The iEEG data of
hence the predictive models trained on historical data are no longer each patient has its own characteristics, and its statistical features can
valid for making predictions on new unseen data. After screening the solely be meaningful for building patient-specific seizure prediction
characteristics of the iEEG data under study, we found that, for each systems. The statistical features extracted from the data of a group
individual patient, the distribution of the interictal or the preictal of patients may not generalize to other patients or even to the same
iEEG data in the training set is different from that in the testing set. patients at later time; ii) for iEEG dimensionality reduction, the use
A potential reason for such a data mismatch is that the testing data is of PCA is not recommended, neither is the use of channel deletion.
recorded a few months after recording the training data. During this Each individual principal component or iEEG channel carries a non-
time, the patient may have been positively or negatively influenced by trivial amount of information and most of the principal components
factors such as anti- epileptic medications. or iEEG channels should be employed for efficient feature learning
Figure 7 depicts how the preictal iEEG data distributions of Patient and classification. Therefore, more efficient techniques for iEEG data
1 have changed over time. The top plot explains how the density of reduction should be sought. Such observations demonstrate why
Submit your Manuscript | www.austinpublishinggroup.com Austin J Clin Neurol 8(1): id1144 (2021) - Page - 06Hussein R Austin Publishing Group
epileptic seizure prediction using iEEG data remains a challenging 9. Karoly PJ, Ung H, Grayden DB, Kuhlmann L, Leyde K, Cook MJ, et al. “The
circadian profile of epilepsy improves seizure forecasting”. Brain. 2017; 140:
topic and why traditional machine learning algorithms that rely on
2169-2182.
domain-based features have a limited seizure prediction performance.
10. Eberlein M, Hildebrand R, Tetzla R, Homann N, Kuhlmann L, Brinkmann B,
Acknowledgment et al. “Convolutional Neural Networks for Epileptic Seizure Prediction”. 2018
IEEE International Conference on Bioinformatics and Biomedicine (BIBM).
Rabab Ward and Ramy Hussein were supported by NPRP grant 2018; IEEE: 2577-2582.
# NPRP12S-0305-190231 from the Qatar National Research Fund 11. Truong ND, Nguyen AD, Kuhlmann L, Bonyadi MR, Yang J, Ippolito S, et al.
(a member of Qatar Foundation). The findings achieved herein are “Convolutional neural networks for seizure prediction using intracranial and
solely the responsibility of the authors. scalp electroencephalogram”. Neural Networks. 2018; 105: 104-111.
References 12. Kuhlmann L, Karoly P, Freestone DR, Brinkmann BH, Temko A, Barachant A,
et al. “Epilepsyecosystem.org: crowd-sourcing reproducible seizure prediction
1. G Rogers. “Epilepsy: the facts”. Primary Health Care Research & with long- term human intracranial EEG”. Brain. 2018; 141: 2619-2630.
Development. 2010; 11: 413.
13. Daoud H, Bayoumi MA. “Efficient Epileptic Seizure Prediction Based on Deep
2. Acharya UR, Sree SV, Swapna G, Martis RJ, Suri JS. “Automated EEG Learning”. IEEE Transactions on Biomedical Circuits and Systems. 2019; 13:
analysis of epilepsy: a review”. Knowledge-Based Systems. 2013; 45: 147- 804-813.
165.
14. Cook MJ, O’Brien TJ, Berkovic SF, Murphy M, Morokoff A, Fabinyi G, et al.
3. Alessandro M, Esteller R, Vachtsevanos G, Hinson A, Echauz J, Litt B, et “Prediction of seizure likelihood with a long-term, implanted seizure advisory
al. “Epileptic seizure prediction using hybrid feature selection over multiple system in patients with drug-resistant epilepsy: a first-in-man study”. The
intracranial EEG electrode contacts: a report of four patients”. IEEE Lancet Neurology. 2013; 12: 563-571.
transactions on biomedical engineering. 2003; 50: 603-615.
15. Wang L, Xue W, Li Y, Luo M, Huang J, Cui W, et al. “Automatic epileptic
4. Gadhoumi K, Lina JM, Mormann F, Gotman J. “Seizure prediction for seizure detection in EEG signals using multi-domain feature extraction and
therapeutic devices: A review”. Journal of neuroscience methods. 2016; 260: nonlinear analysis”. Entropy. 2017; 19: 222.
270-282.
16. Shah V, Golmohammadi M, Ziyabari S, Von Weltin E, Obeid I, Picone J.
5. Assi EB, Nguyen DK, Rihana S, Sawan M. “Towards accurate prediction “Optimizing channel selection for seizure detection”. In Signal Processing in
of epileptic seizures: A review”. Biomedical Signal Processing and Control. Medicine and Biology Symposium (SPMB). 2017; IEEE: 1-5.
2017; 34: 144-157.
17. Hall MA. “Correlation-based feature selection for machine learning”. 2000.
6. Mormann F, Andrzejak RG, CE Elger, et al. “Seizure prediction: the long and
winding road”. Brain. 2006; 130: 314-333. 18. Zliobaite I, Pechenizkiy M, Gama J. “An overview of concept drift applications”.
In Big data analysis: new algorithms for a new society. Springer. 2016: 91-
7. Kuhlmann L, Freestone D, Lai A, Burkitt AN, Fuller K, Grayden DB, et al. 114.
“Patient-specific bivariate synchrony-based seizure prediction for short
prediction horizons”. Epilepsy research. 2010; 91: 214-231.
8. Cook MJ, O’Brien TJ, Berkovic SF, Murphy M, Morokoff A, Fabinyi G, et al.
“Prediction of seizure likelihood with a long-term, implanted seizure advisory
system in patients with drug-resistant epilepsy: a first-in-man study”. The
Lancet Neurology. 2013; 12: 563-571.
Submit your Manuscript | www.austinpublishinggroup.com Austin J Clin Neurol 8(1): id1144 (2021) - Page - 07You can also read