ONLINE REPORTING SYSTEM - USER GUIDE 2020-2021 - AZM2 PORTAL
←
→
Page content transcription
If your browser does not render page correctly, please read the page content below
Online Reporting System
                                                                             User Guide
                                                                                     2020-2021

                                                                          Published February 26, 2021
                                                              Prepared by Cambium Assessment, Inc.

Descriptions of the operation of the Online Reporting System, and related systems are property of
Cambium Assessment, Inc. (CAI) and are used with the permission of CAI.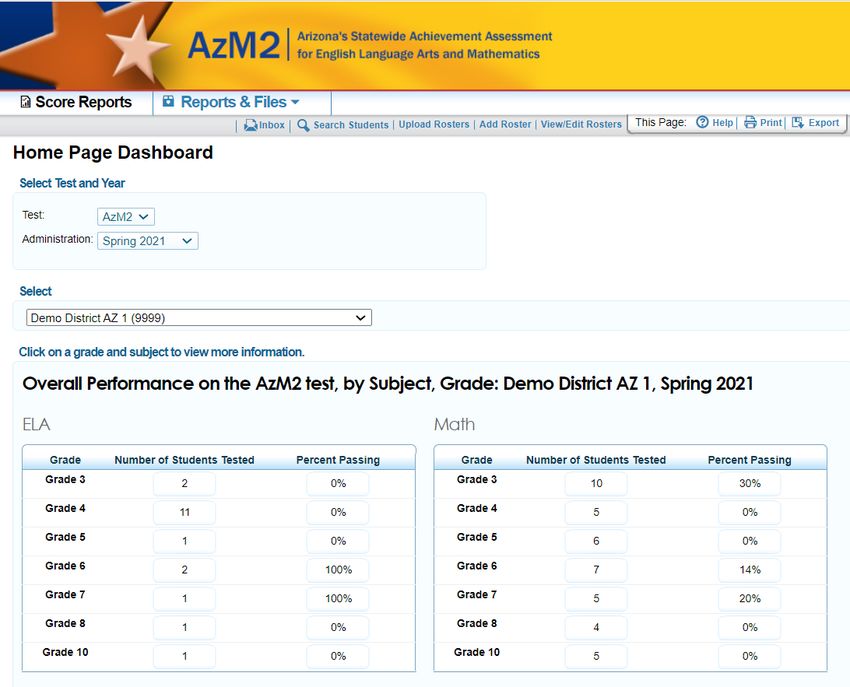
Table of Contents
Introduction to the User Guide ............................................................................................................. 1
   Organization of this User Guide ........................................................................................................... 1
   Document Conventions ....................................................................................................................... 2
   Additional Resources........................................................................................................................... 2
Section I. Overview of the Online Reporting System ........................................................................... 3
   Understanding User Roles and Permissions ........................................................................................ 3
Section II. Accessing the Online Reporting System ............................................................................ 5
   Logging in to ORS ............................................................................................................................... 5
   About Usernames and Passwords ....................................................................................................... 6
   Switching Between AzM2 Applications ................................................................................................ 6
   Logging out of ORS ............................................................................................................................. 7
Section III. Understanding the ORS Interface ....................................................................................... 8
   ORS Welcome Page ........................................................................................................................... 8
   ORS Banner........................................................................................................................................ 8
       General Tools.................................................................................................................................. 9
Section IV. Viewing Score Reports ..................................................................................................... 11
   Overview of Score Reports ................................................................................................................ 11
   Accessing Score Reports .................................................................................................................. 12
       Defining the Student Population .................................................................................................... 13
       Understanding the Home Page Dashboard Aggregation Tables and Accessing Subject
       Detail Score Reports ..................................................................................................................... 13
   Understanding the Score Report Layout and Features ....................................................................... 15
       Navigating between Score Reports using the Exploration Menu ..................................................... 16
          Understanding the Exploration Menu Options ............................................................................ 17
       Viewing Scores based on Demographic Subgroup......................................................................... 18
       Showing and Hiding a Report’s Columns ....................................................................................... 19
       Sorting Data in a Report ................................................................................................................ 19
       Showing and Hiding Comparison Data .......................................................................................... 20
   Viewing Subject Detail Score Reports................................................................................................ 22
       Viewing School Listing Subject Detail Report ................................................................................. 23
       Viewing Teacher Listing Subject Detail Report ............................................................................... 23
       Viewing Class Roster Listing Subject Detail Report........................................................................ 25
       Viewing Student Roster Subject Detail Report ............................................................................... 25
          Disaggregating the Student Roster Subject Detail Report by Demographic Subgroup ................ 27
       Viewing Individual Student Report ................................................................................................. 28

                                                                           i
Viewing Scoring Category Reports .................................................................................................... 33
       About the Relative Strength and Weakness Indicator Column ........................................................ 33
       Viewing School Listing Scoring Category Report ........................................................................... 34
       Viewing Student Listing Claims Report .......................................................................................... 35
Section V. Viewing Reports & Files .................................................................................................... 38
   Retrieving Student Data Files ............................................................................................................ 38
       Generating a Data File or PDF of Individual Student Reports ......................................................... 38
       Accessing Student Data Files and PDF of Individual Student Reports from My Inbox .................... 40
       Understanding the PDF of Individual Student Reports Zip File ....................................................... 41
          Sending Files from the Inbox ..................................................................................................... 42
Section VI. Working with Rosters of Students ................................................................................... 44
   Adding a New Roster......................................................................................................................... 44
   Creating Rosters Through File Uploads ............................................................................................. 47
   Viewing and Modifying a Roster ........................................................................................................ 49
   Deleting a Roster .............................................................................................................................. 51
   Printing a Roster ............................................................................................................................... 51
Section VII. Searching for Specific Student’s Score Reports ............................................................ 52
   Understanding Student Search Results and Selecting a Test ............................................................. 53
   Viewing a Selected Student’s Test Results ........................................................................................ 54
Appendix A. Printing Reports in the ORS .......................................................................................... 55
   Printing Reports from the Student Roster Report Page ...................................................................... 56
       Print Student Roster Report ........................................................................................................... 56
       Print PDFs of ISRs from the Student Roster Report Page .............................................................. 58
       Printing Reports from the Individual Student Report Page .............................................................. 58
   Printing ISRs from the Student Search Results Page ......................................................................... 60
Appendix B. User Support .................................................................................................................. 61

                                                                          ii
Online Reporting System                                            Introduction to the User Guide

Introduction to the User Guide
This user guide describes the features of the Online Reporting System (ORS), a web-based
system that provides score reports for each student who takes an AzM2 test.

This section provides an outline of the structure and organization of the user guide and the
stylistic features used in the document.

Organization of this User Guide
This user guide provides information about ORS’s features, including instructions for viewing
score reports, downloading student results, creating and editing rosters, and searching for
students.

This user guide is organized as follows:
Section I, Overview of the Online Reporting System, provides a brief introduction to the ORS
and describes the user roles for performing different tasks in the ORS.

Section II, Accessing the Online Reporting System, includes instructions on how to log in and log
out of the ORS and switch between different AzM2 systems.

Section III, Understanding the ORS Interface, describes the layout and key features of the ORS.

Section IV, Viewing Score Reports, includes an in-depth overview of the score reports available
in the ORS.

Section V, Viewing Reports & Files, describes how to download student results.

Section VI, Working with Rosters of Students, provides instructions on how to create and
manage student rosters.

Section VII, Searching for Specific Student’s Score Reports, includes instructions on how to
search for score reports for particular students in the ORS.

Appendix A, Printing Reports in the ORS, provides detailed instructions on how to print reports
in the ORS.

Appendix B, User Support, provides additional information including Help Desk information.

                                                1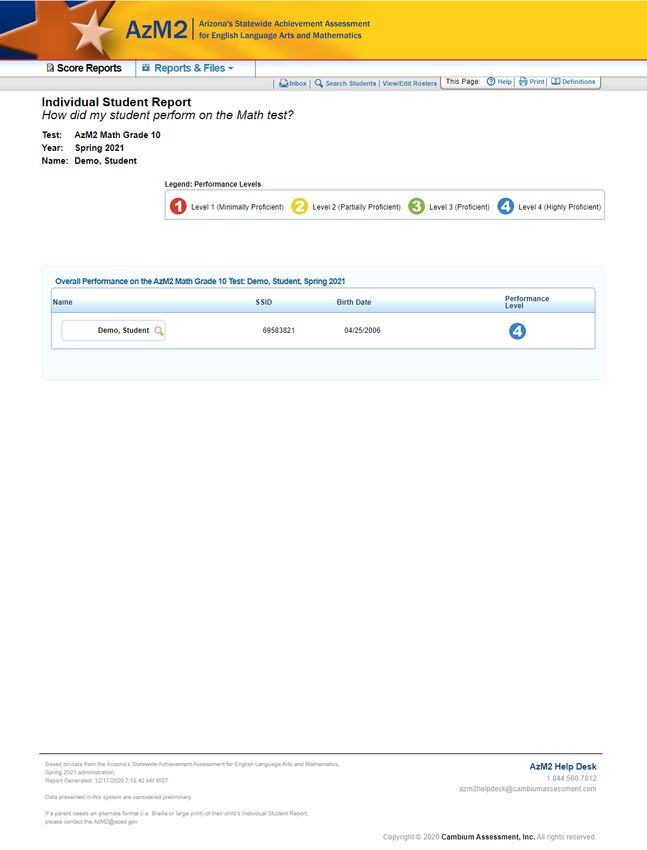
Online Reporting System                                                     Introduction to the User Guide

Document Conventions
The table below describes the key icons and elements used in this user guide.

 Element     Description

             Alert: This symbol accompanies important information regarding actions that may cause
             errors.

             Note: This symbol accompanies helpful information or reminders.

 Text        Bold text indicates a link, button, drop-down list value, or keyboard control that is clickable.

 Text        Bold and italicized text indicates a page name.

 Mono        Monospace indicates text you enter from the keyboard.

 Italics     Text in italics indicates field names.

             Warning: This symbol accompanies important information regarding actions that may
             cause fatal errors.

             Tip: This symbol accompanies useful information on how to perform a task.

Key Symbols and Elements

Additional Resources
The following publications provide additional information:

For information about which operating systems and browsers are supported, see the Quick
Guide for Setting up Your Online Testing Technology document and system-specific Secure
Browser Installation Guides.

For information about student and user management, rosters, and appeals, see the TIDE User
Guide.

For information about network and Internet requirements, general peripheral and software
requirements, and configuring text-to-speech settings, see the Quick Guide for Setting up Your
Online Testing Technology document.

The above resources are available on the AzM2 portal https://azm2portal.org/resources/.

                                                      2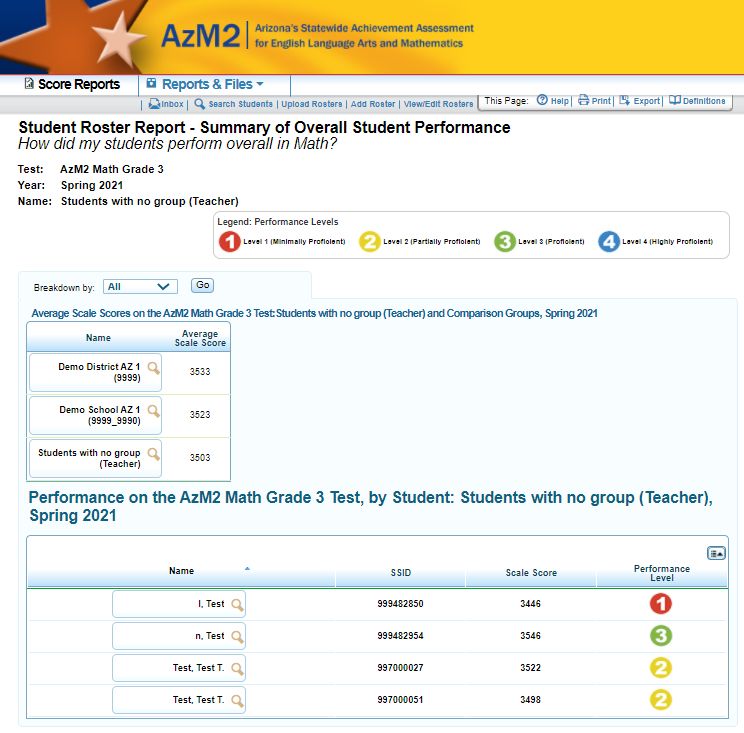
Online Reporting System                                      Overview of the Online Reporting System

Section I. Overview of the Online Reporting System
ORS enables you to view test data for students who have been identified in the Test
Information Distribution Engine (TIDE) to participate in both computer-based and paper-based
AzM2 tests. ORS contains two major features:
Score Reports: Provides score data for each AzM2 test, both computer-based and paper-based.
You can compare score data between individual students and the school, district, or overall
state average scores. ORS also provides information about performance on claims and
reporting categories.

Student Data Files (Reports & Files): Enables you to download student data files containing test
scores and demographic information.

In addition, the ORS enables you to create rosters for analyzing aggregate score data for specific
groups of students.

Understanding User Roles and Permissions
Access to the AzM2 ORS is managed through TIDE User Roles.
Individuals with a TIDE User Role of District Test Coordinator (DTC) or District Administrator
(DA) have access to all district level reports, all school level reports within the district, all
teacher level reports within the district, and all individual student reports for students who
tested in the district. The DA user role is an appropriate role for the district superintendent and
others who need access to all AzM2 reports for the district.

Individuals with a TIDE User Role of School Test Coordinator (STC) or School Report Viewer
(SRV) have access to all school level reports, all teacher level reports within the school, and all
individual student reports (ISRs) for students who tested in the school. The SRV user role is an
appropriate role for the school principal and others who need access to all AzM2 reports for the
school.

Individuals with a TIDE User Role of School Teacher (ST) have access to all teacher level reports
and all individual reports for students rostered to the teacher in the system. The ST role is an
appropriate role for teachers whose current students and/or whose prior year students took an
AzM2 test.

                                                 3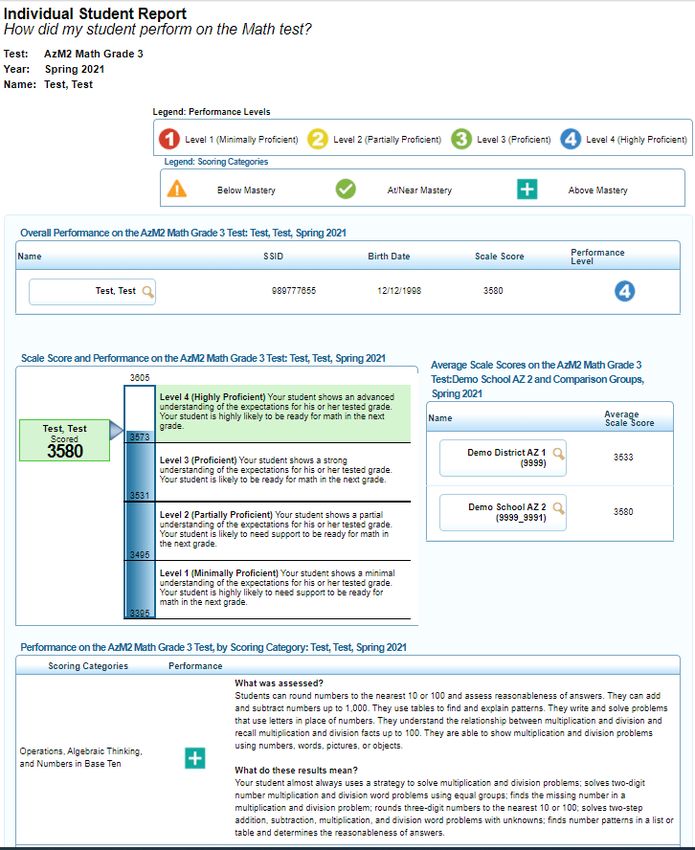
Online Reporting System                                       Overview of the Online Reporting System

User Roles and Access in the Online Reporting System

 Access Level and           DTC*         DA*           STC*     SRV*         ST*         TA*
 Roles*

 Score Reports

 School Listing                 ✓              ✓

 Teacher Listing                ✓              ✓          ✓         ✓              ✓
                               (all
                            schools in
                             district)

 Class Roster Listing           ✓              ✓          ✓         ✓              ✓

 Student Roster                 ✓              ✓          ✓         ✓              ✓

 Individual Student Score       ✓              ✓          ✓         ✓              ✓
 Report

 Viewing Reports and Files

 Retrieve Student               ✓              ✓          ✓         ✓              ✓
 Results

 Rosters

 Add Rosters                    ✓              ✓          ✓         ✓              ✓

 Edit Rosters                   ✓              ✓          ✓         ✓              ✓

 Upload Rosters                 ✓              ✓          ✓         ✓              ✓

 Search Students                ✓              ✓          ✓         ✓              ✓

* DTC—District Test Coordinator; DA—District Administrator; STC—School Test Coordinator; ST—
School Teacher, SRV—School Report Viewer; TA—Test Administrator

                                                   4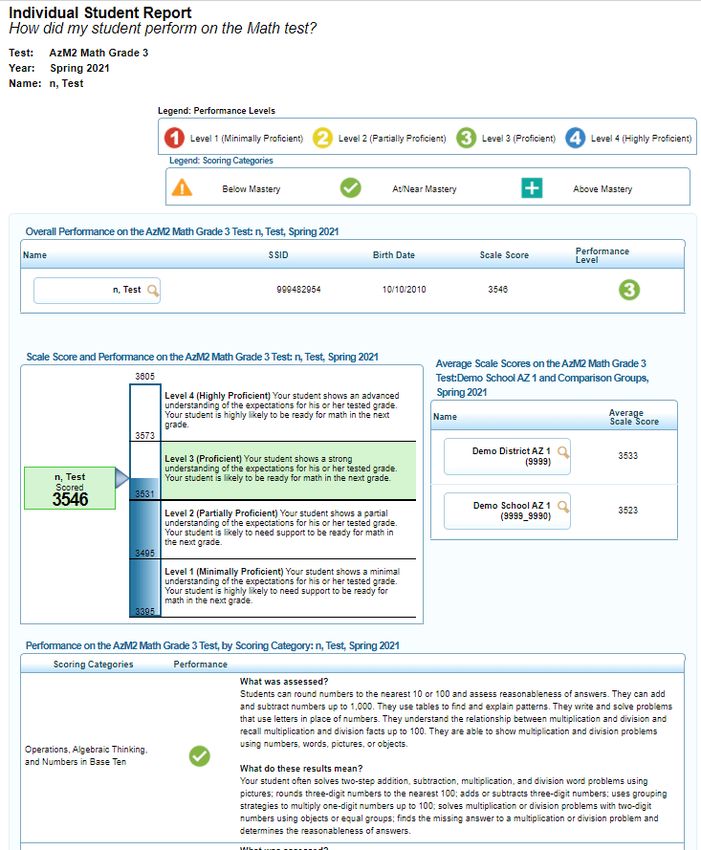
Online Reporting System                                      Accessing the Online Reporting System

Section II. Accessing the Online Reporting System
This section explains how to log in, switch between different systems, and how to log out.

Logging in to ORS
To log into ORS, you must have an authorized username and password in the Test Information
Distribution Engine (TIDE) system. If you have not yet received your login information, contact
your School Test Coordinator or District Test Coordinator as you will need to be added to TIDE
before you can access ORS.

        Warning: Do not share your login information with anyone. All AzM2 systems provide access
        to student information, which must be protected in accordance with federal privacy laws.

To log in to ORS:

   1. Open your web browser and navigate to the                                 User Cards on Portal
      AzM2 portal (AzM2portal.org).

   2. Select the appropriate user role card on the
      portal.

   3. Click Online Reporting System (ORS). The                                   ORS Card on Portal
      Login page appears.

   4. Enter your email address and password.                                             Login Page

   5. Click Secure Login.

   6. If the Enter Code page appears, an
      authentication code is automatically emailed
      to you. You must enter this code in the Enter
      Emailed Code field and click Submit within
      fifteen minutes of receiving the email. (If the
      code has expired, click Resend Code to
      request a new code.)

   7. The ORS Welcome page appears.

                                                5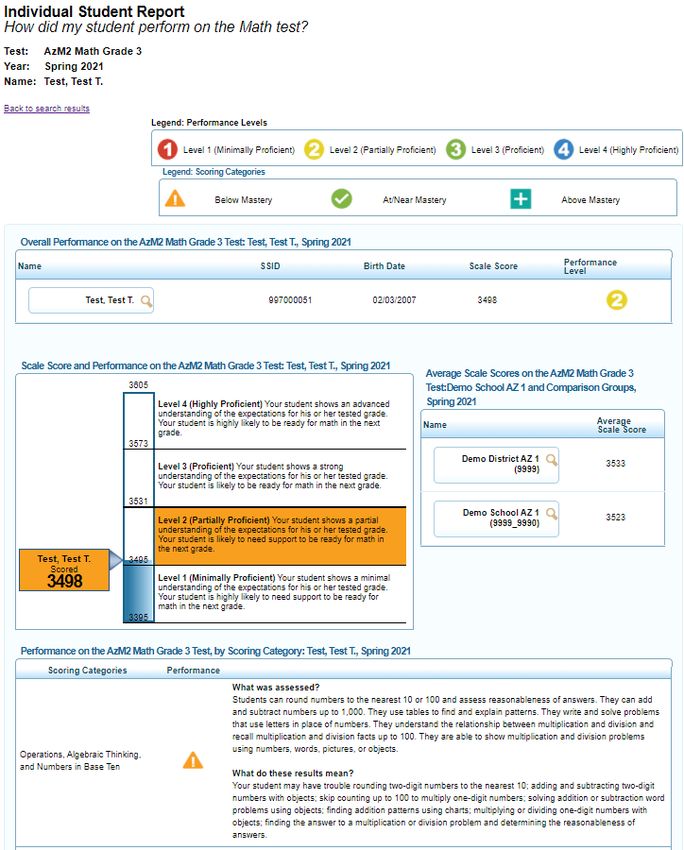
Online Reporting System                                          Accessing the Online Reporting System

About Usernames and Passwords
Your username is the email address associated with your account in the Test Information
Distribution Engine (TIDE). If you are a user who was recently added to TIDE, you should receive
an email from DoNotReply@cambiumast.com that contains a temporary password and a link to
log in to AzM2 systems. You must log in with your temporary password within 15 minutes of
receiving the email in order to activate your account. You must update your password and
select and answer a security question.

If your first temporary link expires:
In the activation email you received, click the second link provided and request a new
temporary link.

If you forget your password:
On the Login page, click Forgot Your Password? and then enter your email address in the Email
Address field to reset your password. You will receive an email with a new temporary link to
reset your password.

If you did not receive an email containing a temporary password:
Emails containing the temporary password come from DoNotReply@cambiumast.com. Check
your spam folder to make sure your email provider did not categorize it as “junk” mail. If you
still do not have an email, contact your School or District Test Coordinator to make sure you are
added in TIDE. Only users who have been added to TIDE will receive an account email with a
temporary password.

Additional Help
If you are unable to log in, contact the AzM2 Helpdesk for assistance at
azm2helpdesk@cambiumassessment.com. You must provide your name and email address.

Switching Between AzM2 Applications
When you are logged in to any AzM2 application, you can switch between applications without
signing in to each system separately.

         Note: Access to these systems and their features is dependent on your user role. While
         users will be able to navigate into TDS, the navigation menu will not appear in TDS. This is
         by design so that test sessions are not closed inadvertently.

To switch between the AzM2 systems:
1. Navigate to the drop-down list on the top left corner of your browser that displays the
   AzM2 applications you can access.

                                                    6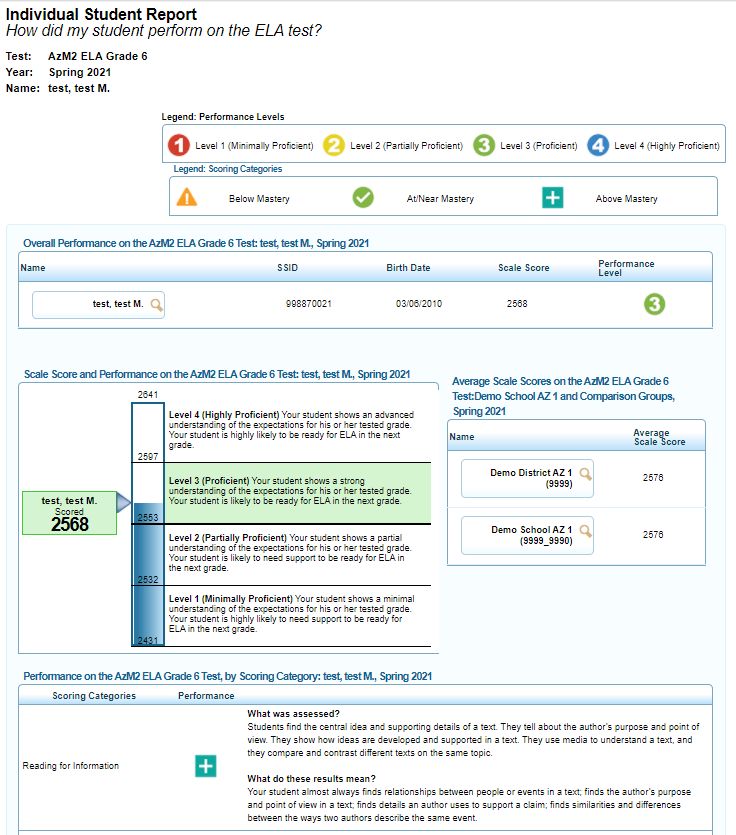
Online Reporting System                                        Accessing the Online Reporting System

                                     Single Sign On Drop-Down List

2. Select the system you want to use from this menu. You will be directed to the selected
   application and will not have to log in again.

Logging out of ORS
ORS contains students’ personally identifiable information. Be sure to log out of ORS to ensure
that unauthorized users do not have access to this information.

To log out of ORS:
1. Click Logout on the top right hand corner of the page.

                                            Logout button

        Note: ORS has a timeout feature that automatically logs you out of ORS if your session is
        inactive for 20 minutes.

                                                  7
Online Reporting System Understanding the ORS Interface
Section III. Understanding the ORS Interface
This section describes ORS’s features and layouts.
ORS Welcome Page
When you first log in to ORS, the Welcome page opens. You can select the report you want to
view from this page.
Note: To access the ORS reports and features at any other time, click the links in the ORS
banner.
Welcome Page
To view ORS reports:
1. From the Select drop-down list, select the district or school whose reports you want to view.
(This list appears only if you are a district-level user associated with more than one district
or a school-level user associated with more than one school. For example, if you are a
school-level user with access to multiple schools, you will need to select the school whose
reports you want to view.)
2. Do one of the following:
o To view score reports, click Score Reports.
o To download student results, click Student Data Files.
3. The page corresponding to your selection opens.
ORS Banner
The banner, which appears on all pages except for the Welcome page, provides links to all ORS
reports and features. Click the links and buttons described below to access the different ORS
reports and features.
Alert: Use the on-screen buttons and tools to navigate within the ORS. Do not use your web
browser's back button.
8Online Reporting System Understanding the ORS Interface
ORS Banner
Score Reports links to the Home Page Dashboard page which allows users to access Score
Reports. For information about these reports, see Viewing Score Reports.
The Reports & Files drop-down menu provides access to the Student Data Files. For
information about Reports & Files options, see Viewing Reports & Files.
Inbox displays the Student Data File & My Inbox page where you can access student
performance data files. For information about downloading student data files, see Accessing
Student Data Files and PDF of Individual Student Reports from
My Inbox.
Search Students opens a pop-up window where you can search for a student by SSID or by first
or last name and access test results. For information about searching for students, see
Searching for Specific Student’s Score Reports.
Add Rosters links to the Add Roster page where authorized users can create student rosters.
For information about rosters, see Working with Rosters of Students.
View/Edit Rosters links to the View/Edit/Export Roster page where authorized users can view
and edit student rosters. For information about rosters, see Working with Rosters of Students.
Upload Rosters links to the Upload Roster page where authorized users can upload roster files.
For information about rosters, see Working with Rosters of Students.
Note: The links to add, view and edit, and upload rosters are displayed on the basis of your
user role. For example, if you are not authorized to add rosters, the Add Roster link is not
displayed in the banner.
General Tools
The banner also consists of several tools. The tools that are available may vary from page to
page.
General Tools
Help opens the online version of the user guide.
Print displays the browser’s dialog box for printing the current page.
Note: Additional printing options are displayed when you click Print on the Student Roster
Report and Individual Student Report pages, which enable you to generate different score
reports in PDF format. You can also specify the language in which reports are printed from the
Student Listing page and Individual Student Report page, provided languages other than
English are supported. For more information, see Appendix A, Printing Reports in the ORS.
9Online Reporting System Understanding the ORS Interface
Caution: The Family Educational Rights and Privacy Act (FERPA) prohibits the release of any
personally identifiable information. Printed reports and exported reports that contain personally
identifiable student data must be securely stored or destroyed.
Tip: Depending on the report, you may need to set your print options to landscape or
horizontal mode to accommodate the various columns in the report. To preview and adjust the
scale of the content, use your browser’s Print Preview feature.
Export displays the browser’s dialog box for exporting the data displayed on the page. You can
choose to view the file immediately or save it for future use. The data is exported as a Microsoft
Excel (.xls) file.
Definitions displays a pop-up window that provides definitions for terms specific to the report
you are viewing.
Definitions Window
10Online Reporting System Viewing Score Reports
Section IV. Viewing Score Reports
This section describes score reports, their features, and how to access different score reports.
Overview of Score Reports
Score reports display aggregated scores for districts, schools, teachers, and rosters, as well as
individual student performance data for AzM2 tests. Data can be compared with the overall
state and district average for the test you are analyzing. ORS data is preliminary and cannot be
used for accountability purposes. All score report data is based on the total number of students
whose tests have been scored.
All score reports data, except for individual students’ score reports, can be disaggregated into
subgroups for detailed analysis. For example, you can view a Grade 5 Mathematics report for a
roster, for all of a teacher’s students, for an entire school, or for a district.
You can create custom groups of students to analyze aggregated data based on shared
characteristics. See Working with Rosters of Students, for additional information.
The table below provides an overview of the types of reports available through the Score
Reports feature and the levels of aggregation at which they can be viewed.
Available Score Reports
Report District School Teacher Roster Student
Level Level Level Level Level
Home Page Dashboard ✓ ✓ ✓
Summary of performance (to date) across
grades and subjects or courses for the current
administration.
Subject Detail ✓ ✓ ✓ ✓
Data for a subject within a particular grade or
course for the current administration.
Scoring Category Level Detail ✓ ✓ ✓ ✓
Scoring Category percentage at each
performance level for a subject within a
particular grade or course for the current
administration.
Student Roster ✓ ✓ ✓ ✓
Roster of all students who belong to a school,
teacher, or class with their associated subject
or course (and scoring category, if applicable)
scores for the current administration.
Student Detail ✓
Detailed information about a selected student’s
performance in a specified subject or course
(and scoring category, if applicable).
11Online Reporting System Viewing Score Reports
Accessing Score Reports
The Home Page Dashboard page displays the overall summary of score data and testing
progress for your state, district, or school, and is the starting point for data analysis. You can
define the students whose aggregated scores you want to view. You can also navigate to more
detailed score reports from the Home Page Dashboard page.
The score data you see is dependent on your role; for example, a school administrator only sees
that school’s aggregate data.
Home Page Dashboard Page
To view the Home Page Dashboard page immediately after logging in to the ORS:
• On the Welcome page, click Score Reports.
Note: If you have access to more than one entity, from the Select drop-down list on the
Welcome page (see Step 1), select the entity whose scores you want to view and then click
Home.
12Online Reporting System Viewing Score Reports
To view the Home Page Dashboard page at any other time:
• Click Score Reports on the banner at the top of the web page.
Defining the Student Population
From the Home Page Dashboard page, you can select the test and administration for which you
want to view score data.
To select the test and administration:
1. From the Test drop-down list, select an assessment (e.g., AzM2).
2. From the Administration drop-down list, select an administration (e.g., Spring 2021).
The Home Page Dashboard page aggregation tables display data based on your selections. See
Understanding the Home Page Dashboard Aggregation Tables and Accessing Subject Detail
Score Reports for information about the tables.
Understanding the Home Page Dashboard Aggregation Tables and Accessing
Subject Detail Score Reports
Aggregation tables appear on the Home Page Dashboard page that display score data for
students by grade or course and subject and provide access to more detailed subject score
reports.
Note: For AzM2, if a student submitted more than one test for scoring (e.g., one paper test and
one online test), the test record where the student scored the highest is used for all
aggregations.
Home Page Dashboard Aggregation Tables
13Online Reporting System Viewing Score Reports
The columns appearing in this report are:
Number of Students Tested—This column displays the number of students to date who
completed their test and have a valid score.
Percentage Passing—This column displays preliminary percent of tested students reaching the
proficient threshold in each grade or course and subject for the current window. The
percentage is a ratio of the number of students that were proficient on the test to the number
of students that took the test.
To access detailed score reports for a particular subject:
From the Home Page Dashboard page, click the corresponding grade-subject cell in the
appropriate table. For example, if you want to view the subject detail report for Math Grade 3,
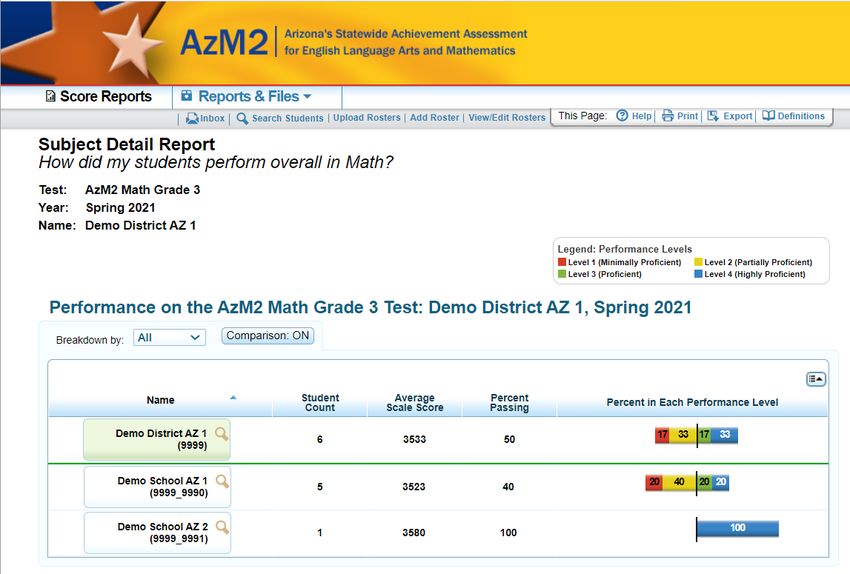
click the grade-subject button outlined in the figure above. The corresponding Subject Detail
Report appears.
Sample Subject Detail Report
Note: For the Spring 2021 administration, the Grade 10 Math subject detail report will not
report average scale score or percent in each performance level.
14Online Reporting System Viewing Score Reports
Understanding the Score Report Layout and Features
Most score reports share similar features. The figure below illustrates some of the common
features of score reports, which are:
Name: The name of the score report, the test, the administration, and the entity (e.g., district,
school, teacher, or roster) are displayed on the top of the report.
Report Format: All score reports except individual student reports are in table format such that
the first column displays the name or entity, such as district, school, or teacher, to whom the
scores belong.
Time Stamp: A time stamp is included at the bottom of every report to indicate when the
report was generated.
Legend: A legend is displayed on top of the report to describe the color codes that correspond
to each test-specific performance level and can help you understand the data presented on the
report. (Legends may not be displayed on all reports.)
Annotated Subject Detail Score Report
Legend
View Scores by Demographic Subgroups
Show/Hide Comparison Data Show/Hide Columns
View Exploration Menu
Time Stamp
15Online Reporting System Viewing Score Reports
Navigating between Score Reports using the Exploration Menu
You can navigate from one score report to another using the Exploration Menu.
To navigate between score reports:
1. From the Name column of a score report, click the icon that appears next to each entity
(e.g., school or teacher). The Exploration Menu appears.
Exploration Menu Icon
2. From the Exploration Menu drop-down lists, select the report that you wish to view. The
report options that are available may vary. For information about the different categories of
score reports, see Understanding the Exploration Menu Options.
Exploration Menu
3. Click View. The selected report opens.
16Online Reporting System Viewing Score Reports
Understanding the Exploration Menu Options
The Exploration Menu lets you navigate to different types of score reports for a selected subject
and grade. By default, the first two drop-down lists display the subject and grade cell you
selected from the Home Page Dashboard aggregation tables to access the score reports. You
can navigate to a different grade within the same subject or navigate to a different subject, if
available for the selected assessment, by selecting the required values from the relevant drop-
down lists.
Subject and Grade Selection Fields
Field Description
Subject Displays the subjects available for the selected assessment.
Grade Displays the grades available for the selected assessment.
The remaining three drop-down lists on the Exploration Menu let you select the type of score
report that you wish to view. For navigation purposes, score reports can be broadly categorized
into three dimensions: Who, What, and When. Data can be analyzed appropriately, depending
on whether the focus is on testing group (e.g., school, teacher, or roster), content type (e.g.,
subject or reporting category), or period of time. The table below describes these dimensions.
Using the Exploration Menu, you can navigate to any report by making different selections
under the Who, What, and When dimensions. However, the dimension categories that are
available depend on your user role, the report you are viewing, and the entity level where you
have opened the Exploration Menu. If a drop-down list displays N/A or does not show any
options, it means that you cannot navigate any further up or down in that dimension.
For example, as a district level user you can view all levels of Subject Detail Reports, such as the
School Listing, Teacher Listing, Class Roster Listing, and Student Roster. While viewing the
School Listing Report, if you open the Exploration Menu from the district level, the only
available option in the “Who” dimension will be School since it is not possible to view
aggregates for all the teachers, rosters, or students belonging to a district. However, if you open
the Exploration Menu from the school level, you will be able to select Teacher, Roster, or
Student to navigate to the required aggregation report for the selected school.
Score Reports Dimensions
Dimension Description Categories/Reports
Who Displays data for schools and groups (district- School
level, school-level, teacher-level, roster-level, and Teacher
individual students).
Roster
Student
What Displays data by appropriate content levels within Subject
the selected subject. Scoring Categories
17Online Reporting System Viewing Score Reports
Dimension Description Categories/Reports
When Displays data as a snapshot of performance in the Current Admin
current administration.
Viewing Scores based on Demographic Subgroup
The Breakdown By filter disaggregates the score data by a specific demographic subgroup
category. When you select a subgroup, the report expands to display the corresponding data
for that subgroup. For example, you can disaggregate a score report by gender to see the
associated score data for All, Female, and Male students as shown in the table below.
To view score reports by a demographic subgroup:
• From the Breakdown By drop-down list, select the required demographic subgroup. See the
table below for the available subgroups.
Demographic Subgroups
Subgroup Description Possible Values
Ethnicity Student’s ethnicity code. • Asian
• Black or African American
• American Indian or Alaska
Native
• White
• Hispanic or Latino Ethnicity
• Native Hawaiian or Other
Pacific Islander
• Multi-racial
Gender Student’s gender. • Female
• Male
18Online Reporting System Viewing Score Reports
Sample Score Report with Breakdown By Gender
Showing and Hiding a Report’s Columns
You can choose the columns that you want to display on a score report.
To show or hide a report’s columns:
1. Click the icon in the top right corner of the List of Score Report Columns
table. A list of the columns constituting the table is
displayed.
2. To show columns, mark the checkboxes next to
the columns that you wish to see.
3. To hide columns, clear the checkboxes next to the
columns that you wish to hide.
4. To remove the list from view, move your cursor
away from the arrow icon.
Sorting Data in a Report
You can sort data in ascending or descending order for all the columns. The default sort is by
Name in ascending order.
19Online Reporting System Viewing Score Reports
To sort the data:
1. Click the column header to sort data in ascending (A–Z; 1–10) order.
2. Click the column header again to sort the data in descending (Z–A; 10–1) order.
Note: The selected sort order is automatically applied to all the reports that you view while
logged in to the ORS. However, if you log out of the ORS, the sort order automatically reverts
to the default.
Showing and Hiding Comparison Data
By default, each of the score reports provide overall score data of the state, district, or school
appearing in the top rows above the green line. This can be used for comparing your results to
the parent entity. If the comparison data appear in the same table as the rest of the report, you
can choose to show or hide the comparison data when viewing the report.
Note: Additional comparison data at the teacher and roster levels may also be displayed for
some reports. However, the comparison rows that are available depend on the entity level from
which the report has been accessed. For example, the comparison rows will include the overall
score data of the teacher if you access the Class Roster Listing Report from the Teacher
Listing Report and not the School Listing Report.
To show or hide comparison data:
• Click the Comparison button above the report.
20Online Reporting System Viewing Score Reports
When Comparison: On is displayed, the comparison rows are visible on the report.
Sample Score Report with Comparison On
When Comparison: Off is displayed, the comparison rows are hidden from view.
Sample Score Report with Comparison Off
21Online Reporting System Viewing Score Reports
Viewing Subject Detail Score Reports
The Subject Detail Report is the first score report that you can access from the Home Page
Dashboard page and provides access to other score report categories.
The subject detail report consists of the following components:
• Subject Detail Report. How did my students perform overall in [Subject or Course], where
the text within brackets indicates variables that change based on the test that you have
selected.
• Each report also indicates the test name (subject and grade or course), the
administration, and the entity (e.g., district, school, teacher, or roster) for whom the
report has been generated.
• The title of the score report table is Performance on the [AzM2, subject/course, and
grade] Test: [Entity], [Administration], where the text within brackets indicates variables
that change based on the test that you have selected.
The Subject Detail Reports displays overall student performance for the selected test. All data
are based on the total number of students who have taken and completed the test and
submitted it for scoring. The table below describes the Subject Detail Reports columns.
Subject Detail Report Columns
Column Description
Name The name of the entity/individual you are viewing (e.g., district, school,
teacher, roster, student).
Student Count The number of students to date who submitted the selected test for
scoring.
Average Scale Score The average score of students who completed the scaled tests.
Percent Passing The percent of tested students reaching the proficient threshold on the
selected test for the current window.
Percent in Each The distribution of students across each of the four performance levels.
Performance Level
Note: For the Spring 2021 administration, the Grade 10 Math subject detail report will not
report Average Scale Score or Percent in Each Performance Level.
22Online Reporting System Viewing Score Reports
Viewing School Listing Subject Detail Report
The School Listing Subject Detail Report is the default for state- and district-level users and
shows data for the grade or course and subject selected on the Home Page Dashboard page. A
school’s performance data is displayed together with the associated district’s and state’s
performance in the selected grade or course and subject for the purpose of comparison. You
can view the data for each school in the selected district.
To generate a school listing subject detail report:
1. From the Home Page Dashboard page, select the test and administration for which you
want to view score data.
2. From the Home Page Dashboard page aggregate tables, click the grade/course and subject
cell for which you want to view a school listing subject detail report. The School Listing
Subject Detail Report for the selected test opens.
Sample School Listing Subject Detail Report
Viewing Teacher Listing Subject Detail Report
The Teacher Listing Subject Detail Report is available to district- and school-level users and
displays data for all the teachers in the selected school whose students have completed the
selected test.
To navigate to the Teacher Listing Subject Detail Report from the School Listing Subject Detail
Report:
1. On the School Listing Subject Detail Report, click the icon next to a school name. The
Exploration Menu opens.
23Online Reporting System Viewing Score Reports
Exploration Menu Icon
2. On the Exploration Menu, from the subject and grade drop-down lists, select the required
subject and grade; from the Who dimension drop-down list, select Teacher; from the What
dimension drop-down list, select Subject; from the When dimension, select Current Admin.
3. Click View. The teacher listing subject detail report for the selected school opens.
Teacher Listing Subject Detail Report
24Online Reporting System Viewing Score Reports
Viewing Class Roster Listing Subject Detail Report
The Class Roster Listing Subject Detail Report displays the selected school’s or teacher’s rosters;
these rosters include students who have completed the selected test. For information about
how to create rosters, see Working with Rosters of Students.
To navigate to the Class Roster Listing Subject Detail Report from the Teacher Listing Subject
Detail Report:
1. On the Teacher Listing Subject Detail Report, click the icon next to a teacher’s name. The
Exploration Menu opens.
2. On the Exploration Menu, from the subject and grade drop-down lists, select the required
subject and grade; from the Who dimension drop-down list, select Roster; from the What
dimension drop-down list, select Subject; from the When dimension, select Current Admin.
3. Click View. The class roster listing subject detail report for the selected teacher opens.
Class Roster Listing Subject Report
Viewing Student Roster Subject Detail Report
The Student Roster Report displays the scores of all the students associated with the selected
school, teacher, or roster who have completed the selected test.
The title of the score report table is Performance on the [AzM2, subject/course, and grade] Test,
by Student: [Entity], [Administration], where the text within brackets indicates variables that
change based on the test that you have selected.
25Online Reporting System Viewing Score Reports
Note: About Student Scores
For AzM2, if a student submitted more than one test for scoring (e.g., one paper test and one
online test), the test record where the student scored the highest is reported on the Student
Roster Report.
To navigate to the Student Roster Subject Detail Report from the Class Roster Listing Subject
Detail Report:
1. On the Class Roster Listing Subject Detail Report, click the icon next to a roster’s name.
The Exploration Menu opens.
2. On the Exploration Menu, from the subject and grade drop-down lists, select the required
subject and grade; from the Who dimension drop-down list, select Student; from the What
dimension drop-down list, select Subject; from the When dimension, select Current Admin.
3. Click View. The Student Roster Subject Detail Report for the selected roster opens.
Student Roster Subject Detail Report Columns
Column Description
Name The name of the student.
SSID The student’s unique identifier.
Scale Score The student’s scale score.
Performance Level The performance level associated with the student’s score.
26Online Reporting System Viewing Score Reports
Sample Student Roster Report
Disaggregating the Student Roster Subject Detail Report by Demographic Subgroup
Similar to the other score reports, you can disaggregate the data displayed on the Student
Roster Report page by demographic subgroups. However, the procedure for disaggregating and
viewing the data is different from the higher level reports.
To disaggregate score data by a subgroup:
1. From the Breakdown By drop-down list, select the required group. A Values field appears.
Student Roster Report Breakdown By Fields
2. From the Values drop-down list, select a specific subgroup. For example, select Male for the
subgroup Gender.
27Online Reporting System Viewing Score Reports
3. Click Go. The new student roster report only includes students that match the specified
value.
Viewing Individual Student Report
The Individual Student Report (ISR) displays the breakdown of the student’s scale score,
performance level for the selected subject, and a performance and scoring category description
for each scoring category. It also displays average scale scores for the state, district, and school
for comparison purposes.
Note: For the Spring 2021 administration, the Grade 10 Math Individual Student Report will not
report scale score or performance level.
To navigate to the Individual Student Report from the Student Roster Subject Detail Report:
1. On the Student Roster Subject Detail Report, click the icon next to a student’s name. The
Exploration Menu opens.
2. On the Exploration Menu, from the subject and grade drop-down lists, select the required
subject and grade; from the Who dimension drop-down list, select Student; from the What
dimension drop-down list, select Subject; from the When dimension, select Current Admin.
3. Click View. The Individual Student Report for the selected student opens.
For information about the features of the Individual Student Report page, see About the
Individual Student Report.
28Online Reporting System Viewing Score Reports
Sample Individual Student Report (Math Grades 3-8)
29Online Reporting System Viewing Score Reports
Sample Individual Student Report (Math Grade 10)
30Online Reporting System Viewing Score Reports
Sample Individual Student Report (ELA)
About the Individual Student Report
Each student's Individual Student Report is two pages. The Individual Student Report provides
the following information:
Overall Performance on the [AzM2 subject/course, and grade] Test: [Student Name],
[Administration]— This table includes:
• The student’s name and student ID.
• The student’s birth date.
31Online Reporting System Viewing Score Reports
• The student’s overall scale score for a test opportunity.
Note: For the Spring 2021 administration, Scoring Category reports are not available for Grade
10 Math.
• The performance level classification associated with the student’s score for a test
opportunity. Refer to the performance level legend on the top of the report for
understanding the data represented.
Note: For Grade 3 ELA tests, an indicator for whether the student has met the Move On When
Reading (MOWR) Requirement is also reported.
Scale Score and Performance on the [AzM2 subject/course, and grade] Test: [Student Name],
[Administration]—This barrel chart visually depicts the student’s achievement level based on
his or her overall scale score.
Performance on the [AzM2 subject/course, and grade] Test by Scoring Category: [Student
Name], [Administration]—This table includes:
• The student’s performance level in each of the scoring categories for the test
opportunity corresponding to the highest overall performance. Refer to the scoring
category legend on the top of the report for understanding the symbols represented.
• Descriptions of what was assessed in each scoring category and what the student’s
results mean.
Note: For the Spring 2021 administration, Scoring Category reports are not available for Grade
10 Math.
Average Scale Scores on the [AzM2 subject/course, and grade] Test: [Entity] and Comparison
Groups, [Administration]—This table includes average scale scores for the state, district, and
school with which the student is associated.
Writing Essay Performance on the [AzM2 subject/course, and grade] Test by Dimension:
[Student Name], [Administration]—This table provides information about the student’s
performance on the Writing test.
Note: This Writing Essay Performance table is only displayed for ELA tests.
32Online Reporting System Viewing Score Reports
Viewing Scoring Category Reports
For the selected test, the Scoring Categories report shows the percentage of your students in
each Scoring Category and an indicator of whether the category is a strength or a weakness for
each group.
Note: For the Spring 2021 administration, Scoring Category reports are not available for Grade
10 Math.
The Scoring Categories report name consists of the following components:
The score report name is [Entity] Performance on Each Scoring Categories. What are my
[entity’s] strengths and weaknesses in [Subject or Course], where the text within brackets
indicates variables that change based on the test that you have selected.
Each report indicates the test name (subject and grade or course), the administration, and the
entity (e.g., district, school, teacher, or roster) for whom the report has been generated.
The title of the score report table is Performance on the [AzM2 subject/course, and grade] Test,
by Scoring Category: [Entity], [Administration], where the text within brackets indicates
variables that change based on the test that you have selected.
Scoring Category Report Columns
Column Description
Name The name of the entity/individual you are viewing (e.g., district, school,
teacher, roster, student).
Student Count The number of students to date who submitted the selected test for
scoring and have a valid score.
Average Scale Score The mean scale score and standard error of the mean of students who
have completed the selected test.
Scoring Category The scoring categories constituting the selected subject.
Percent in Each Scoring The distribution of students across each of the three scoring category
Category proficiency levels.
Relative Strength and Number of students at each strand level who meet or exceed the strand
Weakness Indicator target. For more information, see About the Relative Strength and
Weakness Indicator Column
About the Relative Strength and Weakness Indicator Column
The performance levels indicated on this report are relative to the test as a whole. Unlike
performance levels provided at the subject level, these strengths and weaknesses do not imply
proficiency. Instead, they show how a group of students’ performance is distributed across the
scoring categories relative to their overall subject performance on a test.
33Online Reporting System Viewing Score Reports
For example, a group of students may have performed very well in a subject, but performed
slightly lower in several scoring categories. Thus, the downward arrow for a scoring category
does not imply a lack of proficiency. Instead, it simply communicates that these students’
performance on that scoring category was statistically lower than their performance across all
other scoring categories put together. Although the students are doing well, an educator may
want to focus instruction on these areas.
Scoring Category Level Legend Descriptions
Icon Scoring Category Description
Level
This scoring category is a relative strength. The group of
Better than performance
students performed better on items from this scoring category
on the test as a whole
than they did on the rest of the test as a whole.
This scoring category is neither a relative strength nor a relative
Similar to performance weakness. The group of students performed about as well on
on the test as a whole items from this scoring category as they did on the rest of the test
as a whole.
Worse than This scoring category is a relative weakness. The group of
performance on the test students did not perform as well on items from this scoring
as a whole category as they did on the rest of the test as a whole.
Too Few Items or Too Not enough information is available to determine whether this
Few Students scoring category is a relative strength or weakness.
Viewing School Listing Scoring Category Report
The School Listing Scoring Category Report is available for district-level users. A school’s
performance data on each scoring category constituting the selected grade and subject is
displayed together with the associated district’s and state’s performance for the purpose of
comparison. You can view the data for each school in the selected district.
To access the School Listing Scoring Category Report from the School Listing Subject Detail
Report:
1. On the School Listing Subject Detail Report, click the icon next to the district name. The
Exploration Menu opens.
Exploration Menu Icon
34Online Reporting System Viewing Score Reports
2. On the Exploration Menu, from the subject and grade drop-down lists, select the required
subject and grade; from the What dimension drop-down list, select Scoring Categories;
from the Who dimension drop-down list, select School; from the When dimension, select
Current Admin.
3. Click View. The School Listing Scoring Category report opens.
Sample School Listing Scoring Category Report
Viewing Student Listing Claims Report
The Student Roster Scoring Category Report displays scoring category performance for all the
students associated with the selected school, teacher, or roster who have completed the
selected test.
To access the Student Roster Scoring Category Report from the School Listing Scoring Category
Report:
35Online Reporting System Viewing Score Reports
1. On the School Listing Scoring Category Report, click the icon next to an entity’s name.
The Exploration Menu opens.
2. On the Exploration Menu, from the subject and grade drop-down lists, select the required
subject and grade; from the what dimension drop-down list, select Scoring Categories; from
the who dimension drop-down list, select Student; from the when dimension, select
Current Admin.
3. Click View. The Student Roster Scoring Category Report opens.
The Student Listing Scoring Category Score Report differs from higher level scoring category
reports in that it reports a student’s name, student identification number, overall subject scale
score, and overall subject performance level, as well as the scoring category classification
associated with the student’s scoring category performance. Refer to the legend on the top of
the report to understand the data represented.
Sample Student Roster Scoring Category Report
36Online Reporting System Viewing Score Reports
Similar to the Student Roster Subject Detail Score Report, you can print or export the report.
You can also disaggregate the report by demographic subgroups. For more information, see
Disaggregating the Student Roster Subject Detail Report by Demographic Subgroup.
37Online Reporting System Viewing Reports & Files
Section V. Viewing Reports & Files
The Reports & Files feature enables you to retrieve student results. This section provides
instructions on how to generate and view the available reports.
Retrieving Student Data Files
You can download student data for a selected administration by district, school, teacher, or
roster. The data includes students’ personal information, including enrolled school and district,
grade level, and the selected test scores and scoring category scores (if applicable). You can also
generate PDFs of Individual Student Reports (ISRs) in a Zip file.
Generating a Data File or PDF of Individual Student Reports
To generate a student data file or PDF of Individual Student Reports:
1. From the Reports & Files drop-down list, select Student Data File. The Student Data File &
My Inbox page opens.
Student Data File & My Inbox Page
2. From the Step 1: Choose What section, select the report, tests, grades, and other variables.
o Report Type: Select a report. The available options are Student Data and PDF of Student
Reports.
o Test: select an assessment (e.g., AzM2).
o Administration: select an administration (e.g., Spring 2021).
o Tested Grade: select a grade. Alternatively, select All Grades to create a separate file for
each available tested grade. These files will be provided in a compressed (.zip) file.
38Online Reporting System Viewing Reports & Files
o Download Format: Select a file format from the options available for the selected
report:
▪ Student Data: The default is an Excel (.xls) spreadsheet file. You can select a
different format, such as .csv, if available.
▪ PDF of Student Reports: The report is generated as a PDF, which is the only
available format.
o Filter By (Optional): Select a specific demographic subgroup. You may also select All,
which is the default. If you select a demographic subgroup, a Values field is displayed.
Select the required filter criteria from the available options. The Values field does not
have an All option.
3. From the Step 2: Choose Who section, select which district, school, and teacher should be
included in the report. For most users, the district or school you are associated with is pre-
selected and the drop-down lists are grayed out. Verify that the selections are accurate.
District- and school-users with access to multiple districts or schools will need to select a
district or school.
o District: Select a district if applicable.
o School: Select a school if applicable. You can also select All to generate a report that
includes all your schools. For Student Data report, data for all your schools is listed in a
single file. For PDFs of Individual Student Reports, separate PDF reports are generated
for each of your schools.
o Teacher (Optional): If a school was selected, choose a teacher from the Teacher
dropdown. The default is set to All and includes all teachers associated with the school.
For teacher-level users, the school will already be selected.
o Roster (Optional): If a teacher was selected, choose a roster. The default is set to All and
includes all rosters associated with the selected teacher.
4. Click Export to Inbox. A confirmation message appears to inform you that your request has
been queued and you will be informed via e-mail once the file is ready.
5. Once the file has been generated, it will be displayed in the Inbox window accessible in the
banner. You can download the data file by clicking the Download link for the data file. Your
files will be available for 30 days.
39You can also read