Tanium Integrity Monitor User Guide - Version 1.7.0 April 09, 2019
←
→
Page content transcription
If your browser does not render page correctly, please read the page content below
Tanium™ Integrity Monitor User Guide
Version 1.7.0

April 09, 2019
The information in this document is subject to change without notice. Further, the
information provided in this document is provided “as is” and is believed to be accurate,
but is presented without any warranty of any kind, express or implied, except as provided
in Tanium’s customer sales terms and conditions. Unless so otherwise provided, Tanium
assumes no liability whatsoever, and in no event shall Tanium or its suppliers be liable for
any indirect, special, consequential, or incidental damages, including without limitation,
lost profits or loss or damage to data arising out of the use or inability to use this
document, even if Tanium Inc. has been advised of the possibility of such damages.

Any IP addresses used in this document are not intended to be actual addresses. Any
examples, command display output, network topology diagrams, and other figures
included in this document are shown for illustrative purposes only. Any use of actual IP
addresses in illustrative content is unintentional and coincidental.

Please visit https://docs.tanium.com for the most current Tanium product documentation.

Tanium is a trademark of Tanium, Inc. in the U.S. and other countries. Third-party
trademarks mentioned are the property of their respective owners.

© 2019 Tanium Inc. All rights reserved.

 © 2019 Tanium Inc. All Rights Reserved                                               Page 2
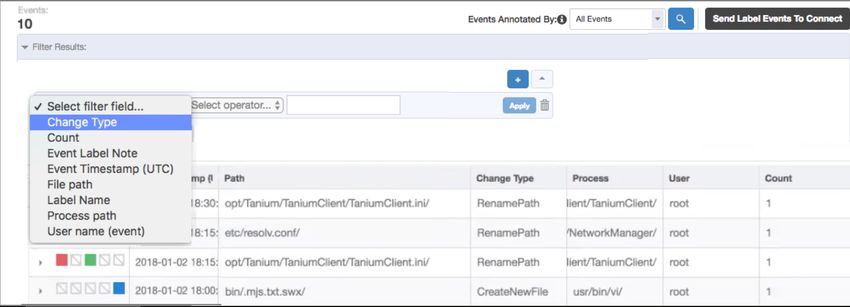
Table of contents
 Integrity Monitor overview                                                  7

 Getting started                                                             8

 Requirements                                                                9

   Tanium dependencies                                                       9

   Endpoint hardware and software requirements                               9

      Linux                                                                  9

   Host and network security requirements                               10

      Security exclusions                                               10

   Service account user                                                 10

   User role requirements                                               11

      Tanium Server 7.0                                                 11

      Tanium 7.1 or later                                               11

   Legacy deployment requirements                                       17

   Permission recording                                                 17

      Linux                                                             17

      Standard Windows                                                  18

      Legacy Windows                                                    19

 Installing Integrity Monitor                                           20

   Install Integrity Monitor                                            20

   Integrity Monitor home page                                          20

   Create and configure an Integrity Monitor service account user       20

   Align content when upgrading                                         22

 Working with watchlists                                                24

© 2019 Tanium Inc. All Rights Reserved                              Page 3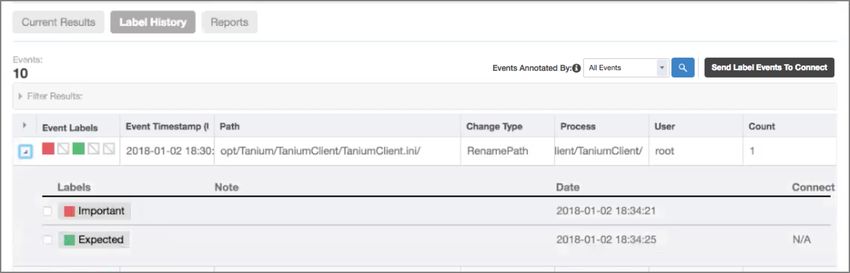
Create a new watchlist                                                   24

   Edit a watchlist                                                         26

   View watchlist details                                                   27

   Add new paths                                                            28

      Example Tanium CSV file used to import paths                          30

   Filter files and directory paths                                         30

   Export and import watchlists                                             31

 Working with monitors                                                      32

   Create a new monitor                                                     32

   Prioritize monitors                                                      35

   Deploy monitors                                                          36

   Check status of deployed monitors                                        36

   Edit monitors                                                            37

   Understand the differences between standard and legacy monitoring        37

      Standard Windows and Windows (Legacy)                                 37

      Integrity Monitor behaviors on Legacy Windows with Tanium Index       38

      AIX and Solaris                                                       38

 Working with events                                                        39

   Run tools status sensor to resolve no results error                      39

   Learn event from current results                                         39

   Label current results                                                    40

      Remove a label from an event                                          41

      Customize labels                                                      42

      Create a new label from a monitor page                                42

      Add notes to labels                                                   43

© 2019 Tanium Inc. All Rights Reserved                                  Page 4
Remove a note from a label                         45

      Using the Label History tab                        45

      Edit labels                                        47

   Configure reports for current results                 47

      Setting Weekly Report Schedule                     48

   Use Connect to send events                            49

      Send only labeled events                           51

      Send labeled events at defined intervals           51

 Working with rules                                      53

   Create a new rule                                     53

      Example Tanium CSV file used to import rules       54

   Deactivate a rule                                     55

   Clone a rule                                          55

   Delete a rule                                         55

 Best practices                                          57

   Defining watchlists                                   57

   Setting up computer groups                            57

 Troubleshooting                                         58

   Collect logs                                          58

      Collect logs within Integrity Monitor              58

      Manually collect logs                              58

   Remove Integrity Monitor tools                        59

      Linux                                              59

      Windows                                            61

      AIX                                                62

© 2019 Tanium Inc. All Rights Reserved               Page 5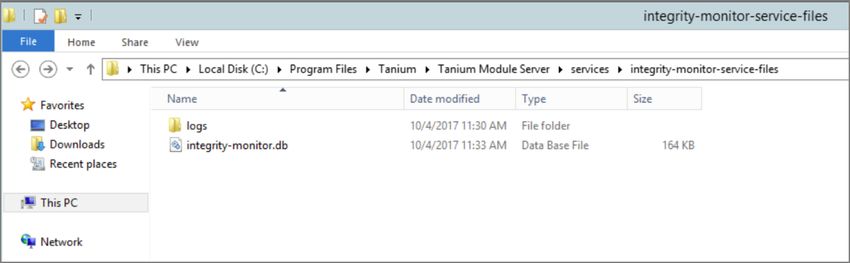
Solaris                                            62

   Specify Diagnostic Settings                           62

   Override Configuration Settings                       62

   Uninstall Integrity Monitor                           63

 Reference: Endpoint monitoring status errors            65

   Standard Windows endpoint status error messages       65

   Standard Linux endpoint status error messages         67

© 2019 Tanium Inc. All Rights Reserved               Page 6
Integrity Monitor overview
With Integrity Monitor, you can simplify regulatory compliance for your enterprise by
consolidating tools and accomplish the following:

      l   Continuously monitor critical operating system (OS), application, and log files.
             l With uninterrupted, real-time integrity monitoring, you are not limited by a set

               schedule.
                l   Avoid the complexity of deploying several point tools and tuning them for
                    individual endpoints.
      l   Go from alert to active investigation using other modules on the Tanium platform.
      l   Deploy continuous monitoring for common or new attack vectors to any dynamic
          group of computers or across the enterprise. By leveraging Tanium™ Connect,
          integrate with existing change management and incident response systems to scale
          integrity monitoring.

This documentation may provide access to or information about content, products (including hardware and software), and services provided by third
parties (“Third Party Items”). With respect to such Third Party Items, Tanium Inc. and its affiliates (i) are not responsible for such items, and expressly
disclaim all warranties and liability of any kind related to such Third Party Items and (ii) will not be responsible for any loss, costs, or damages incurred
due to your access to or use of such Third Party Items unless expressly set forth otherwise in an applicable agreement between you and Tanium.

Further, this documentation does not require or contemplate the use of or combination with Tanium products with any particular Third Party Items and
neither Tanium nor its affiliates shall have any responsibility for any infringement of intellectual property rights caused by any such combination. You, and
not Tanium, are responsible for determining that any combination of Third Party Items with Tanium products is appropriate and will not cause infringement
of any third party intellectual property rights.

  © 2019 Tanium Inc. All Rights Reserved                                                                                                            Page 7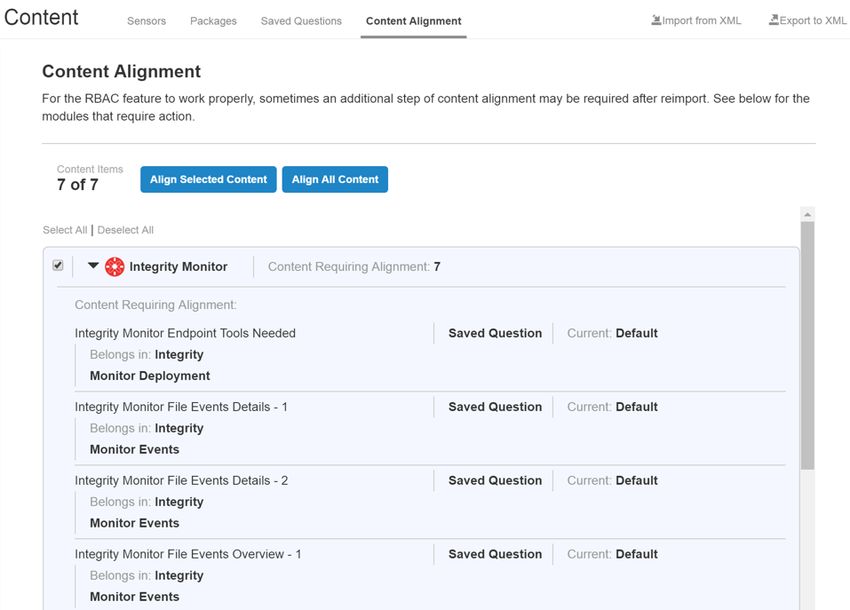
Getting started
 1. Install Integrity Monitor. For more information, see Installing Integrity Monitor on
    page 20.
 2. Create watchlists. For more information, see Working with watchlists on page 24.
 3. Create monitors. For more information, see Working with monitors on page 32.
 4. View and label your results. For more information, see Working with monitors on
    page 32.
 5. Send out your results using Connect. For more information, see Working with events
    on page 39.

© 2019 Tanium Inc. All Rights Reserved                                               Page 8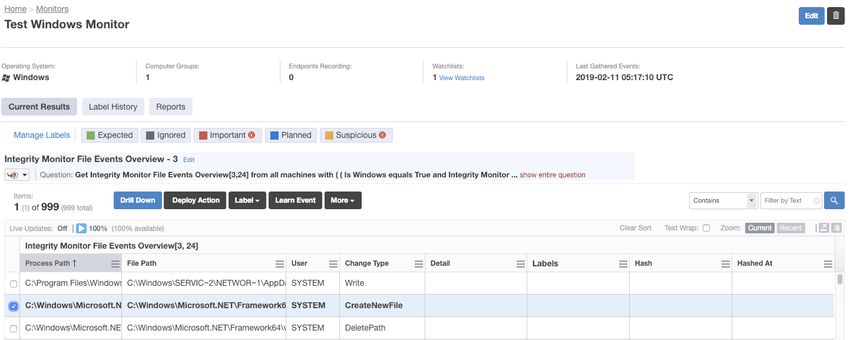
Requirements
Review the requirements before you install and use Integrity Monitor.

Tanium dependencies
 Component Requirement

 Tanium         Version 7.0.314.6422 or later
 Platform
                If you are using an older version, please contact your Technical Account Manager
                (TAM) before installing and using Integrity Monitor.

 Tanium         The event recorder is supported on the same Linux endpoints as the Tanium Client
 Client         and on endpoints with Windows NT 6.1 (Windows 7 / Windows Server 2008 R2) or
                newer. For more information about specific Tanium Client versions, see Client host
                system requirements.

                Integrity Monitor does not use the recorder for Solaris and AIX.

                For more information about deploying the Tanium Client to endpoints with
                different operating systems, see the Client Deployment Guide.

 Tanium         1.6.0 or later is required for monitoring endpoints with Windows NT 6.0 (Windows
 Index          Server 2008 / Windows Vista) or older.

                On endpoints with Windows versions 6.1 and newer (such as Windows 7 and
                Windows Server 2008 R2), Integrity Monitor does not use Index. The installation of
                any version of Index does not affect Integrity Monitor.

 Tanium™        4.0.0 or later
 Connect
                Requires a Connect license

Endpoint hardware and software requirements
Each endpoint device must have a minimum of 100 MB RAM. By default, the endpoint
database is 1 GB in size. There must be 2 times the maximum database size available in free
disk space on the partition where the Tanium Client is installed. The CPU demand on the
endpoint averages less than 1%.

Linux
Install the audit daemon and audispd plugins before deploying Integrity Monitor tools. The
minimum compatible version of auditd is 1.8; however, for the best results, use the most

 © 2019 Tanium Inc. All Rights Reserved                                                        Page 9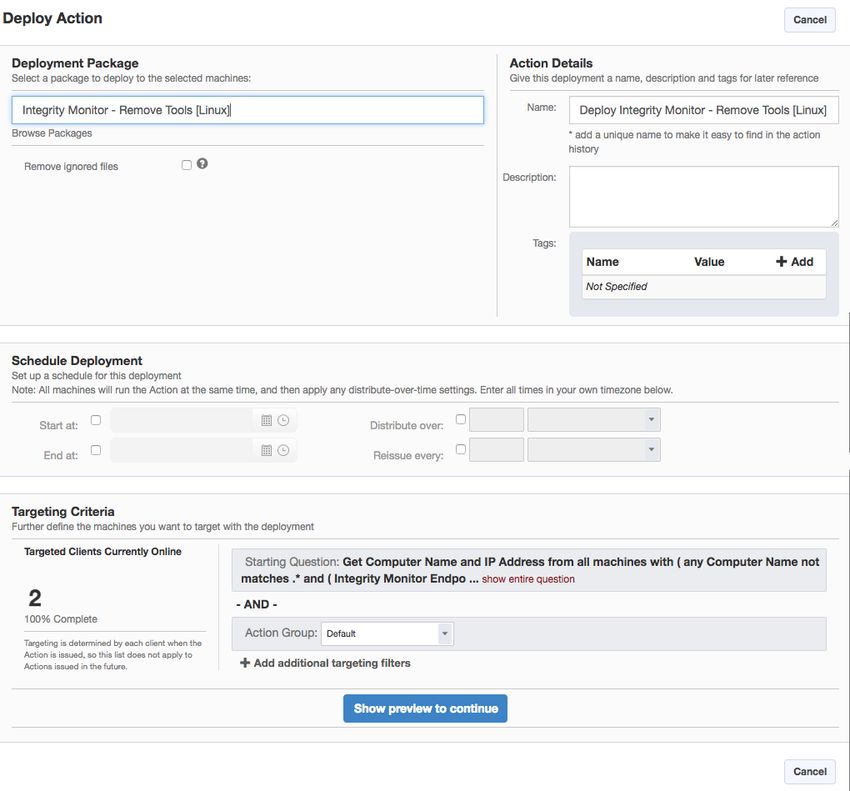
recent stable version. See the specific operating system documentation for instructions.

Be aware that the recorder appends its own rules to the end of the existing audit rules. If
the existing audit system is in an immutable mode, using the -e 2 flag, the recorder on
Linux is not supported.

Host and network security requirements
Specific processes are needed to run Integrity Monitor.

Security exclusions
If you use security software in your environment to monitor and block unknown host
system processes, your security administrator must create exclusions to allow the Tanium
processes to run without interference.

 Target device Process

 Tanium           \services\integrity-monitor-
 Module Server    service\node.exe

 Windows x86      l   \Tools\IM\TaniumSQLiteQuery.exe
 endpoints        l   \Tools\IM\TaniumExecWrapper.exe

 Windows x64      l   \Tools\IM\TaniumSQLiteQuery.exe
 endpoints        l   \Tools\IM\TaniumExecWrapper.exe

 Linux x86        l   /opt/Tanium/TaniumClient/Tools/Trace/recorder
 endpoints        l   /opt/Tanium/TaniumClient/Tools/EPI/TaniumEndpointIndex
                  l   /opt/Tanium/TaniumClient/Tools/EPI/TaniumExecWrapper
                  l   /opt/Tanium/TaniumClient/python27/python

 Linux x64        l   /opt/Tanium/TaniumClient/Tools/Trace/recorder
 endpoints        l   /opt/Tanium/TaniumClient/Tools/EPI/TaniumEndpointIndex
                  l   /opt/Tanium/TaniumClient/Tools/EPI/TaniumExecWrapper
                  l   /opt/Tanium/TaniumClient/python27/python

Service account user
The Integrity Monitor service account requires certain privileges to run background jobs
which include gathering endpoint statistics, sending labels to Connect, and evaluating
rules. See Installing Integrity Monitor on page 20 to create a service account user and
configure the service account within Integrity Monitor.

 © 2019 Tanium Inc. All Rights Reserved                                              Page 10
User role requirements
Tanium Server 7.0
The following user roles are supported in Integrity Monitor on 7.0:
Administrator or Content Administrator
Can create watchlists and create, deploy, and view results for monitors.
Tanium 7.1 or later
Integrity Monitor 1.2.1 introduces role-based access control (RBAC) permissions that
control access to Integrity Monitor functions. The four predefined roles are Integrity
Monitor Admin, Integrity Monitor Author, Integrity Monitor User, and Integrity Monitor Read
Only User.
Table 1: Integrity Monitor user role privileges for Tanium 7.1.314.3071 or later
Privilege Integrity Integrity Integrity Integrity
Monitor Monitor Monitor User Monitor Read
Administrator Author Only User
Show Integrity
Monitor
View the
Integrity
Monitor
workbench.
Integrity Monitor 1 1 1 1
Use API
Integrity Monitor 1 1 1
Monitor Event
Labels Read
View monitor
event labels.
© 2019 Tanium Inc. All Rights Reserved Page 11Privilege Integrity Integrity Integrity Integrity
Monitor Monitor Monitor User Monitor Read
Administrator Author Only User
Integrity Monitor 1 1
Watchlists Read
View
watchlists.
Integrity Monitor 1 1
Rules Read
View rules.
Integrity Monitor 1 1 1
Monitor Events
Read
View monitor
events.
Integrity Monitor 1 1
Monitors Read
View monitors.
View and
download
reports.
Integrity Monitor 1
Settings Read
View general
settings,
templates, and
default labels.
© 2019 Tanium Inc. All Rights Reserved Page 12Privilege Integrity Integrity Integrity Integrity
Monitor Monitor Monitor User Monitor Read
Administrator Author Only User
Integrity Monitor 1
Monitor Event
Labels Write
Create and edit
monitor event
labels and label
notes.
Send labeled
events to
Connect
manually.2
Integrity Monitor
Watchlists Write
Create and edit
watchlists.
Integrity Monitor
Rules Write
Create and edit
rules.
Integrity Monitor
Monitors Write
Create and edit
monitors.
Enable, disable,
or delete
reports for a
monitor.
© 2019 Tanium Inc. All Rights Reserved Page 13Privilege Integrity Integrity Integrity Integrity
Monitor Monitor Monitor User Monitor Read
Administrator Author Only User
Integrity Monitor
Settings Write
Update general
settings,
templates, and
default labels.
Integrity Monitor
Monitor Event
Labels Delete
Delete monitor
event labels
and notes.
© 2019 Tanium Inc. All Rights Reserved Page 14Privilege Integrity Integrity Integrity Integrity
Monitor Monitor Monitor User Monitor Read
Administrator Author Only User
Integrity Monitor
Execute Scheduled
Task
Execute tasks
in the IM
service via the
IM schedule
plug-in,
including
sending labeled
events to
Connect via a
background
scheduled task
and scheduling
the weekly day
and time to
generate
reports.
Execute and
apply rules to
events.
Integrity Monitor
Deploy Monitors
Deploy
monitors.
© 2019 Tanium Inc. All Rights Reserved Page 15Privilege Integrity Integrity Integrity Integrity
Monitor Monitor Monitor User Monitor Read
Administrator Author Only User
Integrity Monitor
Troubleshooting
Create, check
the status of,
and download
the
troubleshooting
archive.
1 Denotes a provided permission.
2To send labeled events to Tanium Connect, you must have Connect installed. You must also
have the Integrity Monitor Monitor Event Labels Write permission and the Tanium Connect
Connect Event Write permission, which is provided through the Connect roles. The lowest
privileged Connect role that an Administrator can assign to grant this privilege is Connect User.
Table 2: Provided Integrity Monitor Advanced user role permissions for Tanium
7.1.314.3071 or later
Permission Content Set Integrity Integrity Integrity Integrity
for Monitor Monitor Monitor Monitor
Permission Administrator Author User Read Only
User
Execute plug-in Integrity
Monitor Events
Execute plug-in Integrity
Monitor
Read action Integrity
Monitor
Deployments
Read saved question Integrity
Monitor Events
© 2019 Tanium Inc. All Rights Reserved Page 16Permission Content Set Integrity Integrity Integrity Integrity
for Monitor Monitor Monitor Monitor
Permission Administrator Author User Read Only
User
Read sensor Reserved
Read sensor Integrity
Monitor
Deployment
Read sensor Integrity
Monitor Events
Write action Integrity
Monitor
Deployment
Write package Integrity
Monitor
Deployment
Write saved question Integrity
Monitor Events
Legacy deployment requirements
Endpoints are considered to be legacy if they are using Windows versions older than 6.1,
such as Windows XP, Windows Server 2008, or older. Windows Server 2008 R2 is not
considered legacy.
See Microsoft Windows Operating System Version for more information.
The following requirements must be met in order to monitor legacy endpoints:
l You must use Index 1.6.0 or higher.
l Index must be started separately. Integrity Monitor only deploys Index.
l Index must have finished its initial scan.
Permission recording
Linux
To monitor permission event types, there are no special requirements for Linux endpoints.
© 2019 Tanium Inc. All Rights Reserved Page 17Standard Windows
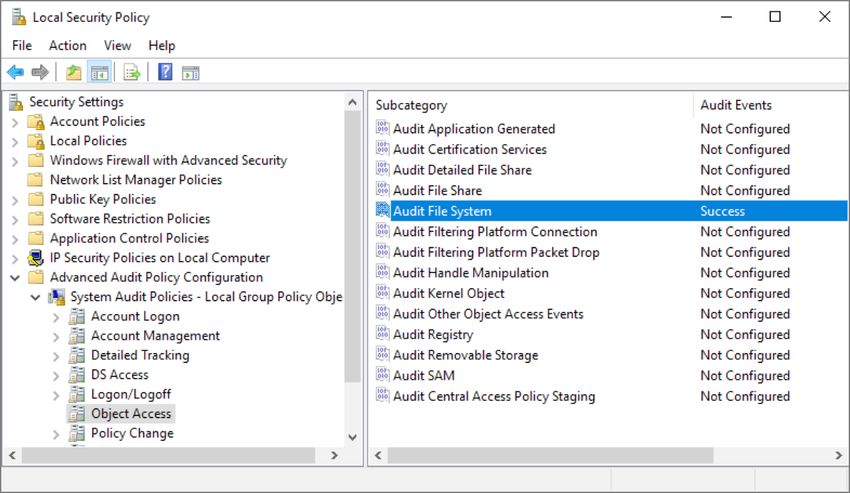
To monitor permission event types for Windows versions 6.1 and newer, you must
configure the Audit File System permission under Local Security Policy on the endpoint.
You can check to see if this permission is already configured using the Get Integrity
Monitor Endpoint Tools Status and Computer name from all machines sensor in Tanium™
Interact. You will get the following results if the permission is not configured:
Audit Policy for File System auditing is configured for: No Auditing
or
Audit Policy for File System auditing is configured for: Failure
and then
Error: Audit Policy for File System auditing is not properly configured
The following steps to configure the Audit File System permission might slightly vary
depending on your exact version of Windows.
Figure 1: Local Security Policy in Windows 10
1. Open Local Security Policy, usually found in the Administrative Tools folder.
2. Expand Advanced Audit Policy Configuration under Security Settings.
© 2019 Tanium Inc. All Rights Reserved Page 183. Expand System Audit Policies - Local Group Policy Object. 4. Double click Object Access. 5. Double click Audit File System. 6. Select Configure the following audit events: and then select Success. 7. Click Apply and then click OK. Legacy Windows By default, Integrity Monitor monitors permission event types for Windows versions 6.0 and older. Consult with your TAM if you choose to override this setting. © 2019 Tanium Inc. All Rights Reserved Page 19
Installing Integrity Monitor
Install Integrity Monitor
  1. Log in to the Tanium Console using an account with Administrator privileges.
  2. From the Main menu, select Tanium Solutions.
  3. Click Import X.X.X.X (where X.X.X.X is the current module version number) under
     Integrity Monitor.

         Note: Integrity Monitor is a Tanium licensed solution. If it does not appear on
         the Tanium Modules page, contact your TAM.

  4. If you are prompted, click Proceed with Import. Enter your credentials. This begins
     the Integrity Monitor installation and configuration process. After the Integrity
     Monitor installation and configuration process completes, you see the message
     Import completed successfully, and Integrity Monitor appears in the Main menu.

   Note: If you run into any issues while importing Integrity Monitor, contact your TAM.

Integrity Monitor home page
The Integrity Monitor home page shows endpoint statistics and initial tasks you need to
complete before using Integrity Monitor. Use the Manage Home Page link at the top right of
the page to configure the sections you see at start up. You might not need to see each
section once you have completed the initial tasks.

The Health graph and data on the Integrity Monitor home page shows the percentage of
endpoints with each OS-type recording.

Click Endpoints Recording to confirm what you want recorded is being recorded.

Create and configure an Integrity Monitor service account user
A service account user must be created and then configured within Integrity Monitor to run
background jobs which include gathering endpoint statistics as well as sending labels to
Connect. See Tanium Platform User Guide: Create a Module role to create a user with the
following privileges:

 © 2019 Tanium Inc. All Rights Reserved                                              Page 20
l Connect User role privilege (for non-RBAC systems, Question Author role) is required
to send labeled events to Connect.
l Read Saved Question for the Integrity Monitor Events content set (for non-RBAC
systems, Read Only User role) is required to retrieve endpoint statistics.
Note: It is a best practice to assign the All Computers group to the service account
user for access to any endpoints assigned to monitors. Otherwise, every time you
add a computer group to a monitor, you will also need to assign that computer
group to your service account for Integrity Monitor. Failure to do this will cause
issues running configured rules.
The service account must then be configured within Integrity Monitor.
1. After you install Integrity Monitor, a Required Integrity Monitor Settings: Set Service
Account yellow banner appears across the top of the Integrity Monitor Home page if
no service account has been set up. Click Configure Now.
2. Next to Background Process Settings on the General Settings tab, click Configure
Service Account.
3. Enter the Username and Password for the service account user you created and click
Save.
© 2019 Tanium Inc. All Rights Reserved Page 21Note: From the Home page, click Settings at the top right and, under General Settings, click Configure Service Account to change the service account at any time. Align content when upgrading If you are upgrading to Integrity Monitor 1.2.1 or later on Tanium Server 7.1 or later to use role-based access control (RBAC) functions, you must align Integrity Monitor content, such as packages, saved questions, etc., in Tanium in order for your deployments to work properly. Note: You must have the Tanium Administrator role to see and use the Content Alignment page. 1. From the Main menu, under Content, select Content Alignment. 2. On the Content Alignment page, select Integrity Monitor. © 2019 Tanium Inc. All Rights Reserved Page 22
3. Click Align Selected Content.

© 2019 Tanium Inc. All Rights Reserved   Page 23
Working with watchlists
Create a watchlist to define a set of files and/or directories you want to monitor for any
changes.

Create a new watchlist
  1. Select Watchlists from the Integrity Monitor menu.
  2. On the Watchlists page, click Create a New Watchlist.
  3. In the Summary section, enter a Name and Description for the new watchlist.
  4. Select a Path Style.

 © 2019 Tanium Inc. All Rights Reserved                                               Page 24
5. Integrity Monitor ships with ready-to-use watchlist templates that contain critical files
    and directories that are typically monitored for Windows and Linux. In the Watchlist
    Templates section, select a template to add it to the new watchlist.
 6. Click Create. When you go to Watchlists in the Integrity Monitor menu, you will see
    the new watchlist listed. On the Watchlists page, you can select watchlists in bulk and
    use the Filter by name field to filter watchlists. Click the name of a watchlist on the
    Watchlists page to view the files and directories it includes.

© 2019 Tanium Inc. All Rights Reserved                                               Page 25
Note: The target operating system and paths must be consistent within a watchlist.
For example, you cannot add a Windows path to a watchlist targeting a Linux
operating system.
Edit a watchlist
1. On the Watchlists page, click on a watchlist.
2. Click Edit in the top right corner.
3. In the Edit Watchlist window, you can modify the Name, Description or Path Style for
that watchlist.
CAUTION: If you change the Path Style for a watchlist, you will be prompted that all
added paths will be removed once you confirm the change.
© 2019 Tanium Inc. All Rights Reserved Page 26To customize the types of changes monitored on files in a directory listed in a watchlist or
to add file exclusions for that directory:
1. Select the path to modify and click Edit Path.
2. In the Change Type section of the Edit Path window, click to select or remove the
type of change you want to monitor on that path.
3. Click Update to save your changes.
See Permission recording on page 17 for special procedures to monitor permission event
types for Windows recorder.
View watchlist details
To view the details for a watchlist, on the Watchlists page, click the watchlist you want to
view and click Expand next to the path.
© 2019 Tanium Inc. All Rights Reserved Page 27The details you see for a watchlist depend on the role you are assigned in Integrity Monitor.
Add new paths
1. Click Add Paths at the top of the screen listing the files/directories for a watchlist.
2. Select New and provide the new path and the types of changes you want to monitor
on that path.
© 2019 Tanium Inc. All Rights Reserved Page 283. Click Add Path. The path will appear in the list of files/directories for that watchlist.
4. In the Exclusions section of the Add Path window, you can also choose to exclude a
specific sub-directory path or file by clicking + Add Exclusion and providing the path
and path type. You can use a wildcard (*) when defining file path type exclusions.
To add paths by importing them from files you have already configured for another
monitoring tool:
1. Under Add Paths, select Import From File and choose the appropriate file. Tanium
currently provides limited support for importing paths from Tripwire configuration
files, OSSEC configuration files, Tenable LCE policy files, and Tanium CSV files. An
example of a Tanium CSV file is shown below.
2. Click Import.
You can also add paths from templates by selecting Import From Template under Add
Paths.
© 2019 Tanium Inc. All Rights Reserved Page 29Example Tanium CSV file used to import paths
path,ops_create,ops_delete,ops_write,ops_rename,ops_
permission,excludes_type,excludes_spec
C:\autoexec.bat,on,on,on,on,,
C:\Windows,on,on,on,on,directory,NtServicePackUninstall
,,,,,,directory,NtUninstall
,,,,,,directory,Help
C:\Windows\assembly,on,on,off,off,on,file,*
C:\autoexec.bat,on,on,on,on,,
Will add a path “C:\autoexec.bat” that will turn on all of the supported event types
(create, delete, write, rename).
C:\Windows,on,on,on,on,directory,NtServicePackUninstall
,,,,,directory,NtUninstall
,,,,,directory,Help
Will add a path “C:\Windows” that will turn all of the supported event types (create,
delete, write, and rename) and adds 3 directory exclusions (NtServicePackUninstall,
NtUninstall, and Help).
C:\Windows\assembly,on,on,off,off,file,*
Will add a path “C:\Windows\assembly” that will turn on create and delete event
types and adds 1 file exclusion (*).
Filter files and directory paths
1. Use the Filter by name field at the top right of the page listing the files/directories for
a watchlist to show directories with only that text in the path name.
© 2019 Tanium Inc. All Rights Reserved Page 302. You can delete the filtered directories in bulk or change the types of changes being
monitored for files in those directories by selecting all.
3. Delete the text in the Filter by Text field to return to the full list of files/directories.
Export and import watchlists
You can export a watchlist if, for example, you created the watchlist in your QA/lab
environment and you want to move it to your production environment, or for backup
purposes.
To export a watchlist, open the watchlist and click Export at the top right of the page to
export that watchlist.
To import the watchlist, click Import at the top right of the Watchlists page and then select
the watchlist file in the Import Watchlist window. Click Import to import the file.
© 2019 Tanium Inc. All Rights Reserved Page 31Working with monitors
Use monitors to deploy watchlists to endpoints for continuous recording of file events
using monitors.
Create a new monitor
1. Select Monitors from the Integrity Monitor menu.
2. On the Monitors page, click Create a New Monitor.
3. In the Details section on the Create Monitor page, enter a Name and Description for
the new monitor.
4. In the Targeting section, select the Operating System.
5. Select Computer Groups from the drop-down list. For more information about
computer groups, see Tanium Platform User Guide: Managing Computer Groups.
© 2019 Tanium Inc. All Rights Reserved Page 32Note: If you select a computer group that contains Windows endpoints with
operating systems that do not match the operating system mode you selected
(standard or legacy), then these endpoints will not be monitored.
6. If you select Linux for the Operating System, select Event Monitoring, Hash
Monitoring, or both.
Event Monitoring
Use Event Monitoring to monitor change events, such as create, write, delete,
or rename, in real-time on files in the specified watchlist. Event Monitoring can
distinguish between similar types of changes, such as a rename versus a write
and delete. This method also provides more information about a change, such
as the associated user or process path. If you use Event Monitoring, you must
configure the advanced settings for Maximum Endpoint Database Size, Auditd
Raw Logging, and the CPU Kill Switch Threshold.
Hash Monitoring
Use Hash Monitoring to monitor changes to the file hash or metadata at regular
intervals in the specified watchlist. Hash Monitoring is required in some
environments. An advantage to this method is that the file integrity can be
verified even if a change event is missed. Auditd is not used with Hash
Monitoring.
Selecting both Event Monitoring and Hash Monitoring
If you select this hybrid monitoring mode (both Event Monitoring and Hash
Monitoring), you will still see changes to files from Hash Monitoring even when
the event recorder is down. Hash Monitoring alone will not report the
associated user or process path for an event. Selecting a hybrid monitoring
mode will also avoid reporting events that indicate a change from the operating
system but have no content or file hash change.
7. If you are creating an event monitor for Linux endpoints, expand the Advanced
Settings section and configure the following settings:
© 2019 Tanium Inc. All Rights Reserved Page 33a. Set the Maximum Endpoint Database Size. The default value for this field is
1024.
IMPORTANT: If you use Tanium™ Trace, and there is a different Maximum
Endpoint Database Size set in Trace, the larger setting will take effect. To
avoid this scenario, it is best to set the same size in both Integrity Monitor
and Trace.
b. Choose one of the following settings for Auditd Raw Logging:
l Disable raw logging on endpoints: disables writing logs to disk. Use this
setting for improved event throughput and lower CPU usage. Be sure that
you do not have other, non-Tanium processes that depend on reading
raw audit logs.
l Enable raw logging on endpoints: writes the raw logs to disk. This setting
increases the audit log volume on the endpoint.
l Do not change the logging settings on endpoints: audit log settings
remain as-is on the endpoint.
IMPORTANT: If you use Trace, and have different settings for Enable
Auditd Raw Logging in Trace, the Trace setting will take effect. To avoid
this conflict, it is best to use the same setting in both Integrity Monitor
and Trace.
© 2019 Tanium Inc. All Rights Reserved Page 34c. You can enable and define the CPU Kill Switch Threshold. This value specifies
the percent threshold for the CPU utilization kill switch for the recorder on
endpoints using this monitor. If the CPU utilization of the recorder exceeds this
value, the recorder will stop. The default value for this field is 25%.
8. In the Watchlists section, select one or more watchlists. Only watchlists for the
operating system you selected are shown.
9. Click Create. Your new monitor and associated details are shown.
Prioritize monitors
Prioritize monitors when two or more monitors include the same endpoint(s) in the
computer groups for each monitor. In the case of such a conflict, the highest priority
monitor is the one that is deployed to that endpoint.
To prioritize monitors
1. On the Monitors page, click Prioritize.
2. The monitors will appear in the Prioritize Monitors window. Drag monitors into the
order you want to prioritize them.
3. Click Cancel to go back to the original order of priority. Click Save to save your
changes.
4. When you re-prioritize monitors, the Deploy Monitors button will appear again. Click
Deploy Monitors to redeploy monitors in the new prioritized order.
© 2019 Tanium Inc. All Rights Reserved Page 35Deploy monitors
1. After you have created a monitor, click Deploy Monitors to see results.
2. In the Confirm Deploy window, click Yes. If you have more than one monitor, all
monitors will be deployed.
Note: When you deploy a monitor, you deploy all monitors. Whenever you take an
action on monitors (such as creating, modifying, re-prioritizing monitors) you will be
prompted to deploy all monitors. It is a best practice to create the monitors you
know you need and then deploy them at once.
Check status of deployed monitors
Use the Get Integrity Monitor Endpoint Tools Status and Computer name from all
machines sensor in Tanium™ Interact to check the status of the deployed monitor on
endpoints.
© 2019 Tanium Inc. All Rights Reserved Page 36Figure 2: Deployed Monitor Status
Refer to Troubleshooting on page 58 if you receive error messages when checking the
status of the monitoring of endpoints using this sensor.
Edit monitors
1. When you click on a monitor on either the Integrity Monitor home page or the
Monitors page, you can edit that monitor by clicking Edit in the top right of the page.
2. After editing a monitor, a Changes Pending: Deploy Monitors to Endpoints banner
displays on the Integrity Monitor home page and NEEDS DEPLOYMENT displays next
to the monitor on the Monitors page. Click Deploy Now on the Integrity Monitor
home page or Deploy Monitors on the Monitors page.
Understand the differences between standard and legacy monitoring
Standard Windows and Windows (Legacy)
Table 3: Standard Windows and Legacy Windows Features
Feature Standard Windows Legacy Windows
Real-time monitoring with Tanium Recorder
Interval hash based monitoring with Tanium Index
© 2019 Tanium Inc. All Rights Reserved Page 37Feature Standard Windows Legacy Windows
Records user and process path
Detects rename events
Event timestamp of actual change
Integrity Monitor behaviors on Legacy Windows with Tanium Index
l Integrity Monitor runs in platform-independent mode where it does not find file
change events in real-time. It detects the changes to files the next time it performs a
full-disk indexing scan. The time it takes to complete an indexing scan depends on
how many files and directories are on the disk. When Index finishes a scan, it will
sleep for the default time of one hour. If you wish to change this setting, consult with
your TAM.
l Integrity Monitor does not detect rename events in platform-independent mode.
Rename events will show up as a file delete of the old name and a file create with the
new name.
l The timestamp of events in the results grid is the time that the file event was detected
during the scan, not the time of the actual change.
l Integrity Monitor does not record event user or process path.
l Integrity Monitor causes the ExcludeFromIndexing setting in Index to be ignored. The
ExcludeFromHashing setting in Index will work as expected.
See Tanium™ Incident Response User Guide: Customize Index endpoint settings for more
information on the referenced Index settings.
AIX and Solaris
Legacy operating systems do not support real-time monitoring of file change events.
© 2019 Tanium Inc. All Rights Reserved Page 38Working with events
Integrity Monitor provides two sensors to view events:
l Integrity Monitor File Events Overview : Included columns for each event are process
path, file path, user, change type, date, hour, minute group, detail. The Integrity
Monitor Current Results page uses this sensor. Once you have deployed a monitor,
you can view resulting events by selecting that monitor and clicking Current Results.
Note: Using the minute group instead of the full event time stamp allows the
events to be grouped.
l Integrity Monitor File Events Details: Included columns for each event are time
stamp, process path, file path, user, change type, detail, watchlists. This sensor is
available to use in Saved Questions in Tanium™ Connect.
Run tools status sensor to resolve no results error
When an endpoint has no resulting events, the event sensors will display No integrity
violations found.
If [no results] is displayed, there is an error on the endpoint. Ask a question with the
Integrity Monitor Endpoint Tools Status sensor in Interact to identify the error. See
Tanium Interact User Guide: Asking questions for more information. See Reference:
Endpoint monitoring status errors on page 65 for help in resolving the error.
Learn event from current results
1. When viewing the current events for a monitor, you can create a rule from an event
by selecting that event and clicking Learn Event.
© 2019 Tanium Inc. All Rights Reserved Page 392. On the Create Rule page, the Rule Criteria fields will be pre-populated with criteria
from the event you selected.
3. Complete the other necessary fields and click Create.
To learn more about rules, see Working with rules on page 53.
Label current results
Use labels to annotate alarms as you review results to mark action that needs to be taken
on an event.
Following is the default label configuration in Integrity Monitor:
l Important
l Suspicious
l Expected
l Ignored
l Planned
The labels Important and Suspicious are configured to notify Connect. You will see the
Connect icon next to these labels.
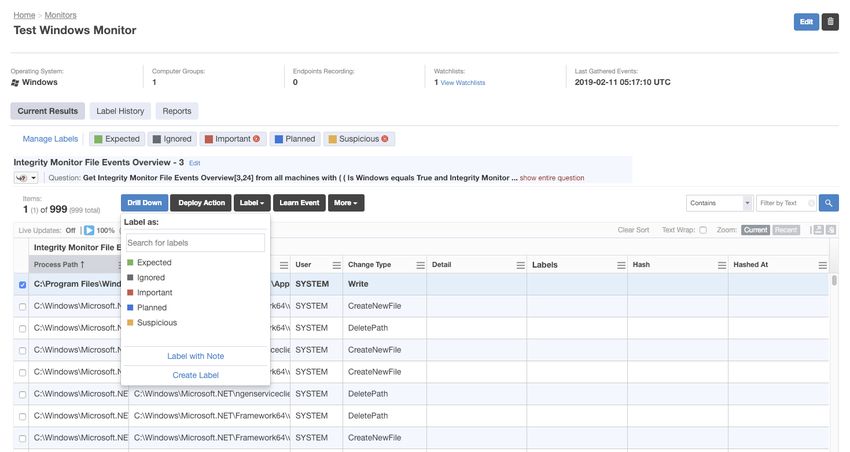
© 2019 Tanium Inc. All Rights Reserved Page 40In the results table for a monitor, select one or more events, click Label and assign labels to these events that will appear in the Labels column. Tip: Integrity Monitor provides shortcuts to labels using the number keys, assuming you have less than 10 labels. Each number corresponds to the order of the labels as they are listed across. For example, if Expected is the third label across in the list, then, if you hit the 3 key with a row selected, that row will automatically be labeled Expected. Hitting the 3 key again, while the row is selected and once it is labeled, will remove the Expected label. Use rules to enable auto-labeling and get notified of events of concern. See Working with rules on page 53. Remove a label from an event To remove a label from an event, simply follow the steps to apply the same label to that event. Select the event and then select the label from the Label drop-down list. © 2019 Tanium Inc. All Rights Reserved Page 41
Customize labels
  1. Click Settings     at the top right of the Integrity Monitor home page.
  2. Click the Labels tab.

  3. Click Edit Default Labels to change the label Name, Color, or Description. You can
     also specify whether or not that label is included in the results information sent by
     Connect. Any changes to default labels will affect every monitor.

         CAUTION: If you modify default labels, you will not be able to return to the
         default definitions.

  4. Click Edit Custom Labels next to a monitor to change the labels just for that monitor.
     Use Delete to delete any unnecessary labels.

Create a new label from a monitor page
  1. Select the event you want to label.
  2. From the Label drop-down menu, select Create Label.
  3. In the Create Label window, provide a Name for the label, specify a Color, and add an
     optional Description. Select Notify Connect if you want events with this label

 © 2019 Tanium Inc. All Rights Reserved                                                 Page 42
included in results information sent to Connect.
4. Click Save.
Add notes to labels
You can add notes to labeled events to provide additional information, such as action
being taken.
To add a note to an existing label and apply it to an event:
1. On the monitor page, select the event(s) in the results table to which you want to
apply the label.
2. From the Label drop-down menu, select Label with Note.
© 2019 Tanium Inc. All Rights Reserved Page 433. In the Label with Note window, select the label you want to apply from the Label
drop-down menu.
4. Enter a note in the Note field.
5. Click Save.
6. Once a label with a note is applied to an event, a note icon appears with the label.
You can mouse over the icon to see the note.
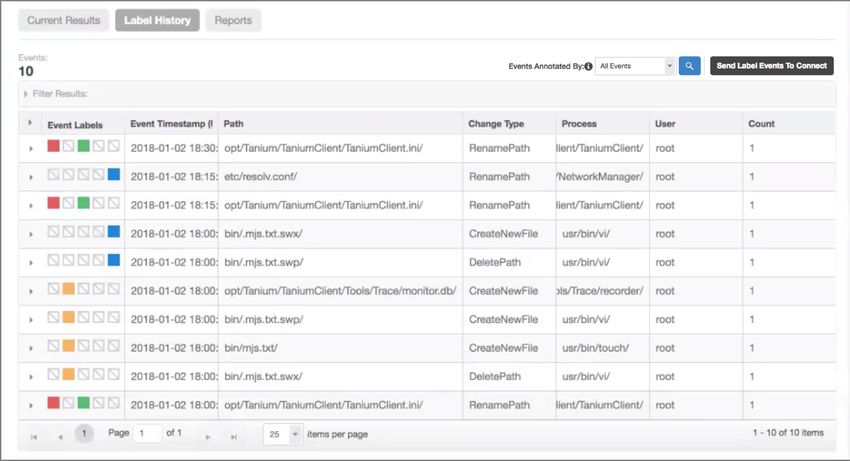
© 2019 Tanium Inc. All Rights Reserved Page 44Note: Labels with notes are applied individually to selected events. If you apply a label to an event after a note is applied to that label, that note will not automatically appear for that event. Remove a note from a label To edit a note or remove it from a label, modify the Note field in the Label with Note window to edit it or clear the Note field to remove the note. Using the Label History tab Click Label History to view historical records of how events have been labeled. Expand an event to see label details and any notes. © 2019 Tanium Inc. All Rights Reserved Page 45
Select one or more labels and click Manage Note to add or edit a note.

Enter a new note or edit a note in the Manage Note window and click Save.

Filter labeled events by expanding Filter Results at the top of results grid and specifying the
Select filter field, Select operator, and variable.

You can narrow results even further by adding additional filters. To do this, click to add
a row or a group and use the same fields. Click Search once you are done adding filters.

 © 2019 Tanium Inc. All Rights Reserved                                               Page 46
IMPORTANT:

   Integrity Monitor deletes labeled events from the label history after 30 days.

   Integrity Monitor will store up to 1 million labeled events. When you exceed 1 million
   labeled events, Integrity Monitor deletes the oldest labeled events to bring the total
   count back down to 1 million. Labeled events are kept for at least 72 hours after they
   are created, regardless of whether the total count is greater than 1 million in that
   time period.

   If reporting is enabled for a monitor and you exceed 1 million labeled events before
   the report is scheduled to run, Integrity Monitor will delete the oldest labeled events
   to bring the total count back down to 1 million. A new report will be created that
   includes events since the last report and any events that have been deleted.

Edit labels
On the monitor page, click Manage Labels. This will take you to the Settings page. Follow
the steps in Customize labels on page 42 to edit labels.

   Note: Refer to the Tanium Interact User Guide for more information on More, Drill
   Down, and Deploy Action functions.

Configure reports for current results
  1. From the Integrity Monitor home page or the Monitors page, either Create a New
     Monitor or select an existing monitor.
  2. Click the Reports tab.
  3. Click Enable Reports.

 © 2019 Tanium Inc. All Rights Reserved                                               Page 47
4. If you want to stop reporting at any time for a specific monitor, click Disable
reporting for this monitor on the right side of the page.
5. To see reports for a monitor, select the monitor and click the Reports tab. Reports
are listed showing the most recent one first. A report will show all label events for the
defined weekly report interval. Columns in the report for a monitor match the label
history for that monitor.
Note: The report will show labels that were created during the time interval
that the report covers, so if an event occurred outside that time range, but was
labeled within the time range, it will show up in the report. A report could cover
more or less than 7 days of labels if you change the report interval. Integrity
Monitor reports in this manner to prevent duplication or gaps in the reports.
Example 1: Reports run on Sunday at midnight. On Tuesday, you change the
report to run on Wednesday at midnight. The first report on Wednesday will
cover 3 days.
Example 2: Reports run on Sunday at midnight. On Thursday, you change the
report to run on Wednesday at midnight. The first report on Wednesday will
cover 10 days.
6. Download a report as a zipped CSV file using the Download link or delete a report by
clicking Delete .
Setting Weekly Report Schedule
By default, when you choose to run reports for a monitor, they are run every Sunday at
12:00 AM UTC. To change this default value
1. On the Integrity Monitor home page, click Settings at the top right to go to the
Settings page.
© 2019 Tanium Inc. All Rights Reserved Page 482. On the General Settings tab, change the Day of the Week and Time fields to the
Weekly Report Schedule you want for all reports.
Use Connect to send events
1. Once you have results, click Send all events to Connect at the top right of the page.
This will use events from the Integrity Monitor File Events Details sensor.
2. Click Yes in the Create Connection window. The connection is created with the
Integrity Monitor File Events Details saved question for that monitor as the source
and results are sent to a CSV file using the file destination via Connect.
© 2019 Tanium Inc. All Rights Reserved Page 493. Under All events connection at the top right of the page, click Edit to go to Connect
to modify the connection.
4. Once in Connect, you can change anything in the configuration such as the
Destination.
For more information about Connect, refer to the Connect User Guide.
© 2019 Tanium Inc. All Rights Reserved Page 50Use the Main menu to navigate back to Integrity Monitor.
Under All events connection, click Delete to remove the connection.
Send only labeled events
1. Click Label events connection at the top right of the results table. Labels marked with
a icon are configured to be sent via Connect. This will use events from the
Integrity Monitor File Events Details sensor. The same options (View, Edit, and
Delete) are available for this function as well. The connection is created with the
events enabled for that monitor as the source, and results are sent to a CSV file using
the file destination via Connect.
2. Click Send Data Now. A check mark will appear in the column to confirm that an
alarm is being sent via Connect.
Send labeled events at defined intervals
1. Click Settings at the top right of the Integrity Monitor home page.
2. Click the General Settings tab.
3. Under Background Process Settings, click Enable to send labeled events to Connect.
4. Adjust the Labeled Event Sync Interval to define a regular time interval that Integrity
Monitor sends labeled results to Connect and that Connect sends out these labeled
© 2019 Tanium Inc. All Rights Reserved Page 51results. The default value is 30 minutes. 5. Click Save. 6. Provide your Service Credentials and click Yes to begin the background process. © 2019 Tanium Inc. All Rights Reserved Page 52
Working with rules
Create rules to enable auto-labeling and get notified of events of concern.

Create a new rule

   Note: Rules can only be applied to a single monitor. An event that has already been
   reported will not be labeled by a newly created rule.

  1. Select Rules from the Integrity Monitor menu.
  2. On the Rules page, click Create Rule.
  3. In the Summary section, enter a Rule Name and Rule Description.

 © 2019 Tanium Inc. All Rights Reserved                                            Page 53
4. In the Rule Criteria section, select a filter field and operator from the drop-down lists
     and enter the criteria. Click the icon to add criteria.
  5. Click Apply.
  6. In the Labels section, select the Monitor to which you want to apply this rule and the
     Label you want to apply. Enter any optional Label Note.
  7. Click Create.

   Note: Once an event occurs that should be labeled, it might take an hour or more
   before it is labeled by a rule.

You can also import multiple rules from a CSV file.

  1. On the Rules page, click Import Rules.

  2. In the Import Rules window, click Choose File.
  3. Select the CSV file and click Open.
  4. Click Import. The imported rules will appear on the Rules page.

Example Tanium CSV file used to import rules

   name,description,note,monitor_id,label_
   id,field,operator,value
   app1 generated events,events generated by
   app1,CR12345,1,5,,,
   ,,,,,process,eq,C:/Program Files/app1/app1.exe
   ,,,,,file,contains,C:/Program Files/app1
   rule 2 name,rule 2 description,rule 2 note,1,5,,,
   ,,,,,event_timestamp,gt,2018-06-01T06:00:00.000Z
   ,,,,,event_timestamp,lt,2018-07-01T06:00:00.000Z
   ,,,,,file,contains,C:/Program Files

 © 2019 Tanium Inc. All Rights Reserved                                               Page 54
One line defines a rule. This example contains blank name, description, note, monitor_id,
and label_id fields, and defines all the filters for the rule. The filter processing for a rule is
complete when the next rule line is detected.
This CSV example contains two rules. Rule 1 defines two filters that are connected with the
AND operator.
Rule 2 defines three filters connected with the AND operator.
Deactivate a rule
If you no longer want a rule to run, you can deactivate it. On the Rules page, select the rule
you want to deactivate and click Deactivate; confirm deactivation. Deactivating a rule does
not delete any existing labels that rule applied
Note: If you want to reactivate the rule, you must clone it and save it.
Clone a rule
You cannot directly edit a rule due to auditing restrictions; however, you can accomplish a
similar result by cloning and then deactivating an existing rule.
1. On the Rules page, select the rule you want to clone and click Clone.
2. On the Create Rule page, fields are pre-populated with information from the rule you
cloned with the Rule Name followed by cloned [date and time].
3. Make any necessary edits to the rule and click Save.
Delete a rule
To delete a rule, on the Rules page, select the rule and click Delete; confirm deletion.
© 2019 Tanium Inc. All Rights Reserved Page 55CAUTION: If you delete a rule, you also delete all labeled events associated with that rule. © 2019 Tanium Inc. All Rights Reserved Page 56
Best practices
Defining watchlists
Be specific when defining watchlists. For example, watching the C:\ or / directories of
your endpoints will result in a lot of alarm activity just from normal operation. As a rule,
follow these guidelines:

   l   Add multiple specific file paths over a single directory path.
   l   If you must add a directory path, review that directory path for things to exclude (log
       files, log directories, temp directories, etc.).
   l   Keep your watchlists small and focused on specific items; having one watchlist for
       each application, software component, or system configuration area will help keep
       the system maintainable.
   l   Build up your monitors using many small watchlists. Remember that your monitors
       are associated with computer groups. Build one monitor per computer group and be
       as specific as you can to define the relevant watchlists for that computer group.

Setting up computer groups
Be specific when defining computer groups for Integrity Monitor targeting. Monitor
prioritization will be used when there is an overlap in the computer groups, but having
specific non-overlapping computer groups for monitors will result in a more predictable
deployment.

For more information about computer groups, see Tanium Platform User Guide: Managing
Computer Groups.

 © 2019 Tanium Inc. All Rights Reserved                                                Page 57
Troubleshooting
Collect logs
Collect logs within Integrity Monitor
Note: You must have either an Administrator or Content Administrator role in Integrity
Monitor to collect logs.
To collect logs required for troubleshooting
1. At the top right of the Integrity Monitor home page, click Help .
2. Click the Troubleshooting tab.
3. Click Collect and then click Download to get the zipped file required by Tanium to
assist you with troubleshooting.
Manually collect logs
If you are unable to collect logs within Integrity Monitor or need to collect logs manually:
1. Log in to the machine hosting the Tanium Module Server.
2. Go to C:\Program Files\Tanium\Tanium Module
Server\services\integrity-monitor-service-files and provide the
© 2019 Tanium Inc. All Rights Reserved Page 58files in this directory to Tanium to assist you with troubleshooting.
Remove Integrity Monitor tools
If needed, you can deploy a pre-configured package to remove Integrity Monitor tools from
an endpoint or computer group.
Linux
1. Using Interact or a Saved Question, run the Integrity Monitor Endpoint Tools
Status Sensor and the Is Linux Sensor.
2. From the Linux endpoints that have Integrity Monitors tools installed, drill down and
select the targets.
© 2019 Tanium Inc. All Rights Reserved Page 59© 2019 Tanium Inc. All Rights Reserved Page 60
3. Deploy the Integrity Monitor - Remove Tools [Linux] package to those targets.

Windows
 1. Using Interact or a saved question, run the Integrity Monitor Endpoint Tools
    Status Sensor and the Is Windows sensor.
 2. From the Windows endpoints that have Integrity Monitor tools installed, drill down
    and select the targets.
 3. Deploy the Integrity Monitor - Remove Tools [Windows] package to those targets.

© 2019 Tanium Inc. All Rights Reserved                                             Page 61
AIX
1. Using Interact or a saved question, run the Integrity Monitor Endpoint Tools
Status Sensor and the Is AIX sensor.
2. From the Windows endpoints that have Integrity Monitor tools installed, drill down
and select the targets.
3. Deploy the Integrity Monitor Endpoint Tools Removal [AIX] package to those targets.
Solaris
1. Using Interact or a saved question, run the Integrity Monitor Endpoint Tools
Status Sensor and the Is Solaris sensor.
2. From the Windows endpoints that have Integrity Monitor tools installed, drill down
and select the targets.
3. Deploy the Integrity Monitor Endpoint Tools Removal [Solaris] package to those
targets.
Specify Diagnostic Settings
1. To specify minimum log level, at the top right of the Integrity Monitor home page,
click Help .
2. Click the Troubleshooting tab.
3. Select the needed Log Level. The default for this setting is INFO.
Override Configuration Settings
While working with your TAM to troubleshoot an issue, you might need to upload a JSON
file to override low-level configuration settings.
CAUTION: Updating these settings without careful consideration can cause serious
system degradation. Do not override these settings unless you are working with your
TAM.
© 2019 Tanium Inc. All Rights Reserved Page 621. At the top right of the Integrity Monitor home page, click Help .
2. Click the Troubleshooting tab.
3. In the Configuration Override section, click Upload and browse to the JSON file.
4. Click Import.
Uninstall Integrity Monitor
IMPORTANT: Consult with your TAM before you uninstall Integrity Monitor in a production
environment so that you understand the potential repercussions.
1. From the Main menu, click Tanium Solutions. Under Integrity Monitor, click Uninstall.
Click Uninstall to complete the process.
2. Delete any remaining Integrity Monitor related scheduled actions and action groups.
3. Remove Integrity Monitor Tools from your endpoints. To see which endpoints have
the Integrity Monitor tools installed, ask the question Get Integrity Monitor Tools
Status from all machines. If any endpoints are returned by this question and you
want to remove Integrity Monitor Tools from the endpoint, contact your TAM.
4. The uninstall process creates a folder with a backup of the Integrity Monitor files
called integrity-monitor-service-files. If you have access to the file
system on the machine hosting the Module Server, you can keep or delete this folder.
© 2019 Tanium Inc. All Rights Reserved Page 63If any other Integrity Monitor artifacts remain on your Module Server, contact your
TAM.
© 2019 Tanium Inc. All Rights Reserved Page 64Reference: Endpoint monitoring status
errors
Standard Windows endpoint status error messages
Error: Redeploy "Integrity Monitor Endpoint Tools [Windows]", as the endpoint resident
status sensor code is outdated (minimum required version = )
[Recorder] The Tools Status sensor is not able to run because files on the endpoint
are out-of-date. Redeploy monitors to remedy.
Install needed
[Recorder] Need to deploy monitors so the tools are installed to start recording
events.
Error: Tanium Index config.ini not found
[Legacy] The Tools Status sensor was not able to find Tanium Index's config.ini
file.
Error: Tanium Index initial scan is Not complete
[Legacy] IM events will not be recorded until after Index's initial scan has completed.
Error: Tanium Index is Not running
[Legacy] IM events will not be recorded if Index is not running.
Platform is Not Supported
[Recorder and Legacy] The endpoint does not support IM. This means that either the
endpoint OS is too old to support the Event Recorder, or it supports Legacy Mode,
but does not have Index installed.
Redeploy "Integrity Monitor Endpoint Tools [Windows]" package, one or more
incompatible endpoint resident libraries were found (minimum required version =
)
© 2019 Tanium Inc. All Rights Reserved Page 65[Recorder] An out-of-date file was found on the endpoint. Redeploy monitors to
remedy.
Error: Minimum client version requirement not met
[Recorder] Will prevent Windows Recorder from starting or recording events. Update
Tanium Client to the required version as listed in Tanium dependencies on page 9.
Error: Failed to get status of file permission auditing:
[Recorder] A system error occurred when attempting to get file permission auditing
status.
Error: Minimum configured disk space requirements not met
[Recorder] Will prevent Windows Recorder from recording events. The Recorder has a
1Gb requirement. Due to backup operations, this means requirement is doubled, so
2GB is needed. Clear up disk space to start recording again.
Error: Missing the recorder database file, monitor.db
[Recorder] The recorder is presumably running, but no database file was found.
Error: Missing
[Recorder] Will prevent monitor saved questions from retrieving events from this
endpoint. Deploy monitors to resolve the missing file.
Error: File: : version found: required
[Recorder] Recording will continue on the endpoint, but saved question will not be
able to get events from the endpoint. Deploy monitors to resolve the version issue.
Error: Missing "TaniumSystemMonitor" from Event Tracing sessions
[Recorder] The recorder is not registered with the Windows ETW. No events will be
recorded.
Error: Missing the following Event Tracing providers ,,...
© 2019 Tanium Inc. All Rights Reserved Page 66You can also read