LEAP Research Report No. 48 - Visitor Survey Report Akaroa French Fest 2019 - Research ...
←
→
Page content transcription
If your browser does not render page correctly, please read the page content below
LEAP Research Report
No. 48

Visitor Survey Report
Akaroa French Fest 2019

Imke Range
Joanna Fountain

June 2020
i

Visitor Survey Report
      Akaroa French Fest 2019

                     Imke Range
                  Joanna Fountain

Land Environment and People Research Report No. 48
                      June 2020

                   ISSN 1172-0859 (Print)
                   ISSN 1172-0891 (PDF)
               ISBN 978-0-86476-443-0 (Print)
               ISBN 978-0-86476-444-7 (PDF)

    Lincoln University, Canterbury, New Zealand

                                                     ii
iii
Contents
Executive Summary ............................................................................................................. vii

Chapter 1 Introduction and Context ..................................................................................... 1
          1.1 Research objective .................................................................................... 1
          1.2 Research methods..................................................................................... 1
                1.2.1    Data analysis ............................................................................... 1
                1.2.2    Limitations .................................................................................... 1

Chapter 2 Findings .............................................................................................................. 3
          2.1 Visitor profile .............................................................................................. 3
                2.1.1       Demographic characteristics of the sample .................................. 3
                2.1.2       Frequency of visits ....................................................................... 4
                2.1.3       Visitor origin ................................................................................. 4
                2.1.4       Duration and type of stay ............................................................. 5
                2.1.5       Travel party .................................................................................. 6
                2.1.6       Means of transport ....................................................................... 7
                2.1.7       Visitor profile summary ................................................................. 8
          2.2 Marketing efforts ........................................................................................ 8
                2.2.1       Marketing channels ...................................................................... 8
                2.2.2       Decision making ........................................................................... 9
                2.2.3       Marketing summary.................................................................... 10
          2.3 Visitor engagement in FrenchFest ........................................................... 10
                2.3.1       Attendance ................................................................................. 10
                2.3.2       Overall festival experience ......................................................... 12
                2.3.3       Likely return ............................................................................... 12
                2.3.4       Visitor engagement summary ..................................................... 13
          2.4 Visitor satisfaction .................................................................................... 14
                2.4.1       Entertainment, atmosphere and content ..................................... 14
                2.4.2       Organisation and delivery........................................................... 15
                2.4.3       Value for money and visitor spending......................................... 17
                2.4.4       Event facilities and sites ............................................................. 18
                2.4.5       Food and beverage provision ..................................................... 24
                2.4.6       Overall satisfaction ..................................................................... 28
                2.4.7       Visitor satisfaction summary ....................................................... 29

Chapter 3 Recommendations ............................................................................................ 31

Chapter 4 Conclusion ........................................................................................................ 35

References ......................................................................................................................... 37

Appendix I – Is this the first time you have attended FrenchFest? ....................................... 39
Appendix II – How many times have you attended the FrenchFest? ................................... 40
Appendix III – How many times have you attended the FrenchFest .................................... 40
Appendix IV – Where are you from (Overseas visitor)? ....................................................... 41
Appendix V – What other ways did you hear about FrenchFest? ........................................ 42

                                                                                                                                    iv
List of Figures
Figure 1 - What is your gender? ............................................................................................ 3
Figure 2 - Which age group do you belong to? ...................................................................... 4
Figure 3 - Is this the first time you have visited Akaroa?........................................................ 4
Figure 4 - Where do you usually live? ................................................................................... 5
Figure 5 - How many nights are you staying? ....................................................................... 6
Figure 6 - Where are you staying? ........................................................................................ 6
Figure 7 - Who is attending FrenchFest with you? ................................................................ 7
Figure 8 - What is the main form of transport you are using on this trip? ............................... 8
Figure 9 - How did you first become aware of FrenchFest 2019? .......................................... 9
Figure 10 - Which of the following best describes your reason for visiting Akaroa at this
            time? ................................................................................................................... 9
Figure 11 - When did you make the decision to attend FrenchFest? ................................... 10
Figure 12 - How many hours did you spend at FrenchFest activities on each day of the
            festival? ............................................................................................................ 11
Figure 13 - Which events did you attend? ........................................................................... 12
Figure 14 - What have you enjoyed most about FrenchFest? ............................................. 12
Figure 15 - How likely are you to visit FrenchFest in the future? ......................................... 13
Figure 16 - How likely are you to recommend friends and family to visit FrenchFest ........... 13
Figure 17 - How would you rate your satisfaction with FrenchFest? - Quality of the
            entertainment .................................................................................................... 14
Figure 18 - How would you rate your satisfaction with FrenchFest? - Atmosphere at the
            event ................................................................................................................. 15
Figure 19 - How would you rate your satisfaction with FrenchFest? - Festival Content ...... 15
Figure 20 - How would you rate your satisfaction with FrenchFest? Organization and
            Delivery of the event ......................................................................................... 16
Figure 21 - Who do you think organises FrenchFest? ......................................................... 16
Figure 22 - How would you rate your satisfaction with FrenchFest? - Value for Money ....... 17
Figure 23 - How would rate the following elements of food and beverage provision? - Prices
            for food and drink .............................................................................................. 17
Figure 24 - Approximately how much did you spend on this trip to Akaroa per person? ...... 18
Figure 25 - How would you rate the following event facilities and/or sites? - Toilet Facilities 18
Figure 26 - How would you rate the following event facilities and/or sites? - Directional
            signage around the event.................................................................................. 19
Figure 27 - How would you rate the following event facilities and/or sites? - Provision of
            shade/ shelter ................................................................................................... 19
Figure 28 - How would you rate the following event facilities and/or sites? - Provision of
            seating .............................................................................................................. 20
Figure 29 - How would you rate the following event facilities and/or sites? – Parking .......... 20
Figure 30 - How would you rate the following event facilities and/or sites? – Cleanliness ... 21
Figure 31 - How would you rate the following event facilities and/or sites? – Safety............ 21

                                                                                                                                     v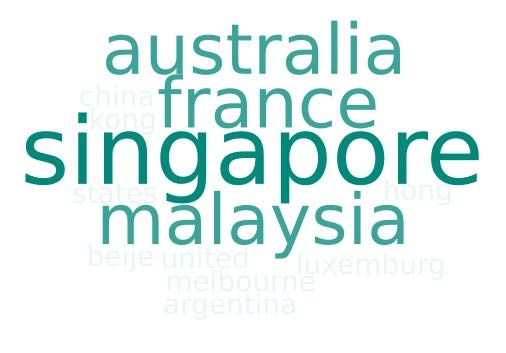
Figure 32 - How would you rate the following event facilities and/or sites? - Crowd control . 22
Figure 33 - How would you rate the following event facilities and/or sites? - Site Layout ..... 22
Figure 34 - How would you rate the following event facilities and/or sites? - Range of market
            stalls ................................................................................................................. 23
Figure 35 - How would you rate the quality of market stalls? ............................................... 23
Figure 36 - What suggestions do you have for improvements to event facilities and/or
            sites? ................................................................................................................ 24
Figure 37 - How would rate the following elements of food and beverage provision? – Staff
            service .............................................................................................................. 25
Figure 38 - How would rate the following elements of food and beverage provision? - Quality
            of food and drink ............................................................................................... 25
Figure 39 - How would rate the following elements of food and beverage provision? - Variety
            of food and drink ............................................................................................... 26
Figure 40 - Length of queues of food and beverage provision? - ......................................... 26
Figure 41 - Range of local foods ......................................................................................... 27
Figure 42 - What suggestions do you have for improvements to event food and
            beverages? ....................................................................................................... 27
Figure 43 - What other suggestions do you have for improvements to FrenchFest overall? 28
Figure 44 - How would you rate your satisfaction with FrenchFest? - Overall satisfaction with
            the festival ........................................................................................................ 28
Figure 45 - Is this the first time you have attended the Akaroa FrenchFest? ....................... 39
Figure 46 - How many times have you attended the FrenchFest? ...................................... 40
Figure 47 - How many times have you attended the FrenchFest? ....................................... 40
Figure 48 - Where are you from (Overseas visitor)? ............................................................ 41
Figure 49 - What other ways did you hear about FrenchFest? ............................................ 42

                                                                                                                                    vi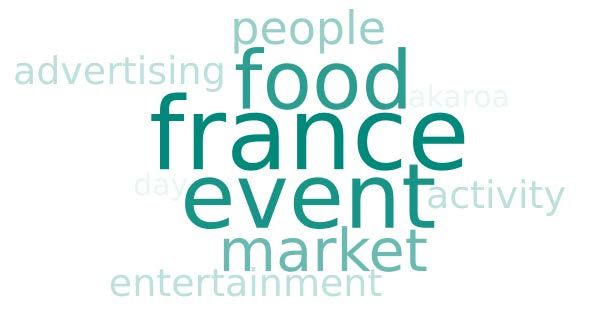
Executive Summary
This report presents the findings from a 2019 survey of visitors attending the FrenchFest in
Akaroa. The festival celebrates the arrival of the first French and German settlers in 1840,
and their interactions and relationships with local Maori, thereby establishing Canterbury’s
first European township (New Zealand Government, n.d.).
The survey analysis found that 82.9% of visitors have enjoyed the festival, in particular its
overall atmosphere, the parade and the performance of the landing. The majority of survey
participants thus would like to return in future years and recommend the festival to friends
and family. Based on these key measures, the festival was successful, however areas with
some room for improvement have also been identified.
Respondents, typically couples without dependable children, came primarily from
Christchurch and the wider Canterbury region by car. The typical visitor stayed in a holiday
home for two nights, however, Akaroa was also a very popular day trip destination during the
festival.
Respondents usually had planned their trip at least a month prior to the event, and the
festival was often the main or sole reasons for being in Akaroa. Awareness raised through
Facebook was common though personal recommendations and posters also proved to be
important marketing channels.
Respondents were most likely to attend the market on Saturday for an average of 4.7 hours.
However, this finding is likely partly due to survey recruitment taking place mostly during the
Saturday market. The Sunday program was less engaging than expected for many visitors
and few respondents reported attending the circus event. Overall though, visitors were
particularly pleased with the quality, atmosphere and offered attractions.
They were also happy with the organization and delivery of the event. Respondents were
further pleased with the toilet facilities and overall cleanliness, staff service, food quality as
well as the directional signage around the event. The safety, crowd management as well as
the layout of the site were additional areas of satisfaction.
A similar situation presents itself around the satisfaction of value for money. Visitors
commonly reported spending between NZ$20 - NZ$99 during their trip and perceived the
prices for food and drink overall as good.
Although most visitors perceived the provision of shade, shelter, seating, lengths of queues
as well as parking at the event as good, the rate of very satisfied visitors could be further
improved in these areas.
Food was seen as a particularly important aspect of the festival. The most complex results
are thus found around the range of market stalls which many were pleased with; however,
the rate of very high satisfaction could be increased. This also applies to the satisfaction with
the variety of food and drink and range of local foods. The strongest theme among
respondents was the wish to see an even greater emphasis on ‘Frenchness’ in particular via
the foods and drinks on offer as well as through activities.
In summary, close to 90% of visitors were satisfied with the festival and several areas for
further improvement have been identified. The most prominent of which relate to increasing
the program activities and ‘Frenchness’ of the festival.

                                                                                                 vii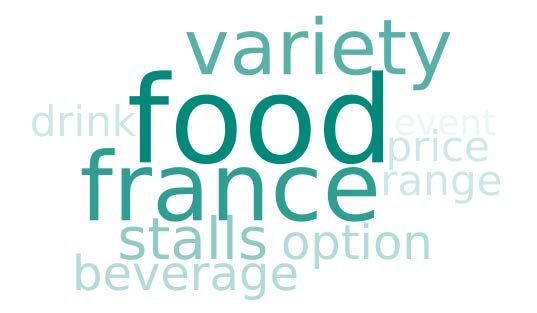
Introduction and context
This report provides findings and recommendations to the organizers of the FrenchFest, – a
biennial event taking place in October in the picturesque town of Akaroa. The festival
commemorates the 1840 landing of French and German settlers on the Banks Peninsula of
New Zealand’s South Island to join the local iwi. Their arrival and the relationships they
formed with local Māori saw the establishment of Canterbury’s first European township (New
Zealand Government, n.d.).

Findings are presented in several thematically arranged sections, each concluding with a
summary of most relevant findings. A chapter of recommendations is presented next,
followed by concluding remarks. The report is further supplemented by appendices.

1.1 Research objective
To assess attendee’s satisfaction with the event and to generate recommendations for
potential improvement of the FrenchFest.

1.2 Research methods
A team of researchers from Lincoln University were recruited by the organisers of the
FrenchFest to conduct a survey of attendees over the festival in October 2019. Survey
questions mainly related to the participant’s experience of various elements of the festival.
he researchers collected approximately 300 email addresses via convenience sampling and
sent a link to the online survey on the day after the festival. The survey link was also posted
on the festival’s social media pages. The survey was available in English as well as in
Mandarin and simplified Chinese. A total of 273 links were sent by email, and a total of 183
surveys were completed.

The quantative data in this survery was analysed using the SPSS software tool, while open-
ended qualitative responses were analysed thematically.

A limitation of this research is the relatively small sample size. Results can thus only be an
indication of trends and are not necessarily representative of all attendees. To allow a more
nuanced analysis the exact response count as well as the total response rate to each
question is presented in the findings.
A further limitation is the potential for sample bias as those who agreed to participate are not
necessarily representative. It is likely, for example, that international visitors that did not
speak English (or Chinese) were less likely to participate in the survey. Furthermore, most
respondents were recruited during the Saturday market, one of the most popular events of
the festival, representing another potential source of bias.

                                                                                                 1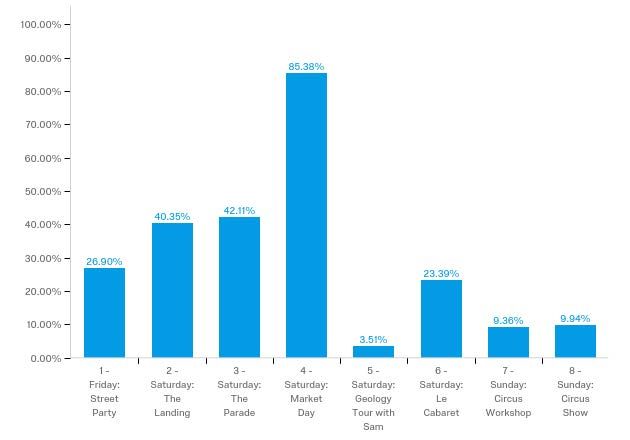
2
Findings
This chapter presents the findings resulting from the survey data analysis. The findings are
organised in several sections including ‘Visitor profile’, ‘Marketing efforts’, ‘Visitor retention’
and ‘Visitor satisfaction’. Each section concludes with a summary of key findings.

2.1 Visitor profile
At the start of the survey several questions were asked to establish a visitor profile; these
are presented in the following sections.

The majority of respondents were female with 65.03% (Figure 1). However, the age groups
where relatively evenly distributed. The mean age was 46 and 26-35-year olds represented
almost a quarter of respondents (Figure 2).

                                 Figure 1 - What is your gender?

                                                                                                      3
Of those that answered the question, 23.31% (38/163 respondents) are between 26-35
years of age Figure 2). 19.63% (32/163) were between 46-55 years old, 19.02% (31/163)
between 36-45, 17.18% (28/163) between 56 – 65 years old, 14.11% (23/163) 66 years or
older and 6.75% (11/163) between 18 - 25 years old.
Figure 2 - Which age group do you belong to?
Figure 3 shows that the majority of respondents (70.62%, 125/177) were repeat visitors to
Akaroa, while first time visitors constituted 15.82% (28/177). The final 13.45% of
respondents (24/177) lived in Akaroa; thus, the majority of survey respondents are visitors to
the town. The majority of respondents (66.48 %, 119/179 respondents) were attending the
FrenchFest for the first time (see Appendix I), with only 33.52% (60 /179) having attended
the festival before. This indicates that the rate of repeat visitors could be increased.
Most respondents who were repeat visitors to the festival had attended FrenchFest from 2-4
times (Appendix II). Further analysis shows that the average repeat attendance has been
3.38 times, indicating that visitors likely return multiple times once they have been to a
FrenchFest in previous years (Appendix III).
Figure 3 - Is this the first time you have visited Akaroa?
Figure 4 illustrates that the majority of respondents who were visiting Akaroa (57.89%,
88/152) live in Christchurch, followed by 13.16% (20 /152) living in wider Canterbury,
4indicating that the FrenchFest has a predominantly regional pull. A further 9.21% (14
/152) are visitors from various overseas destinations (further details in Appendix IV), 7.24%
(11/152) live in the North Island, while 5.26% (8/152) are from South Island regions outside
of Canterbury. A relatively small proportion (5.26% or 8/152) of respondents came other
parts of Banks Peninsula. Three respondents who were Akaroa residents (1.97%)
mistakenly answered this question.
Figure 4 - Where do you usually live?
The majority of respondents who stayed overnight were staying two nights (52.63%, 40/76);
25% (19/76) stayed one night, 15.79% (12/76) stayed three nights and only 6.58% (5/76
respondents) were staying four nights or longer, indicating that FrenchFest attracts tourists
predominantly for a weekend break (Figure 5).
5Figure 5 - How many nights are you staying?
Most overnight guests stayed in rented holiday homes (31.58%, 24/76; see Figure 6),
however, there is not just a singular preference as staying in one’s own holiday home
(14.47%, 11/76), with friends and family (17.11%, 13/76) or in a hotel (18.42%, 14/76) are
also common options. Fewer respondents reported staying at a Bed & Breakfast (6.58%,
5/76), to be freedom camping in a tent or a campervan (5.26%, 4/76) or at a Motor camp
(3.95%, 3/76). Only one respondent reported staying at a backpackers hostel.
Figure 6 - Where are you staying?
Figure 7 shows that most participants visit the festival together with their partner/spouse
(28.57%, 50 /175) or with their family (23.43%, 41/175). Similarly, 22.29% (39/175) visited
with friends or family and friends (12%, 21/175). Only 9.71% (17 /175) stated that they were
visiting on their own and 3.43% (6/175) indicated another travel party. Respondents were
least likely to visit as part of a tour group, with only one respondent giving this answer. This
shows that attending with a spouse, family and or friends are the most popular travel
party to FrenchFest. The majority of participants attended the festival without dependant
6children (73%, 125/175), while 27% (48/175 respondents) attended with children under the
age of 16. This indicates that FrenchFest has broader appeal to visitors without young
children.
Figure 7 - Who is attending FrenchFest with you?
The vast majority of visitors (86.18%, 132/152) used a private car to come to Akaroa (see
Figure 8). Only 5.26% (8/152) of respondents travelled by campervan or rental car (4.61%,
7/152). Even fewer respondents were travelled by shuttle bus (1.97%). None of the
respondents travelled by tour bus or bicycle. One respondent stated they had come by boat.
This indicates that people are reliant on private cars and the possibilities of
alternative travel modes should be investigated.
7Figure 8 - What is the main form of transport you are using on this trip?
Based on the previously presented findings, the following profile of a typical festival attendee
emerges: He/she has visited Akaroa previously but is attending the FrenchFest for the first
time and is likely to return for the next FrenchFest. If he/she has attended previously, they
are likely to return again. The typical attendee usually lives in Christchurch or Canterbury
and travels in their private car for either a day trip or a weekend getaway for two nights in a
rented holiday home together with their partner (or friends) but without children.
2.2 Marketing efforts
The following section presents the findings derived from several survey questions that aimed
to explore the marketing efforts of the festival organisers and decision-making processes of
respondents. A summary at the end of this section shows the most popular of the applied
marketing tools and strategies.
Figure 9 displays a word cloud of the 10 words used most often by respondents when asked
how they became aware of FrenchFest 2019. It shows that the largest group of respondents
first became aware via Facebook, however recommendations by friends as well as posters
in Akaroa and other towns also raised awareness significantly. This indicates that the active
Facebook advertisement has been highly effective in getting people’s attention. When
participants were asked through which other ways they heard about FrenchFest it became
evident that the physical posters have been noted significantly by participants and that
word of mouth through friends is of significance (Appendix V). In open-ended
questions some participants mentioned that they would like to see more advertisement on
Facebook, some would like to have the programme available at least a month before the
festival.
8Figure 9 - How did you first become aware of FrenchFest 2019?
Figure 10 shows that for the majority of respondents FrenchFest was the main reason to visit
Akaroa at this time (47.43%, 83/175 responses), while 25.71% (45/175) stated that
FrenchFest was only one of the reasons to visit Akaroa. A further 12.57% (22/175) of
respondents were not aware of the festival before they planned their visit and 14.29%
(25/175) reported living in the town.
Figure 10 - Which of the following best describes your reason for visiting Akaroa at this time?
9Figure 11 shows that a third of participants decided to attend the festival more than a
month before the event (34.29%, 60/175 respondents), although a quarter made the
decision in the week before the event (23.43%, 41/175), and 20% (35/175) decided to visit
on the day. Similarly, 22.29% made their decision in the month before the event (39/175).
This indicates that the majority of visitors take a long-term planning approach to their
decision making, but there is still a spontaneous group of festival attendees., This finding
can be seen as particularly relevant for the timing of future marketing efforts.
Figure 11 - When did you make the decision to attend FrenchFest?
In summary one can say that that the typical festival attendee decides to attend the festival a
month prior to the event, however, may also make his/her decision at any point up to the day
itself. Attending the festival was either their sole or one of the main reasons to visit Akaroa.
He or she became aware of the festival via Facebook, but recommendations by friends and
posters in Akaroa and other towns also raised awareness significantly, indicating the
effectiveness of marketing through social media, word of mouth as well as physical
advertisement across the region.
2.3 Visitor engagement in FrenchFest
Figure 12 shows that Saturday was the most popular day among respondents with 45% of
festival hours spent on that day. Attendance among participants on Friday and Sunday was
similar with 28% and 27% of the hours respectively. Upon further analysis it was determined
that a total of 791.5 hours were spent by 165 respondents on Saturday. This is an average
10of 4.7 hours spent by respondents at events on Saturday. A total of 83.6 hours has
been spent by 31 respondents on Sunday. This averages 2.69 hours for Sunday
attendance. A further 136.9 hours have been spent by 49 respondents on Friday, which
represents an averageone hour spent. This might indicates that there is room to extend
the programme beyond the Market day. Sunday appears to be a good option for
extension, given the number or respondents spending the weekend in Akaroa.
It should be noted that these results include answers by stallholders, who are likely to spend
more hours at the market minding their stalls than the average visitor..
Figure 12 - How many hours did you spend at FrenchFest activities on each day of the
festival?
In line with the previous finding, Figure 13 shows that the most attended event among
participants was the Market Day (85.38%, 146/171 respondents). Overall Saturday appeared
to be the busiest day for activities with 42.11% (72/171) attending the parade, 40.35%
(69/171) attending the dramatization of the landing and 23.39% (40/171) attending the
Cabaret on Saturday evening. The Friday Street Party was moderately popular with 26.90%
(46/171) of participants attending. Less frequently attended were the Sunday circus events
with 9.94% (17/171) respondents going to the show, and 9.36% (16/171) attending the
workshop. The smallest group of participants took part in the geology tour during the
Saturday market (3.51%, 6/171) though the tour actually had a large crowd of 40+
participants (observation by researchers).
11Figure 13 - Which events did you attend?
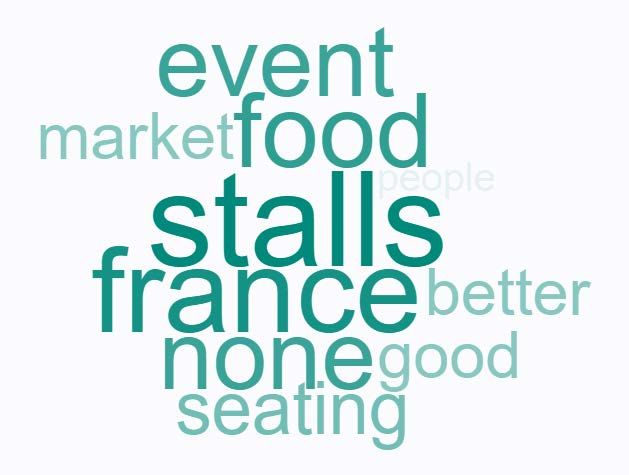
Figure 14 shows the 10 most common answers respondents gave when asked what they
enjoyed most during FrenchFest. The word cloud shows that people predominantly enjoyed
the overall atmosphere of the festival and the landing. The market with its food offerings was
furthermore a big contributor to people‘s enjoyment of the festival.
Figure 14 - What have you enjoyed most about FrenchFest?
Respondents were asked how likely they are to visit FrenchFest in the future (see Figure
15), with the majority of respondents likely (36%, 60/166) or very likely (34%, 56/166) to
12return. A fifth (20%, 33/166) are somewhat likely to return, while only 6% (10/166) feel it is
somewhat unlikely that they will return. A very small proportion stated it is unlikely (3%,
5/166) or not likely at all (1%, 2/166) to return. This shows that the majority of visitors
consider returning to the festival in a future year.
Figure 15 - How likely are you to visit FrenchFest in the future?
Figure 16 shows how likely participant are to recommend to friends and family a visit to
FrenchFest. The graph shows that the majority of respondents are likely (45%, 74/166) or
very likely (34%, 57/166) to recommend the festival to friends and family. A further 15%
(25/166) are somewhat likely while a very small proportion reported that they are somewhat
unlikely (3%, 5/166) or unlikely (3%, 5/166) to do this.
Figure 16 - How likely are you to recommend friends and family to visit FrenchFest
This section has shown that a typical visitor attends the festival on Saturday for an average
of 4.7 hours. If they also attend Friday and Sunday activities, they tend to spend between 1 –
3 hours at festival events on those days. Visitors enjoy the overall atmosphere of the festival
and in particular visiting the market where the food was seen as particularly important.
Further highlights were the parade and the performance of the landing. There is room for
improvement to the Sunday programme, with only a small number of respondents attending
13the circus events. It was further found that the majority of visitors are likely to return to the
festival in the future and would be recommending it to friends and family.
2.4 Visitor satisfaction
This section presents the findings on overall visitor satisfaction as well as respondents’
satisfaction with particular aspects of FrenchFest 2019. The quantitative findings are
primarily presented first, supplemented by qualitative findings.
Figure 17 shows that the majority of participants were either very satisfied (37.06%, 61/170)
or satisfied (44.71%, 80/170) with the quality of entertainment at the festival. A further
13.53% (23/170) of respondents were neither satisfied nor dissatisfied, while 2.35% (4/170)
reported being either dissatisfied or very dissatisfied with the quality of the entertainment.
Figure 17 - How would you rate your satisfaction with FrenchFest?
- Quality of the entertainment
The majority of participants was either very satisfied (47.06%, 80/170) or satisfied (40%,
68/170) with the atmosphere at the event (Figure 18). A further 7.65% (13/170) of
respondents were neither satisfied nor dissatisfied, 3.53% (6/170) was dissatisfied and three
respondents (1.76%) were very dissatisfied with the atmosphere.
14Figure 18 - How would you rate your satisfaction with FrenchFest?
- Atmosphere at the event
The majority of participants was either satisfied (45.88%, 78/170) or very satisfied (29.41%,
50/170) with the festival content (see Figure 19). For 19.41% (33/170) of respondents, the
festival content was neither satisfying nor dissatisfying. Only 2.94% reported being
dissatisfied (5/170) or very dissatisfied (2.35%, 4/170) with the festival content. These
numbers indicate that overall the content is perceived as satisfying, however, there also
appears to be room for improvement in this aspect.
Figure 19 - How would you rate your satisfaction with FrenchFest?
- Festival content
Again, the majority of participants was either very satisfied (45.29%, 77/170) or satisfied
(35.29%, 60/170) with the organisation and delivery of the event (see Figure 20), while
14.71% (25/170) had a neutral opinion, 2.94% (5/170) were dissatisfied and 1.76% (3/170)
were very dissatisfied.
15Figure 20 - How would you rate your satisfaction with FrenchFest?
Organization and Delivery of the event
A related question about festival organisation asked who respondents thought was behind
the organisation of FrenchFest, being given a range of options to choose between (see
Figure 21). Results show that the largest proportion of respondents (41%, 67/164) thought
the festival was organised by a team of community volunteers, while a third (34%, 55/164)
thought it was organised by a paid staff member supported by a team of community
volunteers. A much smaller proportion of respondents thought it was organised by a
professional team (6%, 10/164) or descendants of the early French settlers (4%, 6/164)
while 16% (26/164) stated that they do not know who organised the event. This shows that
the majority of visitors is aware of the volunteer involvement in the organisation of
the festival, however this could be communicated more strongly.
Figure 21 - Who do you think organises FrenchFest?
16Figure 22 shows that the majority of participants was either very satisfied (44.12%, 75/170)
or satisfied (34.12%, 58/170) with value for money of the event. For 18.82% of respondents
(32/170) the value for money of the festival was neither satisfying nor dissatisfying, while
2.35% (4/170) stated they were dissatisfied and one respondent very dissatisfied with this
aspect. These numbers indicate that most respondents view the value for money
positively.
Figure 22 - How would you rate your satisfaction with FrenchFest? - Value for money
The majority of participants perceived the prices for food and drink at the festival as good
(48.50%, 81/167) or very good (11.38%, 19/167; see Figure 23), however a third of
respondents reported a neutral response to this statement (32.93%, 55/167) and a further
6.59 % (11/167) felt it was poor, with one respondent stated prices were very poor. This
indicates that nearly all visitors (92.8%) perceived the prices for food and drink as
neutral an issue.
Figure 23 - How would rate the following elements of food and beverage provision?
- Prices for food and drink
Respondents were asked to estimate their spending for their trip to Akaroa per person.
Figure 24 shows that the majority (53.62%) of participants spend between NZ$20 and $99
with 26.51% spending $20-$49 and 27.11% spending $50- $99 (44/166 and 45/166
respondents). A further14.46% (24/166) estimated a spend of NZ$100 - $199 while 10.84%
17(18/166) spent between NZ$300 – NZ$ 500. A small proportion (10.24%, 17/166) spent less
than NZ$20.
Figure 24 - Approximately how much did you spend on this trip to Akaroa per person?
When asked to assess a ranger of event facilities and sites, the majority of participants
perceived the toilet facilities as good (42.35%, 72/170) or very good (22.94%, 39/170)
(Figure 25). For 30.59% (52/170) of respondents the facilities have been neither good nor
poor and only 4.12% perceived the facilities as poor (7/170). None of the respondents
perceived the toilet facilities as very poor. These numbers indicate that overall visitors
were satisfied with the toilet facilities.
Figure 25 - How would you rate the following event facilities and/or sites? - Toilet Facilities
Figure 26 shows that the majority of participants perceived the directional signage around
the event to be good (50%, 85/170) or very good (20.59%, 35/170). For 25.88% (44/170) the
signage was neither good nor poor, while 3.53% (6/170) perceived the signage as poor.
These numbers indicates that overall visitors have been satisfied with the directional
signage around the event.
18Figure 26 - How would you rate the following event facilities and/or sites?
- Directional signage around the event
The majority of participants perceived the provision of shade and shelter at the event as
good (45.29%, 77/170) or very good (14.12%, 24/170) (Figure 27). For 30.59% (52/170) the
provision of shade and shelter was neither good nor poor, while 10% of respondents
(17/170) perceived it as poor. No respondent perceived the provision of shade and shelter
as very poor. These numbers indicate that overall visitors have been satisfied with the
shade, however, there appears to be room for improvement to achieve a higher rate of
satisfaction.
Figure 27 - How would you rate the following event facilities and/or sites?
- Provision of shade/ shelter
Figure 28 shows that the majority of participants perceived the provision of seating at the
festival as good (36.47%, 62/170 respondents) or very good (16.47%, 28/170). For 32.35%
of respondents (55/170) the provision of seating was neither good nor poor. These numbers
indicates that although overall visitors have been satisfied with the seating, there is
room for improvement to achieve a higher rate of very satisfied visitors and to
decrease the proportion of visitors who perceived the seating as poor (12.94%, 22/170) or
very poor (1.76%, 3/170).
19Figure 28 - How would you rate the following event facilities and/or sites?
- Provision of seating
The majority of participants perceived the provision of parking at the festival as neither good
nor poor (41.18%, 70/170 respondents) or good (38.24%, 65/170) (Figure 29). Only 16.47%
(28 /170) of respondents perceived the parking provision as very good, however very few
respondents perceived parking as poor (3.53%, 6/170) and only one respondent rated it very
poor. These numbers indicates that overall visitors perceived the provision of parking as
adeqiate and there appears to be room for improvement to achieve a higher rate of
satisfaction.
Figure 29 - How would you rate the following event facilities and/or sites?
– Parking
Figure 30 shows that the majority of participants perceived the cleanliness at the festival as
good (54.71%, 93/170) or very good (37.06%, 63/170). Only 8.24% of respondents (14/170)
perceived the cleanliness as neither good nor poor and no respondents perceived it as poor.
This indicates that overall visitors were satisfied by the level of cleanliness at the
festival.
20Figure 30 - How would you rate the following event facilities and/or sites? – Cleanliness
The majority of participants perceived the safety at the festival as good (47.65%, 81/170) or
very good (42.35%, 72/170; Figure 31). Only 10% of respondents (17/170) perceived the
safety as neither good nor poor and none felt it was poor. Overall, visitors weren satisfied
with safety at the festival.
Figure 31 - How would you rate the following event facilities and/or sites? – Safety
The majority of participants perceived the crowd control at the festival as good (45.88%,
78/170) or very good (37.06%, 63/170). Crowd control was viewed neutrally by 17.06% of
respondents (29/170) and no respondent felt it was poor (Figure 32). Overall visitors were
satisfied with crowd control.
21Figure 32 - How would you rate the following event facilities and/or sites? - Crowd control
Figure 33 shows that the majority of participants felt the site layout at the festival as good
(47.06%, 80/170) or very good (34.71%, 59/170). Site layout was view neutrally by 14.12%
(24/170) and poor or very poor by 4.12% (7/170). This indicates that overall visitors were
satisfied with the site layout.
Figure 33 - How would you rate the following event facilities and/or sites? - Site Layout
Figure 34 shows that the majority of participants perceived the range of market stalls at the
festival as good (42.35%, 72/170) or very good (28.82%, 49/170), however a fifth were
neutral about the range of stalls (19.41 % 33/170) and 9.41% (16/170) rated them poor or
very poor. So while overall the majority of visitors were satisfied with the range of
stalls, there is room for improvement.
22Figure 34 - How would you rate the following event facilities and/or sites?
- Range of market stalls
The majority of respondents felt the quality of market stalls at the festival as good (45.29%,
77/170 respondents) or as very good (30%, 51/170), however again 20% of respondents
(34/170) were neutral about the stall quality, and 4.71% (8/170) felt the stall quality was poor
or very poor. As with the range of market stalls, while visitors are generally satisfied
with the quality of the stalls, there is room for improvement.
Figure 35 - How would you rate the quality of market stalls?
A word cloud of the 10 most frequently mentioned words when participants were asked what
suggestions they have to improve the facilities or sites of the festival (Figure 36). While many
of the 167 respondents commented that they have no suggestions for improvements and are
happy with the way the festival is arranged, some respondents wished for more of the same,
i.e. an extended market day or more seating areas.
23Figure 36 - What suggestions do you have for improvements to event facilities and/or sites?
Perhaps the strongest theme among respondents was the wish to see a bigger emphasis
on ‘Frenchness’ via the foods on offer (e.g., offering ‘crepes’ instead of pancakes) and
overall more French themed stalls (further details in section 2.4.5). Some also wished for
the food stalls to be grouped together in one area rather than spread out.
A few respondents noted that if the weather had been either sunnier or rainier the shelter
provided would have become insufficient. There were also some issues with satisfaction
around the Cabaret, from respondents noticing a bad smell in the tent, to issues with the
layout of tables and the overall decoration of the tent impacting the view.
Some mentioned discontent with the festival programme, wishing for Friday events to be
more widely promoted and a clearer overview of the multi-day programme, and clearer
instructions on where activities were taking place. A few also wished for increased marketing
activities in general.
A particular focus of the survey was visitors’ experiences with food and beverages, and the
service of these, which is widely recognised as an important element of visitor satisfaction at
festivals. Figure 37 shows that the majority of participants perceived the staff service at the
festival as good (47.31%, 79/167) or very good (32.93 %, 55/167) although 19.16% (32/167)
were neutral about the quality of service. Only one person (0.60%) perceived service as
poor. Overall visitors were satisfied with staff service.
24Figure 37 - How would rate the following elements of food and beverage provision?
– Staff service
The majority of participants perceived the quality of food and drink at the festival as good
(53.89%, 90/167) or very good (25.15 %, 42/167; Figure 38), but again a fifth were neutral
about food and beverage quality (9.76 %, 33/167). Only two respondents (1.20%) rated food
and drink quality as poor. This indicates that overall visitors perceived the quality of food
and drink as satisfying.
Figure 38 - How would rate the following elements of food and beverage provision?
- Quality of food and drink
On the question of the variety of food and drink at the festival, the majority rated this as good
good (43.11%, 72/167) or very good (19.76%, 33/167), however it is somewhat concerning
that 28.74% of respondents (48/167) were neutral about the variety, and 6.5 % (11/167)
rated it as poor and 1.80% (3/167) as very poor (Figure 39). So while the majority of
visitors are satisfied with the food and drink variety, there is also room to improve
this element of the festival experience.
25Figure 39 - How would rate the following elements of food and beverage provision? - Variety
of food and drink
Figure 40 shows that the majority of participants perceived the length of queues at the
festival as good (41.32%, 69/167) or as very good (19.16%, 32/167). Still 35.33% (59/167)
perceived the queues as neither good nor poor, while 2.40% (4/167) perceived it as poor
and 1.80% (3/167) even as very poor. This indicates that overall visitors were accepting
of the queues, however, there also appears to be some room for improvement to
convert neutral responses to positive ones.
Figure 40 - Length of queues of food and beverage provision
Figure 41 shows that the majority of participants perceived the range of local foods at the
festival as good (48.50%, 81/167 respondents) or as very good (14.37%, 24/167). Still
23.95% (40/167) perceived the range of local food range neither good nor poor and 10.78%
(18/167) rated it as poor while 2.40% (4/167) felt it was very poor. Therefore it can be said
that visitors were generally satisfied with the range of local foods, but there is a
relatively large proportion who were not pleased with this range; a situation that could
be improved.
26Figure 41 - Range of local foods
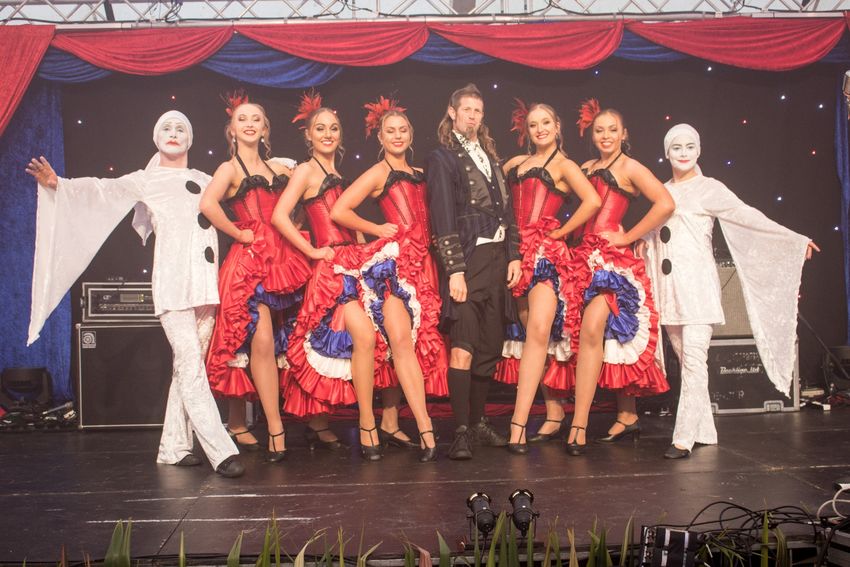
The word cloud below shows the 10 most prominent answers by participants when asked
what suggestions for improvements they have around the food and beverage element of the
event (Figure 42). This word cloud displays key words, so words such as: ‘none’, ‘great’,
‘good’, ‘better’, ‘nil’ have been removed.
Many of the 167 respondents who answered this question had no suggestions or stated they
were happy with the current offer, however, a relatively high number of respondents wished
for a larger variety of available foods, in particular French and local foods and
beverages. With regards to French food, respondents often mentioned French baked
goods, but also escargots or cheeses. Further common suggestions included lower priced
food options, a larger variety of alcohol-free beverages, and more vegan and vegetarian
options. Some people mentioned the queues and suggested more coffee stands and seating
areas.
Figure 42 - What suggestions do you have for improvements to event food and beverages?
Figure 43 shows a word cloud of the 10 most prominent answers by participants when asked
what suggestions for improvements they have overall for the festival. The word cloud was
adjusted by taking out the words: ‘none’, ‘better’, ‘good ‘to display a more informative visual.
As was the case in Figure 42, many of the 167 respondents did not have any suggestions or
stated they were happy with the current offer, but there was repetiton of the suggestions
outlined earlier, around increasing Frenchness’, more variety in food, and more seating.
27Other frequent suggestions included extending the programme on Friday and Sunday as
well as offering a wider range of particularly French themed activities (i.e. French
cooking class or wine tastings display of French national costumes). Many suggested more
outdoor entertainment (activities outside the main tent). Some respondents suggested live
music in the evenings as well as stalls located throughout the town, not just in one location.
Several respondents suggested a larger variety of activities for children (i.e. face
painting). A few respondents suggested extending the festival beyond the boundaries of the
town with specifically themed tours or stations in front of historic buildings, which could
provide information about former French settlers. Overall most of the suggestions were
for more events and activities, to be spread spatially (i.e. in a range of locations) and
temporally (over the full weekend).
Figure 43 - What other suggestions do you have for improvements to FrenchFest overall?
Figure 44 shows that most participants were overall either satisfied (47.06%, 80/170) or very
satisfied (35.88%, 61/170) with the festival. A relatively small proportion (10.59%, 18/170)
were neutral and only 4.71% (8/170) were dissatisfied or very dissatisfied (1.76%, 3/170)
with the event. With 82.9% at least ‘satisfied’, this suggests that overall visitors have
enjoyed the festival.
Figure 44 - How would you rate your satisfaction with FrenchFest?
- Overall satisfaction with the festival
28It can be said that the majority of visitors are satisfied with most aspects of the festival.
Visitors where particularly pleased with the quality of entertainment, the atmosphere at the
event and the festival content. They were also happy with the organisation and delivery of
the event, which they generally correctly identified as organised by a team of community
volunteers.
Attendees were satisfied with the toilet facilities and overall cleanliness, staff service, food
quality as well as the directional signage around the event. The safety, crowd management
as well as the site layout were other areas of satisfaction. A similar situation presents itself
around the satisfaction of value for money. Visitors commonly spent between NZ$20 -
NZ$99 during their trip and perceive the prices for food and drink overall as good.
Although most visitors rated the provision of shade, shelter, seating, lengths of queues as
well as parking at the festival as good, the proportion of visitors who are very satisfied with
these elements could be increased, while also addressed the issues by dissatisfied
attendees.
More complex are the findings around the range of market stalls which many respondents
were pleased with, but there is still room for improvement. This also applies to the
satisfaction with the variety of food and drink and range of local foods. The strongest theme
among respondents was the wish to see a bigger emphasis on ‘Frenchness’ in particular via
the foods and drinks on offer as well as through activities.
Overall however, it can be said that 82.9% of visitors have been satisfied with FrenchFest.
2930
Recommendations
Based on the previous findings this section presents recommendations for improvements of the FrenchFest.

 Theme              Issue                                           Recommendation                                          Justification
 Marketing          •   56.5% of visitors make their decision a     •   Start main phase of marketing campaign at           Based on marketing related findings
                        month or more prior to the event.               least 8-6 weeks prior to the event                  and on suggestions by participants
                    •   Visitors would like to have the             •   Include a schedule with a clear indication of
                        programme available earlier                     time and place of each event for all festival
                    •   Participants stated programme not clear         days
                                                                    •   Keep marketing going even on the day of the
                                                                        event for spontaneous visitors
                                                                    •   Focus campaign on social media as particularly
                                                                        Facebook has shown to be effective

 Marketing          •   Rate of repeat visitors could be improved   •   Design a multiyear marketing campaign that          Studies have shown that repeat
                        (currently at 33.5%)                            includes a collector’s item only available at the   visitors at festivals stay longer and
                                                                        festival, i.e. a t-shirt, a coin, the posters       spend more
                                                                    •   Discount on an event ticket for repeat visitors
                                                                        (i.e. need to present last years pass)
                                                                                                                            This survey showed that if visitors
                                                                                                                            return, they are likely to return for
                                                                                                                            multiple years. New visitors might
                                                                                                                            just require a bit of extra nudging

 Marketing/         •   Only 27% attended with their children       •   Actively market child friendly activities           Based on suggestions by participants
                        (under 16 years old).                       •   Offer face painting (free or small charge)
 Program            •   Participants suggested more child           •   French themed dress up contest for children
                        friendly activities

                                                                         31
• Inquire in planning phase through social media
polls what kind of child friendly activities
attendees would like to see
Programme • Few visitors on Sundays • Extend program & activities to Sunday Based on findings and suggestions
• Participants wish for more activities • Offer French Themed activities i.e. a cooking by participants
• Participants which for program extension class, wine tasting, French national costume
towards Sunday competition
• Extend market to Sunday as well
• Increase outdoor/walking entertainment such
as magicians, stilt walkers
• A French heritage tour
• A ‘scavenger hunt’ through different stations in
Akaroa
• Include all activities in program with clear
starting times & place
Accessibility / • 96 % travel either by car or campervan. • Arrange a shuttle bus between Christchurch Using public transport instead of
Only 1.97% travel with a shuttle bus. This and Akaroa for each day that arrives in Akaroa private cars reduces congestion,
Sustainability indicates that there is a lot of room to when main activity starts and leaves when main saves parking space in town.
foster alternative travel modes outside program finishes
private car for festival attendees to • Include shuttle bus in marketing -> highlight It is safer, the risk of being
increase sustainability. advantages i.e. can have champagne etc. killed/injured as a passenger is 7
• times lower in a bus.
Furthermore 45.3% of participants • Communicate through social media about
perceived Visitors the parking as less shuttle Public transport uses fuel more
than ‘good’ • Signs at entrance of Akaroa indicating several
parking spots, have parking referrers efficiently than private transport,
which reduces air pollution/emissions
(Ministry of Environment, 2018).
Site Set-up • 40% of visitors perceived the provision of • Improve shade and shelter by installing more Based on recommendations by
shade and shelter as less than ‘good’ sun-sails and tents participants
32Site set-up • Layout of Cabaret venue perceived as • Change lay out of tables: Round tables, make Based on recommendation by
unsatisfying in comments sure no poles hinder view participants
• Offer French themed food with table service,
tablecloths etc.
• - Air out the tent to get rid of bad smell
Food & Beverages • 39.5% of participants perceived the • Include more coffee stalls Based on recommendations by
lengths of queues as less than ‘good’ • - More stalls offering the same product to avoid participants
queues forming
Food & Beverages • 37.1% perceived the range of local food • Introduce more French cuisine made with local Based on recommendations by
ass less than ‘good’ products participants
• 28.8% perceived the range of market • Offer typical French products such as
stalls as less than good Escargots,French Wine and French Cheese on
• Participants wished for more the market
‘Frenchness’ • Advertise that local products are used
• Encourage local producers to present their
product under a clear ‘French’ theme
• Offer variety of French-themed alcohol-free
beverages
• Offer French-themed vegan and vegetarian
options
3334
Conclusion
In conclusion it can be said that the 2019 FrenchFest has been another successful
celebration. Across the investigated aspects of marketing efforts, visitor retention, and visitor
satisfaction, respondents were pleased with the event. However, the survey analysis also
identified a few areas of improvement, with a particular theme being the wish to see an even
greater emphasis on ‘Frenchness’ in particular via the foods and drinks on offer as well as
through activities. Building from the findings, recommendations in the areas of marketing,
program, accessibility, site-set-up as well as food and beverage provision can make a
contribution to further improve the visitor experience in future years.

                                               35
36
References
Kitterlin, M & Yoo, M. (2014) Festival motivation and loyalty factors. Tourism & Management
         Studies, 10(1). Pp. 119 – 126.
Ministry for the Environment (2018). The co-benefits of emissions reduction: An analysis.
        Ministry for the Environment. Pp. 1-35.
New Zealand Government. N.D. New Zealand History – Akaroa. Available at:
      https://nzhistory.govt.nz/keyword/akaroa [Accessed 20th January 2020]

                                             37
38
Appendices
Appendix I – Is this the first time you have attended
FrenchFest?
The majority of respondents are attending the FrenchFest for the first time (66.48
% 119/179 respondents), with only 33.52% (60 /179) having attended the festival before.
This indicates that the rate of repeat visitors could be improved.

        Figure 45 - Is this the first time you have attended the Akaroa FrenchFest?

                                            39
Appendix II – How many times have you attended the
FrenchFest?
The word cloud shows the ten most frequently given answers when asked how many times a
participant has attended the FrenchFest before. It appears that most participants, who had
been to the festival before, had the FrenchFest between 2-4 times.
Figure 46 - How many times have you attended the FrenchFest?
Appendix III – How many times have you attended the
FrenchFest
Figure 47 builds on the finding presented in figure 3 and shows the distribution of repeat
attendance. The average has been found to be 3.38 times, indicating that visitors likely
return multiple time once they have been to a FrenchFest in previous years.
How many times have you attended the
25 FrenchFest?
20
15
10
5
0
0 1 2 3 4 5 6 7 8 9 10
Figure 47 - How many times have you attended the FrenchFest?
40You can also read