Investigating External Interaction Modality and Design Between Automated Vehicles and Pedestrians at Crossings
←
→
Page content transcription
If your browser does not render page correctly, please read the page content below
Investigating External Interaction Modality and Design Between
                                                         Automated Vehicles and Pedestrians at Crossings
                                                              Sue Bai1 , Dakota Drake Legge1 , Ashley Young1 , Shan Bao1,2 , and Feng Zhou1

                                             Abstract— In this study, we investigated the effectiveness              Förster et al. [6] found that the participants in their study
                                         and user acceptance of three external interaction modalities                preferred a combination of the anthropomorphic design ex-
                                         (i.e., visual, auditory, and visual+auditory) in promoting com-             terior and a list of functions, where eye-contact and mouth
                                         munications between automated vehicle systems (AVS) and
                                         pedestrians at a crosswalk through a large number of combined               were important for humans to understand the robot. Jaguar’s
                                         designs. For this purpose, an online survey was designed and                Land Rover used a pair of eye-looking displays to mimic
arXiv:2107.10249v1 [cs.HC] 21 Jul 2021

                                         distributed to 68 participants. All participants reported their             direct eye contact with the pedestrians [7], which also proved
                                         overall preferences for safety, comfort, trust, ease of under-              to be useful to establish mutual trust between the AVS and
                                         standing, usability, and acceptance towards the systems. Results            pedestrians [8].
                                         showed that the visual+auditory interaction modality was the
                                         mostly preferred, followed by the visual interaction modality                  Another common method is to directly use verbal in-
                                         and then the auditory one. We also tested different visual                  formation (e.g., “Walk”, “Don’t Walk”). For example, de
                                         and auditory interaction methods, and found that “Pedestrian                Clercq et al. [9] found that verbal information delivered by a
                                         silhouette on the front of the vehicle” was the best preferred              textual display was regarded as the least ambiguous among
                                         option while middle-aged participants liked “Chime” much                    others. Mahadevan et al. [10] used a verbal message (“I
                                         better than young participants though it was overall better
                                         preferred than others. Finally, communication between the                   see you”) with a speaker to communicate AVS’ awareness
                                         AVS and pedestrians’ phones was not well received due to                    and three LEDs (yellow, red, and green) to show its intent.
                                         privacy concerns. These results provided important interface                The interface made use of both auditory and visual modal-
                                         design recommendations in identifying better combination of                 ities and were found to be most effective among the four
                                         visual and auditory designs and therefore improving AVS                     tested concepts. Wu et al. [11] leveraged dedicated short-
                                         communicating their intention with pedestrians.
                                                                                                                     range communications developed by Honda and Qualcomm
                                                               I. INTRODUCTION                                       through smartphones to preempt a possible collision between
                                                                                                                     a pedestrian and an approaching vehicle. Both visual (bright
                                            Automated driving is expected to bring many societal                     yellow color with full screen) and auditory signals (car
                                         benefits, such as decrease in vehicle crashes and increase in               horns and high-pitched beeps) were used to deliver alerts
                                         mobility [1]. The development of automated vehicle systems                  to pedestrians.
                                         (AVS) is progressing rapidly with options of different levels                  Several researchers [4], [5] conducted comprehensive re-
                                         of automation. The SAE standards [2] help AVS users,                        views of existing work on the interaction methods sorted
                                         operators, and manufacturers to reach a common expectation                  by technology, location, content, modality, and experimental
                                         of the vehicle’s capability and behavior from the vehicle                   tasks. Based on their results, the majority of the previous
                                         control perspective. However, on-road traffic does not just                 studies mainly focused on exploring visual modalities with a
                                         consist of AVS. Other road users, such as pedestrians,                      limited number of auditory warnings. In addition, there is no
                                         cyclists, and motorcyclists also need to share the road system              common protocols or a set of characteristics for standardizing
                                         and therefore interact with AVS, especially in situations and               designs across the industry and the academia. Furthermore,
                                         maneuvers that need confirmation and/or negotiation, such as                pedestrians’ reaction to AVS movements were also varied
                                         pedestrian crossing, four-way stop sign priority, and freeway               by regions between metropolitan areas and small coastal
                                         merge situations. Pedestrians are among the most vulnerable                 cities in Mexico [12]. If various AVS have non-consistent
                                         road users [3]. Therefore, the safety of pedestrians is one of              methods to communicate with all pedestrians, it can cause
                                         the most important safety areas to address for AVS design.                  confusion to all the road users [13]. Therefore, an easy-to-
                                            Pedestrians typically interact with human drivers to ex-                 understand and standardized approach for the AVS to interact
                                         change their intention through eye-contact, gestures, verbal,               with pedestrians would be necessary to improve road safety
                                         approaching speed, and relative distance [4], [5]. Therefore,               and efficiency by examining a large number of designs [3].
                                         researchers explored different ways by making use of these                     In this study, we aimed to test the effectiveness of different
                                         channels for the AVS to communicate with pedestrians.                       combinations of three modalities, including visual, auditory,
                                           1 Sue Bai, Dakota Drake Legge, Ashley Young, Shan Bao, and                and visual+auditory through video presentations and to iden-
                                         Feng Zhou are with Department of Industrial and Manufacturing, Sys-         tify the optimal design for AV-pedestrian interaction. More
                                         tems Engineering, University of Michigan, Dearborn, 4901 Evergreen          specifically, this study was designed to identify the best
                                         Rd, Dearborn, MI 48128, USA {baix, dlegge, ashleyly,                        visual and auditory warning displays by examining six visual
                                         shanbao, fezhou}@umich.edu
                                            2 Shan Bao is also with University of Michigan Transportation Research   designs (cross-bar, pedestrian silhouette, text display in front
                                         Institute, Ann Arbor, 2901 Baxter Rd, Ann Arbor, MI 48109, USA              and on the roof, face emojis, and no display), and five types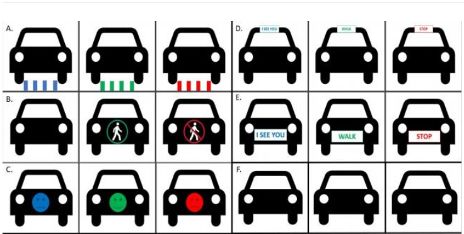
of auditory alerts (beep, chime, honk, human voice, and no trust, ease to understand, usability, and acceptance using
audio). We also investigated if there were any age-related a 7-point Likert scale (1 = strongly agree, 2 = agree, 3
differences in user acceptance. = somewhat agree, 4 = neither agree nor disagree, 5 =
somewhat disagree, 6 = disagree, 7 = strongly disagree).
II. METHOD Participants were also required to pick the most preferred
A. Participants one among six visual interaction designs, five auditory alerts,
To achieve the objectives, we designed and conducted a and options to sending alerts on smart phones or not. In
survey study using Qualtrics (Provo, UT). A total number of addition, participants were asked to state the reason for their
68 participants (33 females and 35 males) from the United preference selections as an open-ended question at the end
States participated in this survey study. The age distribution of the survey.
of the participants was as follows: 27% were between 16- Survey design. The survey had four sections. The first
23, 34% were between 24-39, 27% were between 40-54, and section consisted of a consent form describing the introduc-
12% were 55 or older. All the participants had a valid US tion and the purpose of the study; the second was designed
driver’s license and they were not compensated upon their to collect participants’ demographic information; the third
completion of the survey. One participant’s data was removed section provided all the combinations of interaction designs
due to incomplete data. Therefore, data from the remaining in videos in a random order, with the same pedestrian
67 participants were used in the final analysis. Our study was crossing scene. The participants were asked to watch the
approved by the Institutional Review Board at the University video and answer the questions followed, which were used
of Michigan. to measure the dependent variables introduced above. The
fourth section required the participants to pick one of their
most preferred one among six visual interaction designs (see
Fig. 1), five auditory alerts (chime, beep, voice, honk, and
no-audio), and the option of sending alerts on smart phones
or not, respectively. The estimated time to finish the survey
was about 45 minutes.
C. Procedure
First, each participant went through the four sections of the
survey as described above. Then, the participants were asked
to state the reasons on their selection optionally. Since there
were six visual interaction designs and five auditory alerts,
Fig. 1: AVS-pedestrian visual interaction inquiry options.
the participants were requested to evaluate a total number of
30 combinations and give the ranks of the six visual and five
B. Experiment design auditory designs, respectively.
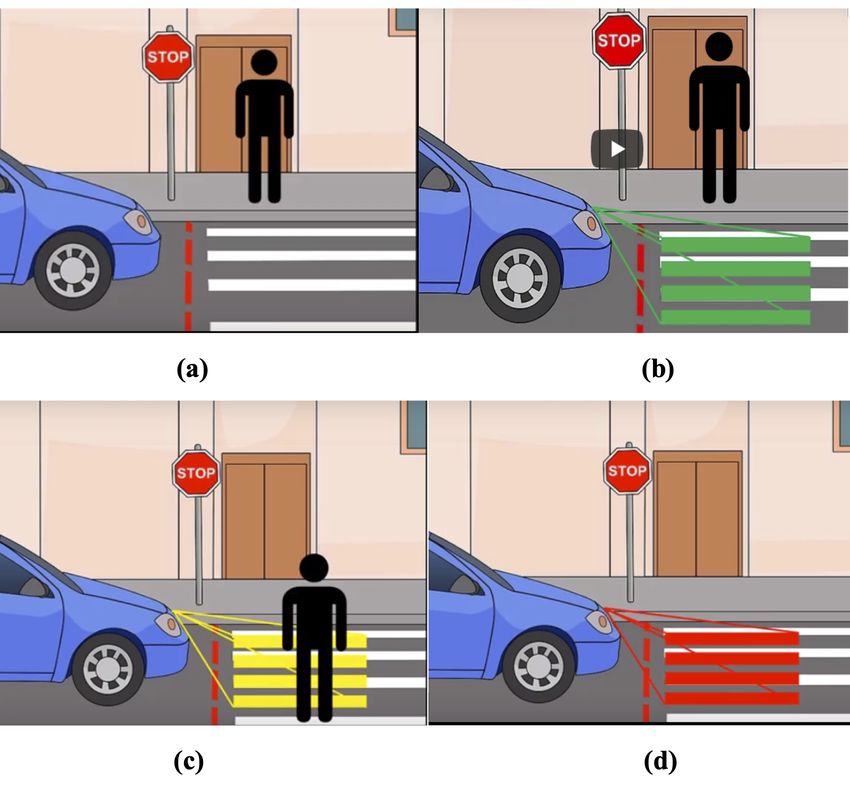
Independent variables. In this study, we conducted a D. AVS-Pedestrian Interaction Scenarios in Video
six by five within-subjects experiment. The first within-
As an example, Fig. 2 shows the screen shots of the
subject variable was visual interaction designs (see Fig. 1)
animation videos of the pedestrian crossing scenarios with
and the second within-subject variable was auditory alert
one combinations of one visual (i.e., cross-bar projection
types (chime, beep, voice, honk, and no-audio). This design
on the ground in front of AV) and audio (i.e., chime)
allowed us to examine participants’ preferences on AVS-
combination. The videos can be found by the following links:
pedestrian interaction modalities, i.e., visual, auditory, and
visual+auditory as well as design combinations. Note there • Visual: https://youtu.be/cZQ7OMhkWwE
was a control condition for the visual and auditory designs, • Auditory: https://youtu.be/8oAJuucjRfs
respectively, i.e., no visual or auditory information, which • Visual+auditory: https://youtu.be/
was used to test the auditory or visual modality alone. ZFwVM1ezhMU
Furthermore, we also tested whether they preferred to send In the visual condition, the video first 1) shows a pedes-
alerts to their smart phones or not. The order of independent trian standing at the side of a crossing point and the AVS is
variables were presented randomly to the participants. Be- stopping as shown in Fig. 2(a), then 2) the AVS projects a
sides, we considered age as another variable in the analysis green crossing-bar (“allowed to cross”, see Fig. 2(b)) on the
process by dividing the participants into two age groups, ground with a pedestrian walking, 3) the crossing-bar turns
young (≤ 39 years old, i.e., millennial or younger, sample yellow (“caution to cross”, see Fig. 2(c)), and finally 4) to red
size = 41) and middle-aged group (≥ 40 years old, sample (“not allowed to cross”, see Fig. 2(d)) without a pedestrian
size = 36). present. In the auditory condition, the AVS gives 1) three
Dependent variables. Based on the interaction designs sets of fast-paced chimes with one tone (“getting ready to
presented to the participants, we ranked their overall pref- cross”), 2) one continuous set of slow-paced chimes with two
erences and measured their perception on safety, comfort, tones (“allowed to cross”), 3) one set of fast-paced chimesFigure 3:Fig.
Preference mean ranks mean
3: Preference with standard
ranks errors
with ofstandard
three interaction
errorsscenarios
of threeandinteraction
age, where “1” ranks
the best and
Figure 3: Preference mean ranks with standard “3”ofranks
errors three the worst. scenarios and age, where “1” ranks
interaction
scenarios and age, where “1” ranks the best and “3” ranks the worst.
the best and “3” ranks the worst.
Fig. 2: Video screen sample of the visual condition.
with two tones (“caution to cross”), and 4) one set of fast-
paced chime with one tone (“not allowed to cross”). In the
visual+auditory condition, the three-colored crossing-bars in
the visual condition and four sound effects in the auditory
condition are overlaid in order. When no visual or no auditory
alert was combined with another auditory or visual design
shown to the participants, they were considered auditory only
and visual only.
E. Data Analysis
Figure4:4:Mean
Figure Fig.Mean ratingswith
4: ratings
Mean
where “7”
with standard
standard errors
ratings
“7” indicates
witherrors of
ofindividual
standard
indicates strongly agree
errorsdependent
individual
and “1”
dependentvariables of of
variables
of individual three interaction
three
dependent scenarios,
interaction
variablesscenarios,
Due to the fact that the sample sizes of the young group of three interaction where scenarios,strongly
whereagree
“7”and “1”strongly disagree.
strongly
indicates disagree.
strongly agree and “1”
Second, the participants were also asked to rate other measures, including safety, comfort, trust, ease to
and the middle-aged group were not the same and the Second, the participants
strongly were also asked to rate other measures, including safety, comfort, trust, ease to
disagree.
understand, usability and acceptance on a 7-point Likert scale. The results were shown in Figure 4. Two-way
Friedman test was not able to analyze multiple factors understand,
or usability and acceptance on a 7-point Likert scale. The results were shown in Figure 4. Two-way
mixed ANOVA after ART was used for each of the function measures assessment. For all the function
mixed ANOVA after ART was used for each of the function measures assessment. For all the function
measures, a significant main effect was found (Safety: !(2,130) = 42.25, - = 0.000; Comfort: !(2,130) =
interactions, we used the Aligned Rank Transform (ART) for measures, a significant main effect was found (Safety: !(2,130) = 42.25, - = 0.000; Comfort: !(2,130) =
nonparametric factorial data analysis [14]. ART first aligned Second, the participants were also asked to rate other
data before applying averaged ranks and then the common measures, including safety, comfort, 5
trust, ease to understand,
ANOVA procedures were used. The RStudio software and usability, and acceptance on5 a 7-point Likert scale. The
the ARTool package was used to conduct the statistical results were shown in Fig. 4. Two-way ANOVA after ART
analysis below. Note in this paper, the results mainly focused was used for each of the function measures assessment.
on the modality results across different combinations of For all the function measures, a significant main effect
designs between visual and auditory modalities. was found (Safety: F (2, 130) = 42.25, p = 0.000; Com-
fort: F (2, 130) = 38.09, p = 0.000; Trust: F (2, 130) =
III. RESULTS 51.81, p = 0.000; Ease to Understand: F (2, 130) =
56.53, p = 0.000; Usability: F (2, 130) = 70.45, p = 0.000;
A. Comparison Among Three Modalities
Acceptance: F (2, 130) = 39.22, p = 0.000). No main
First, two-way ANOVA after ART was used to test overall effects were found for age nor interaction effects. Post-
preference among three modalities and we found a significant hoc analysis with Turkey HSD correction showed that both
main effect for modality F (2, 130) = 38.52, p = 0.000, visual+auditory and visual were significantly rated better
but no effects for age or interaction effect as shown in than auditory (all p = 0.000). There was only one marginal
Fig. 3(a). Then we conducted post-hoc analysis with Turkey difference between visual+auditory and visual for Comfort
HSD correction and found the visual+auditory condition (p = 0.084).
was ranked significantly higher than auditory (p = 0.000)
and visual (p = 0.001) conditions and the visual condition B. Preferences of Visual Interaction Designs
was ranked significantly higher than the auditory condition The participants were asked to pick (indicated by “1”,
(p = 0.006). otherwise “0”) the most preferred one among six visualeffect was found as shown in Figure 5. Post-hoc analysis with Turkey HSD correction found that Option B
(Pedestrian silhouette on the front of AV) was ranked significantly better (all - = 0.000) than all other
options, except option A (Cross-bar projection on the ground in front of AV). Option A ranked significantly
better than option C (Face emoji on front of AV, - = 0.020), option D (Text display on the roof of AV, - =
0.002), and option F (no visual indication). Option E (Text display on front of AV) ranked significantly
Figure 6: Preference mean ranks with standard errors of five auditory alerts, where “1” ranks the best and “0”
better than option F. ranks the worst.
3.4 Preferences of Smart Phone Alerts
Finally, the participants were asked to pick (indicated by “1”, otherwise “0”) whether they would prefer alerts
on their smart phones. We used the two-way mixed ANOVA after ART and found that participants preferred
noFigure 5: Preference
smartFig.
phone5:alerts mean ranks with
significantly
Preference mean standard
better
ranks errorsphone
than smart
with of six alerts
standardvisual (!(1,65)
designs, where
errors “1” ranks
of =six14.83,
visual the best
-deaf/hard of hearing, and those wearing headphones, ear should leverage complementary effects between visual and
bugs, winter hats, hoods, etc.”). auditory cues in the design process.
Among the five auditory alerts, chime and human voices Among different types of visual interaction designs (see
tended to be the preferred ones overall (see Fig. 7). Chime Fig. 1 and Fig. 6), option B, i.e., Pedestrian silhouette on the
was less aggressive or annoying and resembled some cur- front of the AV tended to be preferred better among all the
rent cross walk signals better (P23: “Chiming seems less tested conditions. This was mainly because the participants
annoying”; P44: “Again resembles some of the cross-walk were familiar with the symbols and it was language inde-
types and would be the best to let people know”) and human pendent (P6: “Clear and similar to existing symbols”; P13:
voices was least confusing and most informative though it “Universal symbols”; P29: “Clear, unambiguous, language
was language dependent (P16: “can’t misinterpret”; P28: independent”) and the limitations of other designs (P7: “Pro-
“Think it would be most informative”; P48: “Voice would jections are risky. Words are too much effort. Simple pictures
be best/least ambiguous. Obviously would need to account are best, but smiley faces don’t provide enough context”).
for different languages, which could be a challenge”). Honk Compared to option B, option A (Cross-bar projection on
was rated to be annoying although it was easy to understand the ground in front of AV) was also better received and
its semantics (P5: “Honk for don’t walk or at least some very sometimes was perceived better than option B. This was
obvious sound for do not go. (Note that this will be annoying mainly because it was more natural to look at the road than
in crowded cites)”). at the vehicle (P23: “You can look at the road rather than
We did notice a significant difference between two age the car”; P28: “People normally look down or straight out
groups in terms of chime and beep. Young participants (P5: in front them while walking”). Although the text displays
“It’s the most practical”; P28: “beeps are small short and (option D or E) were probably least confused [9], they were
to the point”; P38: “...beep should be enough”) liked beep less universally recognized than familiar symbols, such as
significantly better than middle-aged participants. Middle- option A and option B (P59: “I think universal pictures
aged participant (P13: “Not as alarming”; P41: “Pleasant, are usually better than words”). Generally, the participants
calm, not annoying”; P60: “More of a pleasant sound”) tended to dislike the emoji face design (option C) mainly
liked chime significantly better than young participants. Such because it was not clear (P5: “. . . but smiley faces don’t
difference was mainly caused by the fact that middle-aged provide enough context”; P48: “. . . I have no idea what the
participants tended to prefer pleasant and calm alerts than smiley face means”). No significant difference for age or
annoying ones while young participants prefer beeps as they interaction effect was found which indicated that there was
were practical. a general consensus among the two age groups.
C. Alerts on smart phones
B. Visual Cues
Alerts sent to pedestrians’ personal smart phones were
Compared to auditory alerts, participants preferred visual not well received (see Fig. 4 (c)). This was mainly due to
cues better, which might be due to the fact that they were privacy concerns (P4: “I don’t want some strange vehicle
more familiar with the semantics of the visual cues. However, connected to my phone”; P16: “privacy concerns, and vehicle
one major concern for the visual interaction scenario was hacking”), availability issues (P15: “What if my phone is put
how to address those who were color blinded, visually away and out of reach?”) and distraction (P36: “Easy way to
impaired, or distracted (P64: “Much better than the audio distract oneself ”). Although the vehicle-to-pedestrian wire-
only, but no good for blind people”; P40: “only concern less communication technology was designed as an ad hoc
is everyone looks at their phone now, will they see and direct device-to-device communication without the needs to
understand...also what about bad weather”). In this aspect, exchange phone numbers. This explanation was not explicitly
designers might consider alternative modalities on top of stated in the survey. As a result, it led to the participants’
visual cues while considering individual characteristics of misunderstanding of the privacy intrusion and their negative
pedestrians and constantly changing technology usage pat- feelings towards such a type of the communication. Also,
terns. Another concern was that the participants were not sure no significance between the two age groups or interaction
that such visual projection with different colors on the ground effect was found. Thus, both of the two age groups had such
would be clear in different weather conditions (P21: “Would privacy concerns.
it work in the rain/ glare of the sun just the same?”; P66:
“Sunny days may make the projection hard to see so a second D. Limitations and future work
indicator on the car would help”). Therefore, such visual The web-based survey allowed us to reach a broader
cues need to be fully tested in various conditions before it participant pool with both qualitative and quantitative data.
can be implemented in AVS. Although we understood underlying reasons for their choices
Although the visual+auditory condition was rated the best to a large extent using qualitative data, it still limited the
(P24: “Overall clear and easy to understand”), the limita- value of the study due to the lack of in-person interaction
tions in the visual (e.g., visibility in the sunny condition) with more questions and answers, which may lead to valuable
or in the auditory (e.g., confusion between auditory cues) input on additional preferences or concerns that the partici-
conditions could still be applied. Therefore, the designers pants may express. In addition, we only surveyed participantswithin the U.S. with valid driver licenses using video interac- [7] A. Rouchitsas and H. Alm, “External human–machine interfaces
tion. Therefore, it should be cautious to generalize our results for autonomous vehicle-to-pedestrian communication: A review of
empirical work,” Frontiers in psychology, vol. 10, 2019.
to other contexts. In the real world, not all pedestrians are [8] M. Á. de Miguel, D. Fuchshuber, A. Hussein, and C. Olaverri-Monreal,
capable of driving a vehicle and understanding the vehicle “Perceived pedestrian safety: Public interaction with driverless vehi-
dynamics in general, and not all pedestrians can understand cles,” in 2019 IEEE Intelligent Vehicles Symposium (IV). IEEE, 2019,
pp. 90–95.
English. [9] K. De Clercq, A. Dietrich, J. P. Núñez Velasco, J. de Winter,
The age distribution was not very balanced, and not many and R. Happee, “External human-machine interfaces on automated
old participants (age 65 and over) were recruited. Therefore, vehicles: Effects on pedestrian crossing decisions,” Human factors,
vol. 61, no. 8, pp. 1353–1370, 2019.
further research is needed to gain more insights into older [10] K. Mahadevan, S. Somanath, and E. Sharlin, “Communicating aware-
and/or non-driver, non-English speaking pedestrian’s percep- ness and intent in autonomous vehicle-pedestrian interaction,” in Pro-
tion regarding intention communication with AVS. ceedings of the 2018 CHI Conference on Human Factors in Computing
Systems, 2018, pp. 1–12.
Furthermore, it was well agreed that the design to facilitate [11] X. Wu, R. Miucic, S. Yang, S. Al-Stouhi, J. Misener, S. Bai, and
communications between AVS and other road users should W.-h. Chan, “Cars talk to phones: A dsrc based vehicle-pedestrian
be standardized within the automotive industry in order to safety system,” in 2014 IEEE 80th Vehicular Technology Conference
(VTC2014-Fall). IEEE, 2014, pp. 1–7.
avoid confusion across various vehicle types. Therefore, it is [12] R. Currano, S. Y. Park, L. Domingo, J. Garcia-Mancilla, P. C. Santana-
important to reach some type of agreement throughout the Mancilla, V. M. Gonzalez, and W. Ju, “¡ vamos! observations of
automotive industry, government agencies, and the academia. pedestrian interactions with driverless cars in mexico,” in Proceedings
of the 10th International Conference on Automotive User Interfaces
and Interactive Vehicular Applications, 2018, pp. 210–220.
V. CONCLUSIONS [13] S. Deb, M. M. Rahman, L. J. Strawderman, and T. M. Garrison,
“Pedestrians’ receptivity toward fully automated vehicles: Research
This study investigated pedestrian’s preference in the inter- review and roadmap for future research,” IEEE Transactions on
face design for AVS to communicate its yield or proceeding Human-Machine Systems, vol. 48, no. 3, pp. 279–290, 2018.
[14] J. O. Wobbrock, L. Findlater, D. Gergle, and J. J. Higgins, “The
intention to the pedestrian at a crosswalk. An online survey aligned rank transform for nonparametric factorial analyses using
was created with three interaction modalities shown to the only anova procedures,” in Proceedings of the SIGCHI conference
participants as an animation video: visual+auditory, auditory, on human factors in computing systems, 2011, pp. 143–146.
and visual. The combination of audio and visual indication
was the most preferred among the participants, followed by
visual only and auditory only. In terms of visual interaction
designs, the pedestrian silhouette on the front of the AV
and the ground projection of the cross-walk bars were the
most preferred. Soft chime and human voices were the
preferred auditory designs. Due to the concern of privacy
intrusion, the smartphone-based alerts were not preferred.
Generally, there was not difference between the two age
groups tested except the preferences to chime and beep. Our
results gave guidelines about how to identify the best possible
combinations of visual and auditory designs for the AV
to communicate its intention to the pedestrian and showed
important design implications for the future communication
between AVS and pedestrians.
R EFERENCES
[1] J. Ayoub, X. J. Yang, and F. Zhou, “Modeling dispositional and
initial learned trust in automated vehicles with predictability and
explainability,” arXiv preprint arXiv:2012.13603, 2020.
[2] “Taxonomy and definitions for terms related to driving automation
systems for on-road motor vehicles,” SAE On-Road Automated Vehicle
Standards Committee, SAE International: Warrendale, PA, USA, 2018.
[3] J. Ayoub, F. Zhou, S. Bao, and X. J. Yang, “From manual driving to
automated driving: A review of 10 years of autoui,” in Proceedings of
the 11th International Conference on Automotive User Interfaces and
Interactive Vehicular Applications, 2019, pp. 70–90.
[4] H. Onishi, “A survey: Why and how automated vehicles should
communicate to other road-users,” in 2018 IEEE 88th Vehicular
Technology Conference (VTC-Fall). IEEE, 2018, pp. 1–6.
[5] A. Rasouli and J. K. Tsotsos, “Autonomous vehicles that interact with
pedestrians: A survey of theory and practice,” IEEE Transactions on
Intelligent Transportation Systems, vol. 21, no. 3, pp. 900–918, 2019.
[6] F. Förster, A. Weiss, and M. Tscheligi, “Anthropomorphic design
for an interactive urban robot-the right design approach?” in 2011
6th ACM/IEEE International Conference on Human-Robot Interaction
(HRI). IEEE, 2011, pp. 137–138.You can also read