The Changing Ocean Program Student Booklet 2021
←
→
Page content transcription
If your browser does not render page correctly, please read the page content below
The Changing
   Ocean Program
   Student Booklet
        2021

                   An Investigation into the effects
                   of abiotic factors on the
                   settlement & growth of planktonic
                   organisms.
                   Implications for our ocean’s future

iain@internationalmarinesciencedatabase.com              Iain Harrison – iharr28@eq.edu.au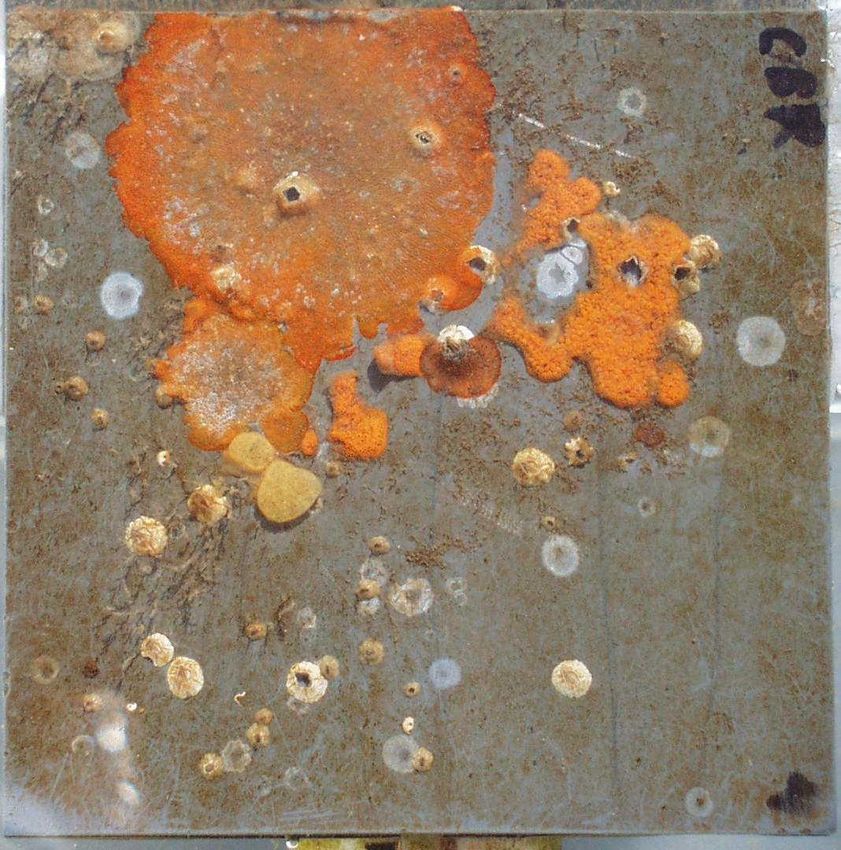
An introduction to biogeochemistry:

Planktonic Organisms

The Marine environment contains an abundance of life. The vast majority of organisms start their lives as
plankton. Plankton can be described as organisms that cannot “swim” against currents therefore they are at
the mercy of the oceans tidal and wind generated currents. Plankton tend to be small but some may be as
large as eight meters in length, such as the Lion’s Mane Jellyfish. Plankton can be classified into Zooplankton
(Animal-plankton) and Phytoplankton (Plant plankton). Organisms that spend their entire lifecycle floating
through the oceans as plankton are called Holoplankton (Plankton for the whole of their lives). Whereas the
organisms that develop into larger organisms and leave the plankton to walk on the ocean floor, swim freely
through the oceans or settle and grow on the ocean floor are called Meroplankton (Merely plankton for part
of their lifecycle).

Some examples of Meroplankton that will settle out of oceanic plankton are sessile sponges, barnacles,
bryozoans and other forms of motile invertebrates. Vertebrates such as fish larvae will also leave the
Meroplankton to become part of the Nekton. Algae can also settle out of the Meroplankton and take hold of
hard structures and substrates found in the marine environment.

The settlement of planktonic organisms onto hard, uninhabited substrate is a vital step towards supporting
biodiversity within the ocean environment. These pioneering plankton species biologically enhance regions
within the ocean and encourage other species to reside on or near the settled substrate through the provision
of resources.

Therefore, do we consider underwater construction within the coastal marine environment beneficial or
detrimental?

e: iharr28@eq.edu.au                                                                                              2
This investigation will use a submersible device that was developed by NOAA and the Smithsonian Institute
called the Autonomous Reef Monitoring Structure (ARMS).

Fig.1. Examples of Planktonic organisms; Decapod crab larvae, Trichodesmium and Copepoda [Harrison,
2009]

Autonomous Reef Monitoring Structure

The original ARMS was used to investigate the distribution and abundance of organisms that may be found
on coral reef systems globally. The ARMS units are composed of horizontal or vertical plates that are secured
to a weighted base plate. The structures are deployed for extended periods of time in the marine
environment. During this period a variety of planktonic organisms settle and grow on the plates. The ARMS
at Jacobs Well Environment Education Centre are being used to analyse the settlement of planktonic
organisms found in ocean waters entering the Gold Coast Broadwater system.

It can be hypothesised that the ocean water entering the Broadwater system at the mouth of the Gold Coast
Seaway will be relatively unaffected by large temperature fluctuations and high turbidity. Yet water moving
through the Broadwater system further away from the Gold Coast Seaway would carry a higher level of
turbidity and may display a higher degree of temperature variability.

This variability in turbidity and temperature may affect the settlement and the success of some
Meroplankton.

The vast majority of energy that is available on planet earth was provided by our Sun at the centre of our solar
system. Large amounts of energy arrive on our planet on a daily basis in the form of heat and light which can
be captured and used in a variety of ways.

e: iharr28@eq.edu.au                                                                                            3
Photosynthesis -

The vast majority of autotrophic organisms that reside on our planet use light as the energy source for the
production of an energy storage molecule called Adenosine Tri-Phosphate (ATP), which is then used by the
organism for metabolic processes and to produce simple and complex carbohydrates. These organisms that
produce their own ‘food’ are termed primary producers. The by-product of photosynthesis is the production
of oxygen which, of course, is required by all the aerobic organisms that perform cellular respiration.

The photosynthetic process can be represented using the following formula:-

                                     Sunlight

6CO2                   +   6H2O                             C6H12O6               +       6O2

Carbon Dioxide             Water     Chlorophyll            Carbohydrate                  Oxygen

Therefore, we consider photosynthesising organisms such as plants and algae to be a necessary link in the
chain of the carbon cycle, whereby these organisms sequester (absorb and lock away) large amounts of
carbon dioxide from the environment (atmosphere & hydrosphere) and release oxygen into the same.

Fig 2.a) Deployment.                                        Fig 2.b) Four weeks later

Fig. 2. ARMS deployed at Wave-break Island [Harrison, 2019]

e: iharr28@eq.edu.au                                                                                          4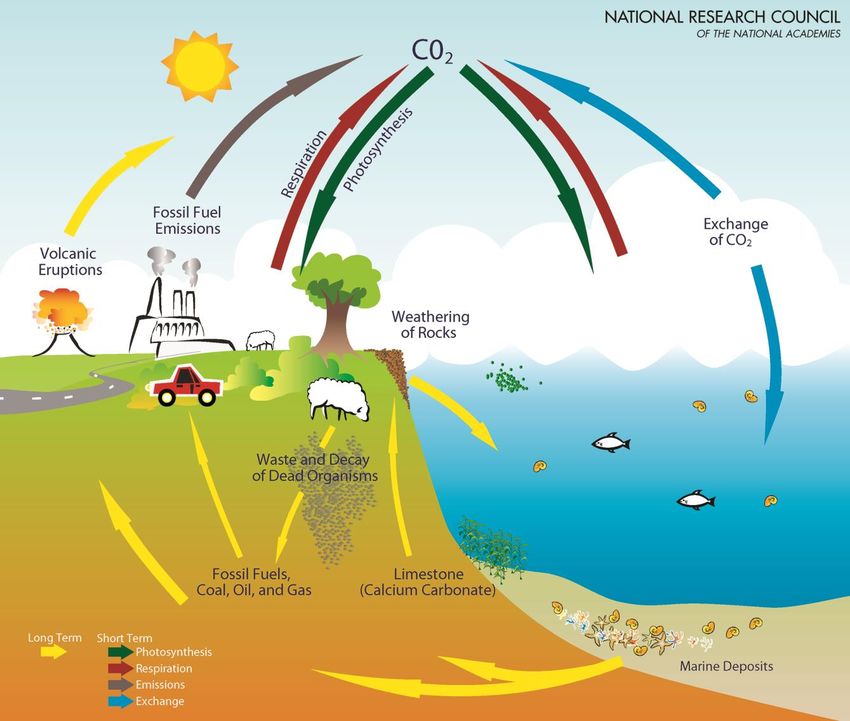
Global Drivers of our Changing Oceans

The drivers of global climate change are well researched and documented in the scientific community. Some
sectors of the global community invest their energies into arguing whether global climate change is caused
by anthropogenic activities or if it is a naturally occurring cyclic event. Whichever perspective you subscribe
to, it cannot be denied that our global climate is changing rapidly.

                                        The Role of Carbon Dioxide

     - Global Climate Change
Carbon dioxide is a naturally occurring gas that can be a by-product of cellular respiration and the burning of
organic materials such as fossil fuels. Carbon Dioxide levels within our atmosphere is increasing rapidly along
with Methane, Water vapour, Nitrous Oxide and Ozone all of which have the capacity to absorb and re-
radiate energy from the sun. An increase in the amount of these gases in our atmosphere enables larger
amounts of energy from the sun to be absorbed and stored within our planet which in turn promotes an
overall heating effect. The temperature of our oceans has increased by approximately 0.9 oc since the
beginning of the industrial revolution in 1760.

     - The Carbon Cycle
Carbon is continually cycled throughout our planet changing its form through the atmosphere, hydrosphere,
biosphere and geological systems. (See Fig. 3.)
These regulating systems occur naturally in a time frame that is governed by our planet’s biological, chemical
and geological processes.
Subsequent to advances in technology our planet has sustained a large increase in the human population. We
currently estimate the world’s population to be at approximately 7.7 billion. This increase in population
necessitates an increase in energy production to sustain our requirements. Unfortunately the vast majority of
energy production is from a non-sustainable source e.g. the burning of fossil fuels.
Through burning fossil fuel we have interrupted the timing of the planets natural biological, chemical and
geological processes that provide a regulatory balance on our planet. This disturbance of the balancing
process has pushed a large amount of carbon dioxide gas into the Earth’s atmosphere in a relatively short
period of time.
e: iharr28@eq.edu.au                                                                                              5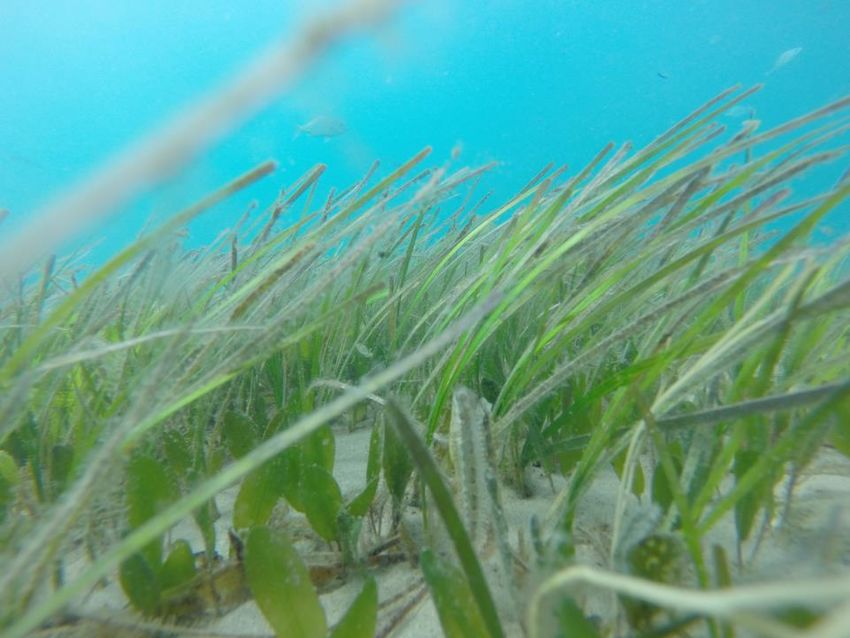
Recent estimates suggest the ocean has taken up approximately one third of the atmospheric carbon
released from fossil fuel combustion, cement production, and land use change (James Z. Sippo, 2016)

     - The Biological Calcium Carbonate Pump

Fig. 3. The Carbon Cycle (National Academies of Science)

     - Ocean Acidification – “The Evil Twin of Global Climate Change”
It is suggested that the increased levels of carbon dioxide in Earth’s atmosphere has been caused by
anthropogenic activities including the burning of fossil fuels. Gases from the atmosphere are readily absorbed
into the hydrosphere of our planet through the process of diffusion. It is considered that our oceans absorb
approximately 25% of the Carbon Dioxide that we release into the atmosphere every year. This absorption
has a marked effect on our ocean’s chemistry.

e: iharr28@eq.edu.au                                                                                           6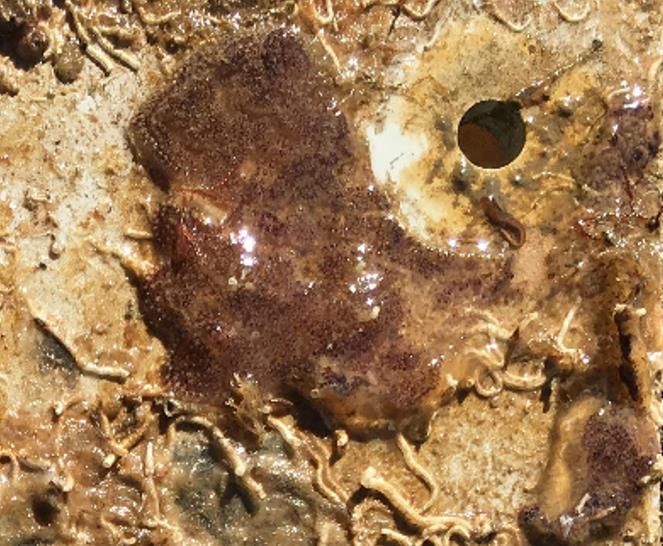
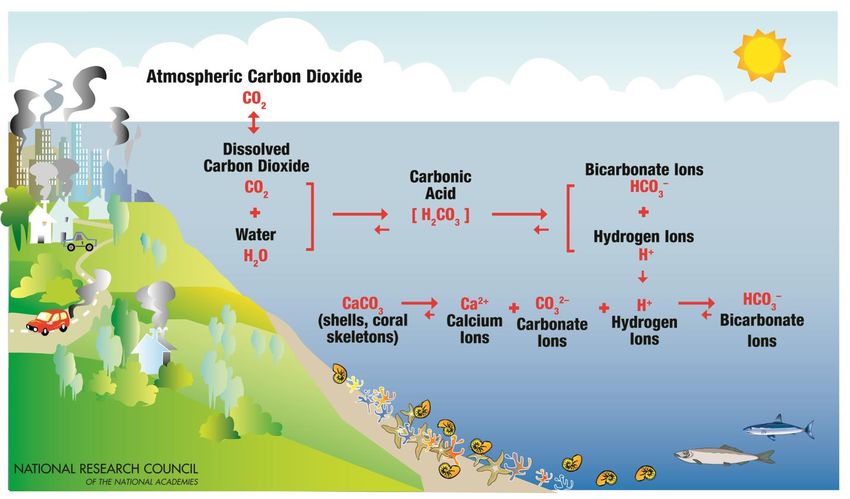
- The Process of Ocean Acidification

Fig. 4. Ocean Acidification (National Academies of Science)

When gaseous carbon dioxide diffuses into water it bonds with water molecules to produce carbonic acid
which then has the capacity to dissociate into polyatomic bicarbonate ions and hydrogen ions. The increased
availability of hydrogen ions drives a decrease in the water’s pH. The pH of our world’s oceans has decreased
by 0.1 pH units since the beginning of the industrial revolution. Although this may sound like a small decrease
in pH it is important to remember that the pH scale is a logarithmic scale and hence a 0.1 pH unit is the
equivalent to a 30% increase in acidity.

     - Impacts of Ocean Acidification
The impacts of ocean acidification are yet to be fully understood but a considerable amount of research is
currently underway to evaluate the possible future implications for the living and non-living aspects of our
planet.

e: iharr28@eq.edu.au                                                                                            7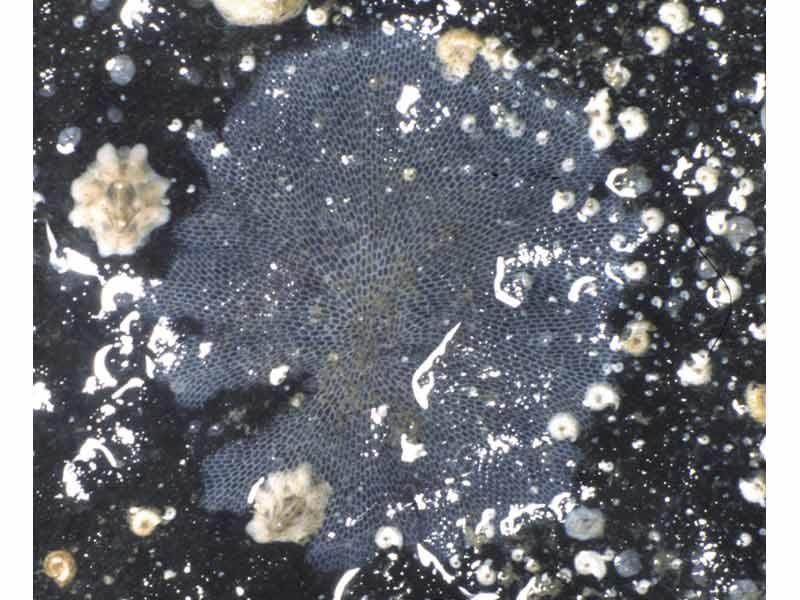
Carbon can be locked away on our planet through many chemical processes including photosynthesis which
can produce complex carbohydrates that can ultimately be stored, locked away, deep underground in
sediment. The production of carbonate ions (CO3 2-) is another means whereby Carbon can be removed from
the marine ecosystem by being bonded with three oxygen atoms (see Fig. 5.) to form a polyatomic molecule
that is capable of forming ionic salt compounds with metals.

Fig. 5. Polyatomic Carbonate ion

This inorganic chemical is readily used by many organisms for a variety of functions including structural
support, protection and a number of processes in sensory organs. As indicated earlier in this booklet, the
increasing acidity of our oceans could possibly compromise the biogeochemical nature of this highly
significant ecosystem on this “blue planet” that we call home.

e: iharr28@eq.edu.au                                                                                         8
- Blue Carbon

Fig. 6. Seagrass at Wave-break Island exhibiting epiphyte and epifauna coverage on leaves (Harrison,
2019)

There is considerable interest in measuring the capacity of the world’s ecosystems to trap and store excess
atmospheric carbon dioxide to mitigate human-induced climate change. “Blue carbon” describes the carbon
storage potential of vegetated coastal ecosystems including tidal marshes, mangroves, and seagrasses (Peter
I. Macreadie, 2017)
We have outlined what the implications are for our oceans, if carbon dioxide levels continue to increase
unabated. So now let’s consider what the future may hold for our oceans “Blue Carbon” systems if they can or
cannot keep up with the dynamic change in carbon levels.
The biotic and abiotic data that has been collected from the ARMS units at Wavebreak Island and Couran
Cove allow students to perform a comparative study between these two different areas of the Broadwater
system on The Gold Coast of Australia.
The analysis of the collected data can be used to evaluate the settlement success of these meroplanktonic
organisms based upon the direct influence that the abiotic factors may have placed upon the biotic factors.
This information can then be used as an implication for the future of the organisms under investigation.

e: iharr28@eq.edu.au                                                                                          9
Examples can include but are not limited to:-
Global Climate Change induced water current flow through increased storm activity and heightened sea
level
This increase in water flow may limit the ability for planktonic organisms to settle on submerged structures,
whether they be man-made or naturally occurring. Alternatively, fast flowing water current through seagrass
meadows reduces in speed as the water and suspended particulate matter, including plankton, negotiates the
maze of seagrass leaves. Will increased flow rates increase or decrease the ability of filter feeding organism to
gather their food items?
Global Climate Change induced water temperature increase may contribute to productivity of
photosynthesising organisms.
Photosynthetic rate tends to increase with an increase in water temperature. Algae exhibit a greater
rate of percentage biomass growth compared to vascular plants such as seagrasses when increases in
nutrient is present. (Bryan M. Dewsbury, 2016) Conversely, increase in water temperature reduces the
capacity of water to hold gases in solution. Therefore, the levels of available oxygen and carbon dioxide may
reduce.
Shallow water plants tend to mostly be affected by temperature increases and indirect impacts on
water clarity (Frederick T. Short, 2016)
Many calcifying animals that settle on leaves of seagrasses require absorption of oxygen for their
cellular respiration, what impact could this have on their success? Can they utilise the oxygen provided from
photosynthesis at the leaf’s laminar boundary layer?
It is suggested that the increase in epiphyte coverage on seagrass leaves will inhibit the availability of
light available to the seagrass and hence limit its growth. Most epiphytic growth is seen on mature seagrass
leaves. It is also suggested that an increase in epiphytic growth will provide an increased complexity to the
habitat and allow for greater number of motile epifauna to inhabit the seagrass meadows, e.g. copepod
crustaceans, nematode worms, polychaete worms, amphipod crustaceans and decapod crustacean nauplii
(Bell, 1988). This increase in meiofauna will provide a resource for larger carnivorous organisms such as fish.
The increase in water temperature can also have an impact on other habitat associated fauna such as
the Sea-hare (Aplysia dactylomela) which experiences an impairment of their reproductive strategy (Scott F
Cummins, 2009)
e: iharr28@eq.edu.au 10Single Point Abiotic Data Collection: Abiotic Factor Couran Cove Wavebreak Island Date Time Tide Height and Time Air Temperature (oc) Water Temperature (oc) pH Turbidity (cm) Wind speed/direction (Km/hr) Dissolved Oxygen (ppm) Salinity (ppt) Current speed (m/s) Water Carbonate content (ppm) Notes: ____________________________________________________________________________________________ ____________________________________________________________________________________________ ____________________________________________________________________________________________ ____________________________________________________________________________________________ ____________________________________________________________________________________________ ____________________________________________________________________________________________ ____________________________________________________________________________________________ ____________________________________________________________________________________________ ____________________________________________________________________________________________ ____________________________________________________________________________________________ ____________________________________________________________________________________________ ____________________________________________________________________________________________ e: iharr28@eq.edu.au 11
Biotic Data Collection:
• Release the retaining nuts from the ARMS and separate all of the plates from the unit and distribute them
into individual trays. Ensure that there is enough seawater in each tray to keep all organisms submerged.
• Using the identification booklet, provided list all of the organisms found on the top of the plate.
• Using an appropriate data collection technique, establish the abundance of each organism (e.g. count the
number of individual barnacles or use an acetate sheet to work out the percentage cover of colonial
bryozoans.
• Record this information on to the data tables on following pages:-

e: iharr28@eq.edu.au                                                                                          12
Site Name:________________________________________                                             Plate #_____________________

                          Type of Organism                                      Topside                                                  Underside

             Bivalve Mollusc abundance & size (cm)         Total number present                                          Total number present
             e.g. Jingle Clam, Black Mussel
                                                           Length of bivalve mollusc shell (cm)                          Length of bivalve mollusc shell (cm)

                                                             1.    2.     3.      4.       5.           6.      7.         1.    2.     3.    4.       5.           6.      7.

                                                             8.    9.     10.     11.      12.          13.     14.        8.    9.     10.   11.      12.          13.     14.

                                                             15.   16.    17.     18.      19.          20.     21.        15.   16.    17.   18.      19.          20.     21.

                                                             22.   23.    24.     25.      26.          27.     28.        22.   23.    24.   25.      26.          27.     28.

                                                             29.   30.    31.     32.      33.          34.     35.        29.   30.    31.   32.      33.          34.     35.

                                                             36.   37.    38.     39.      40.          41.     42.        36.   37.    38.   39.      40.          41.     42.

                                                             43.   44.    45.     46.      47.          48.     49.        43.   44.    45.   46.      47.          48.     49.

             Calcareous Tube Worms (abundance)             Total number present                                          Total number present

             Barnacle abundance & size range (mm)            Size        1-5      6-10          11-15         16-20        Size        1-5    6-10          11-15         16-20
                                                             (mm)        mm       mm            mm            mm           (mm)        mm     mm            mm            mm
             e.g. Red Striped Estuarine Barnacles            Number                                                        Number
                                                             present                                                       present

             Tunicate (Individual abundance)               Total number present                                          Total number present
             e.g. Ascidia empheres_________________
                                                           Average length (mm)                                           Average length (mm)

                                                           Zooid count    Surface area             Total number          Zooid count     Surface area          Total number
                                                           (per cm2)      coverage (cm2)           of Zooids             (per cm2)       coverage (cm2)        of Zooids
             Type of colonising organism                                                           found                                                       found
             Colonising Tunicate (Botryllus)

             Colonising Tunicate (Other)
             Name:________________________________
             Colonising Tunicate (Other)
             Name:________________________________
             Encrusting Bryozoan
             (Colour_______________________________)
             Encrusting Bryozoan
             (Colour_______________________________)
             Colonial Hydrozoan (Cnidarian)

             Branching Bryozoan Colony                     Length of colony              Total number of                 Length of colony            Total number of
             (approx. 46 zooids per 1cm length)            (cm)                          Zooids found                    (cm)                        Zooids found

             Algae (Present / Not Present)

             Red Coralline Algae (Present / Not Present)

             Soft Coral (Present / Not Present)

             Other:-                                       Total number                                                  Total number
                                                           present                                                       present
e: iharr28@eq.edu.au                                                                                                                                                              13
Site Name:________________________________________ Plate #_____________________
Type of Organism Topside Underside
Bivalve Mollusc abundance & size (measure Total number present Total number present
size across the widest point of valve in cm.)
Length of bivalve mollusc shell (cm) Length of bivalve mollusc shell (cm)
Examples include; Jingle Clam, Black Mussel,
1. 2. 3. 4. 5. 6. 7. 1. 2. 3. 4. 5. 6. 7.
Oysters & Cockle.
8. 9. 10. 11. 12. 13. 14. 8. 9. 10. 11. 12. 13. 14.
15. 16. 17. 18. 19. 20. 21. 15. 16. 17. 18. 19. 20. 21.
22. 23. 24. 25. 26. 27. 28. 22. 23. 24. 25. 26. 27. 28.
29. 30. 31. 32. 33. 34. 35. 29. 30. 31. 32. 33. 34. 35.
36. 37. 38. 39. 40. 41. 42. 36. 37. 38. 39. 40. 41. 42.
43. 44. 45. 46. 47. 48. 49. 43. 44. 45. 46. 47. 48. 49.
Calcareous Tube Worms (abundance) Total number present Total number present
Barnacle abundance & size range (mm) Size 1-5 6-10 11-15 16-20 Size 1-5 6-10 11-15 16-20
(mm) mm mm mm mm (mm) mm mm mm mm
e.g. Red Striped Estuarine Barnacles Number Number
present present
Tunicate (Individual abundance) Total number present Total number present
e.g. Ascidia empheres_________________
Average length (mm) Average length (mm)
Zooid count Surface area Total number Zooid count Surface area Total number
(per cm2) coverage (cm2) of Zooids (per cm2) coverage (cm2) of Zooids
Type of colonising organism found found
Colonising Tunicate (Botryllus)
Colonising Tunicate (Other)
Name:________________________________
Colonising Tunicate (Other)
Name:________________________________
Encrusting Bryozoan
(Colour_______________________________)
Encrusting Bryozoan
(Colour_______________________________)
Colonial Hydrozoan
Branching Bryozoan Colony Length of colony Total number of Length of colony Total number of
(approx. 46 zooids per 1cm length) (cm) Zooids found (cm) Zooids found
Algae (Present / Not Present)
Red Coralline Algae (Present / Not Present)
Soft Coral (Present / Not Present)
Other:- Total number Total number
present present
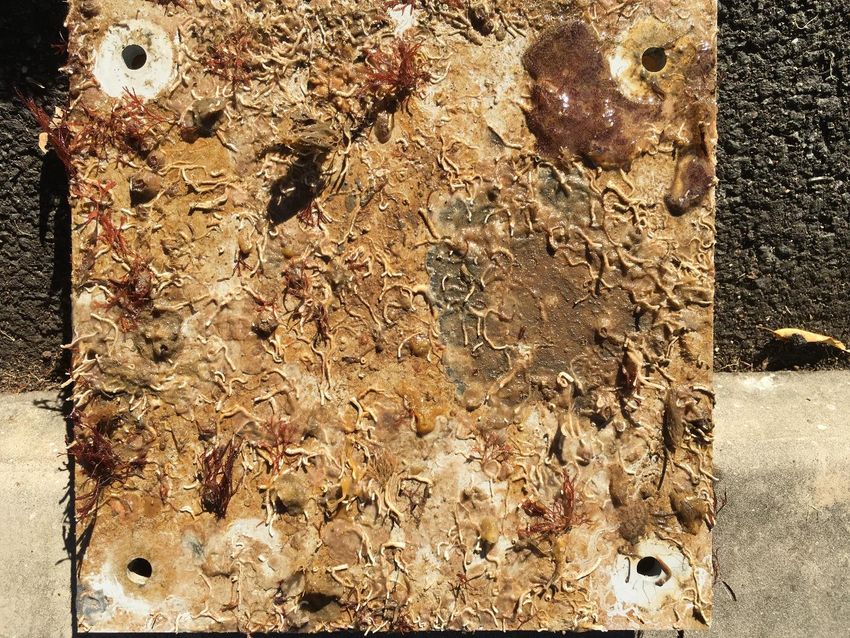
e: iharr28@eq.edu.au 14Identification of Organisms
Colony of Tunicates
Striped Estuarine Barnacle
Branching Calcifying Encrusting Calcifying Calcifying Tube worm
Bryozoan Colony Bryozoan Colony
Fig. 1. ARMS plate showing a variety of settling organisms. (I.Harrison, 2018.)
e: iharr28@eq.edu.au 15Colonial Encrusting Bryozoa: These encrusting Bryozoans use calcium carbonate that is obtained from ocean water, to create their protective “cell” that combines to form the lace like structure of the colony (See Fig.4). An example of colonial encrusting bryozoans that you may find during your investigation is Schizoporella unicornis. This bryozoan is an alien species not native to Australia, although now can even be found on the Great Barrier Reef. Schizoporella colonies are commonly orange in colour however initial growth is white to yellowish brown, later becoming dark brownish, while growing edges are yellow to light brown. Mature colonies are typically 1-4cm in diameter and may form on a wide variety of substrata such as shells, stone, kelp, vessel hulls, piers, overhangs, and other bryozoans. They are arranged in alternate rows radiated from the centre ((NIMPIS, 2008; Ross & McCain, 1976; Hayes et al., 2005) adapted from ISSG Database.) Fig.2. Schizoporella sp. (University of California, Davis Institute) e: iharr28@eq.edu.au 16
Each “cell” compartment of the colony contains an individual animal (Zooid) that can reproduce sexually, by releasing sperm a nd
eggs at different times in order to avoid self-fertilisation and asexually through the process of budding. Budding allows for the
organism to create a genetic replica of itself that is released next to the parent. This release of a replica offspring allows the
bryozoan to compete for space on hard substrate by rapidly producing a colony.

Colonising bryozoans such as those found encrusting on the A.R.M.S., feed predominantly on phytoplankton that is pulled into the
body of the bryozoan by creating a downward water current through a ciliated crown of tentacles called the lophophore.

It could be suggested that turbid waters containing a large amount of suspended particulate matter may decrease the feeding
efficiency of these organisms.

Fig. 2. Encrusting Bryozoan diagram showing anatomy of the individual polyp. (Shimek, 2018)

e: iharr28@eq.edu.au                                                                                                                 17
Fig. 3. Encrusting Bryozoan. (Faasse, 2018)

Fig. 4. Branching Bryozoans (I. Harrison, 2018)

These Bryozoan polyps form colonies that do not encrust the substrate. As you can see from Fig. 4. They form branching struct ures
that many people confuse for red algae. In order to distinguish this colony of animals from a red algae you will need to look very
closely with a magnifying glass in order to see the individual polyps along each branching arm.
e: iharr28@eq.edu.au                                                                                                                 18
Calcifying Tubiculous Worms:

These tube worms form a protective calcium carbonate shell in which they reside. The soft bodied worm extends its array of
tentacles from within its shell in order to feed.

Fig. 5. A close-up image of the tubeworm Hydroides elegans with its feather-like tentacles extended from its tube. The tentacles
both collect microscopic food particles from the water and serve as the place for gas exchange for the worm, passing carbon
dioxide from the worm and gaining dissolved oxygen from the water. (Photo credit Brian Nedved. (University of Hawaii, 2018))

Striped Estuarine Barnacles:

The Striped Estuarine Barnacle is a crustacean that inhabits coastal waters. Their lifecycle incorporates a meroplanktonic st age
where the Subsequent to settling on to hard substratum the organism utilises calcium carbonate to construct protective plates
within which the barnacle resides.

e: iharr28@eq.edu.au                                                                                                                19
Fig. 6. Striped Estuarine Barnacles (D. Staples, 2018)

Fig. 7. Striped Estuarine Barnacle (Amphibalanus amphitrite amphitrite) (I. Harrison, 2018)

The barnacle is a crustacean that is closely related to a crab or lobster both of which are classified as Arthropods. A motile form of
the barnacle is found in its planktonic form in the early stages of the lifecycle. It is interesting to note that the barnacle nauplii larvae
is very similar in crab nauplii larvae in both features and behaviour.

e: iharr28@eq.edu.au                                                                                                                      20
Fig. 8. Barnacle lifecycle. Modified from Jorgen Olesen, 2018

Fig. 9. Decapod Crustacean Shrimp Lifecycle. Comparative nauplii larvae. Modified from Jorgen Olesen, 2018

e: iharr28@eq.edu.au                                                                                         21
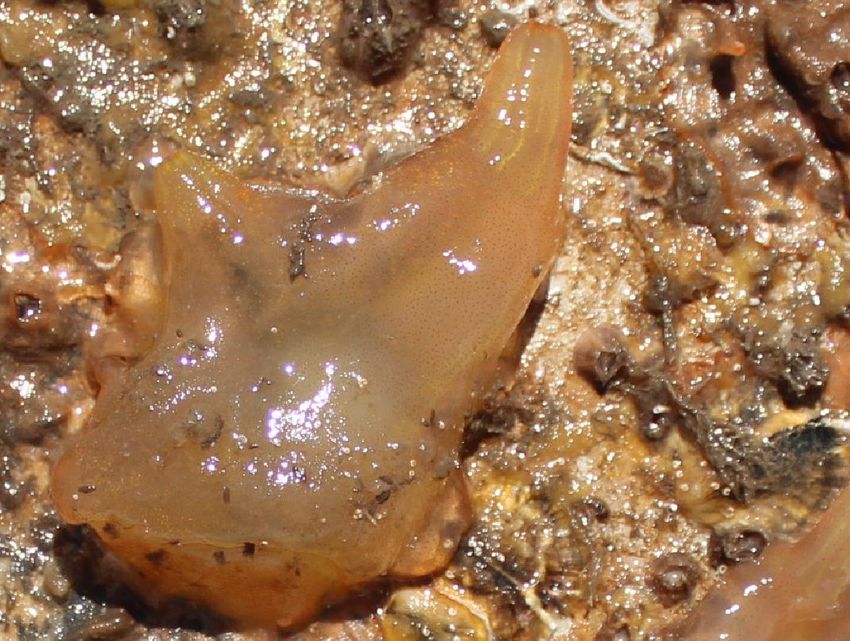
Tunicates:

Fig. 8. Tunicate: Translucent Sea Squirt (Ascidia empheres) (I. Harrison, 2018)

The Translucent Sea Squirt exhibits both inhalant and exhalant siphons that facilitate the intake of food and oxygen and the release
of waste materials and gases.

These Tunicates also possess a notochord during the pre-settlement planktonic stage of their lifecycle. The notochord is a
precursor to the supportive backbone found in chordate animals. Once the barnacle has settled this structure no longer features in
the animal’s anatomy.

Fig. 9. Tunicate: Colony of Tunicates (e.g. Botryllus schlosseri) (I. Harrison, 2018)
e: iharr28@eq.edu.au                                                                                                             22
The Jingle Clam:

These bivalve mollusc are often mistaken for limpets or other gastropod mollusc due to their appearance, which has a low profile on
hard substrate. The lower shell (valve) cannot be seen whilst the mollusc shell is closed.

The Calcium Carbonate shell is very fine and fragile with a pearlescent lustre. The name ‘Jingle Clam’ comes from the noise that
these shells make when used as decoration.

These bivalve mollusc also have inhalant and exhalant siphons that allow water to be drawn into the shell and pass over the gills.
This allows oxygen to diffuse across the gills and into the mollusc whilst carbon dioxide passes out of the gills and is flushed out of
the mollusc via the exhalant siphon.

The gills of the bivalve mollusc are covered with mucous which successfully traps food in the form of particulate matter that is then
ingested by the mollusc along with the mucous.

Fig. 10. Jingle Clam (I. Harrison, 2018)

e: iharr28@eq.edu.au                                                                                                                      23
Bibliography

Bell, M. O. (1988). Response of small motile epifauna to complexity of epiphytic algae on seagrass blades. Journal of Marine
          Research, 613 - 630.

Bryan M. Dewsbury, M. B. (2016). A review of seagrass economic valuations: Gaps and progress in valuation approaches. Ecosystem
          Services, 68 - 77.

Frederick T. Short, S. K. (2016). Impacts of climate change on submerged and emergent wetland plants. Aquatic Botany.

James Z. Sippo, D. T. (2016). Are mangroves drivers or buffers of coastal acidification? Insights from alkalinity and dissolved
          inorganic carbon export estimates across a latitudinal transect. American Geophysical Union, 30. American Geophysical
          Union.

Peter I. Macreadie, O. S. (2017). Addressing calcium carbonate cycling in blue carbon accounting . Limnology and Oceanography
          Letters.

Scott F Cummins, P. N. (2009). Conservation of the egg-laying hormone neuropeptide and attracting pheromone in the spotted sea
          hare, Aplysia dactylomela. PubMed.

e: iharr28@eq.edu.au                                                                                                              24
You can also read