CURRENT RESEARCH TAHOE.UCDAVIS.EDU - UC Davis Tahoe Environmental Research ...
←
→
Page content transcription
If your browser does not render page correctly, please read the page content below
CURRENT
                    RESEARCH
TAHOE.UCDAVIS.EDU              6
TAHOE: STATE OF THE L AKE REPORT 2018
                    CURRENT RESEARCH

                    Lake clarity in 2017
                    Annual average Secchi depth

                    In 2017, 26 individual clarity readings      9, and the lowest was 47.6 feet on October   lowest level ever recorded. The long-term
                    were taken from January through              17 and December 19. The average clarity      record of annual average clarity in Lake
                    December 2017. The highest value             level for 2017 was 59.7 feet, a 9.5 foot     Tahoe is shown in the figure below.
                    recorded in 2017 was 90.2 feet on March      decrease from the previous year, and the

                                                              ANNUAL AVERAGE SECCHI DEPTH

                                                                                                                                        40
                                  15                                                                                                    50

                                                                                                                                        60
                                  20
                                                                                                                                        70

                                                                                                                                        80
                         METERS

                                  25

                                                                                                                                              FEET
                                                                                                                                        90
                                  30                                                                                                    100

                                                                                                                                        110
                                  35
                                                                                                                                        120

                                       65   70     75      80       85          90    95       00       05       10       15       20
                                                                                 YEAR

                              Long-term annual average clarity in Lake Tahoe.

TAHOE.UCDAVIS.EDU                                                                                                                                         6.1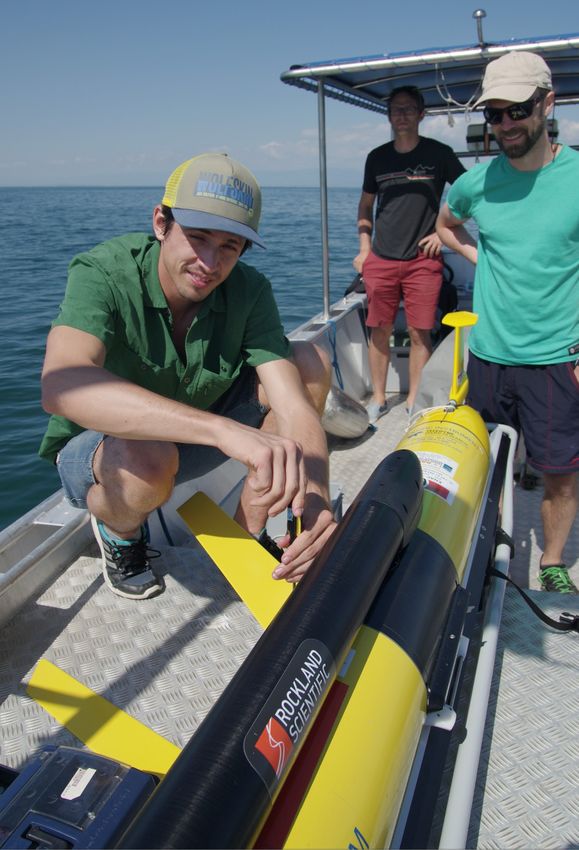
TAHOE: STATE OF THE L AKE REPORT 2018
                    CURRENT RESEARCH

                    Lake clarity in 2017, continued
                    Individual Secchi depth measurements

                    Secchi depth measurements typically         when the pattern starts again. While no       values generally fell within the historical
                    follow a seasonal pattern. In summer,       two years are identical, this pattern has     range. From September through the end
                    clarity is usually at its lowest due to     long been established.                        of the year, the 2017 clarity values were
                    the impacts of spring runoff, warmer           The year 2017 had a departure from         10 to 20 feet less than the historical
                    temperatures, and long hours of sunlight.   this seasonal pattern. In the figure below,   range. It is the Secchi disk values in
                    As winter approaches, the surface layer     the individual values of Secchi depth         this four-month period of time that are
                    of the lake mixes and deepens, diluting     are shown for the years 2010 through          responsible for the record low clarity of
                    the upper layers with clearer, deep         2017. The 2010 to 2016 values are shown       2017. The usual winter clearing of the
                    water. This clearing through the winter     as hollow circles, while the 2017 values      water column did not initiate before the
                    continues until the following spring        are filled circles. Until September 2017,     end of December.

                                    Individual Secchi depth measurements for 2010-2016 (hollow circles) and 2017 (filled circles).

TAHOE.UCDAVIS.EDU                                                                                                                                           6.2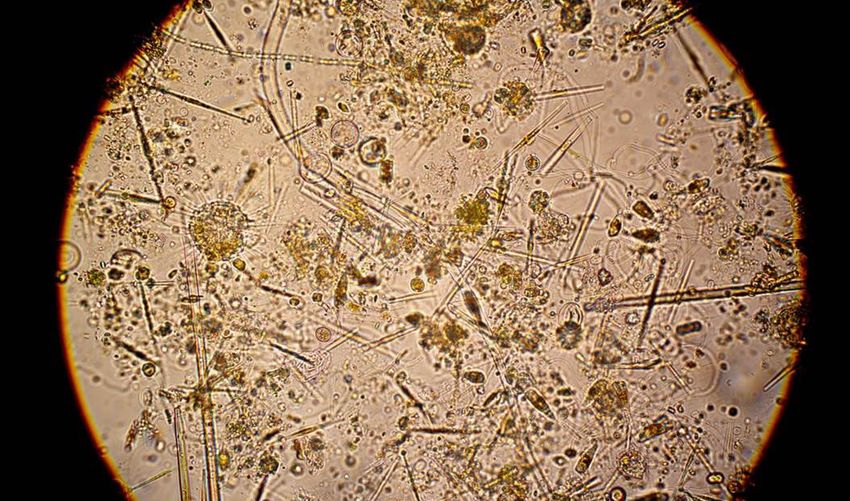
TAHOE: STATE OF THE L AKE REPORT 2018
                    CURRENT RESEARCH

                    Lake clarity in 2017, continued
                    Lake level 2012-2018

                    Based on all the available data, a           commenced in 2012. During this time,           to officially end that drought. Water
                    combination of two extreme climatic          total precipitation, as well as the fraction   Year 2017 (Oct. 2016 - Sept. 2017) was
                    and hydrologic events was the primary        of precipitation as snow, was particularly     California’s second wettest and Nevada’s
                    cause of the unprecedented clarity           low in the northern Sierra Nevada.             seventh wettest in a 122-year record.
                    conditions in 2017. The first key event         The second key event was the record         A lake level rise of six feet in a six-month
                    was the record five-year drought that        high precipitation that occurred in 2017       period in 2017 is shown below.

                               The overall drop in lake level during the drought years is evident, as is the rapid rise during 2017.

TAHOE.UCDAVIS.EDU                                                                                                                                              6.3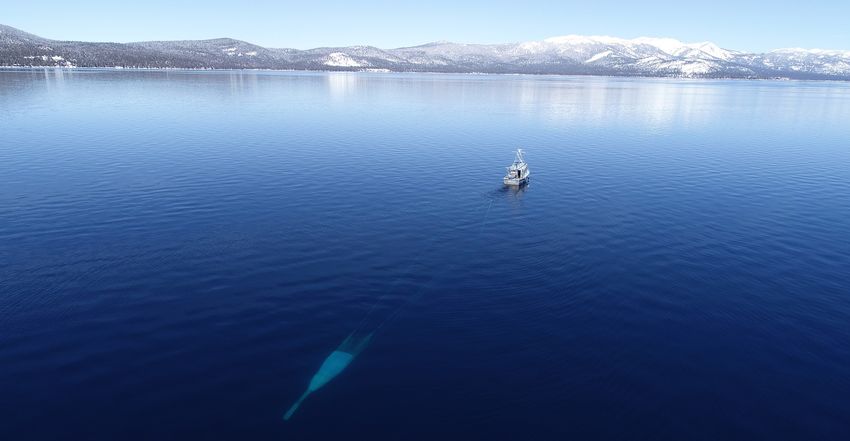
TAHOE: STATE OF THE L AKE REPORT 2018
                    CURRENT RESEARCH

                    Lake clarity in 2017, continued
                    Comparing 1997 and 2017

                    A comparison of 1997, the previous lowest       peak flow, 2017 had more frequent peaks          These plots are for the Water Year
                    clarity year, and 2017 is illustrative. Upper   and a more sustained flow well into August.   (October 1 – September 30), so 2017 does
                    panels of the figure below compare the flow        The lower two panels show the              not include the sediment flux associated
                    of the Upper Truckee River for both these       cumulative sediment load and it is evident    with the large rainfall and flow event in
                    years. In 1997, major flooding downstream       that 2017 and 1997 had similar loads. In      November 2017.
                    of Lake Tahoe occurred, as well as low          2017, the load came later in the year when
                    clarity conditions. While 1997 had a larger     surface warming had already commenced.

                                    The Upper Truckee River in WY 1997 and WY 2017. Upper panels are discharge (cubic feet per second).
                                    Lower panels are the suspended sediment cumulative load from October 1st to September 30.

TAHOE.UCDAVIS.EDU                                                                                                                                             6.4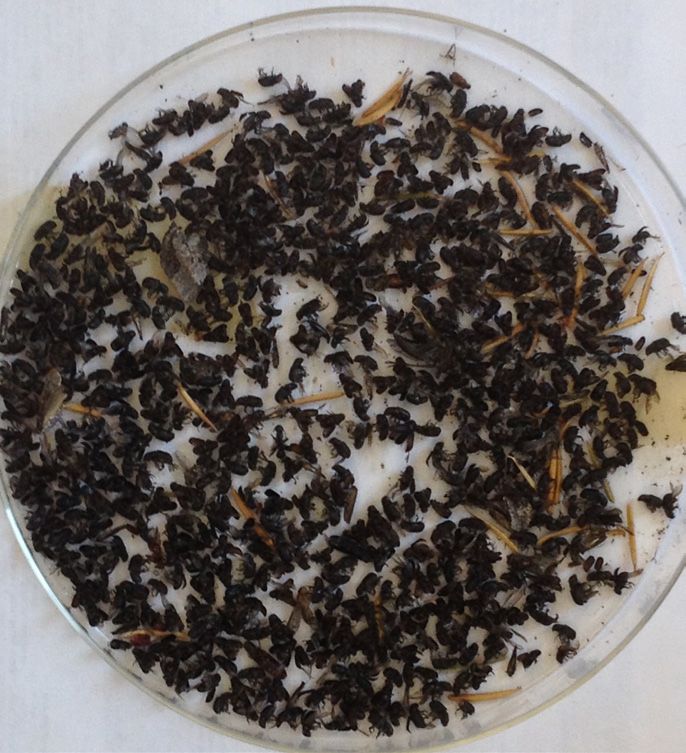
TAHOE: STATE OF THE L AKE REPORT 2018
                                   CURRENT RESEARCH

                                   Lake clarity in 2017, continued
                                   Suspended sediment load

                                   The figure below indicates the annual           The loads were the direct result of     (see picture below). High flows in 2017
                                   suspended sediment load from the Upper       the combination of the extreme drought     extended into August. Additionally, there
                                   Truckee River to the lake for each water     (2012-2016) that was followed by an        was also a late November storm (WY
                                   year from 1989 through 2017. The 2017        extreme wet year. The high and sustained   2018) that added considerable sediment
                                   sediment load in metric tons is larger       flows in winter 2017 both mobilized        to the lake.
                                   than the sum of all of the sediment loads    accumulated sediment and caused
                                   for the previous five years combined.        additional erosion within the watershed


              2JYWNH9TSX


                                                            JFW
                                   Annual suspended sediment load of Upper the Truckee River to            Erosion gully on a fire road in the Tahoe watershed.
                                   the lake (metric tons).                                                 Photo: H. Segale

TAHOE.UCDAVIS.EDU                                                                                                                                                      6.5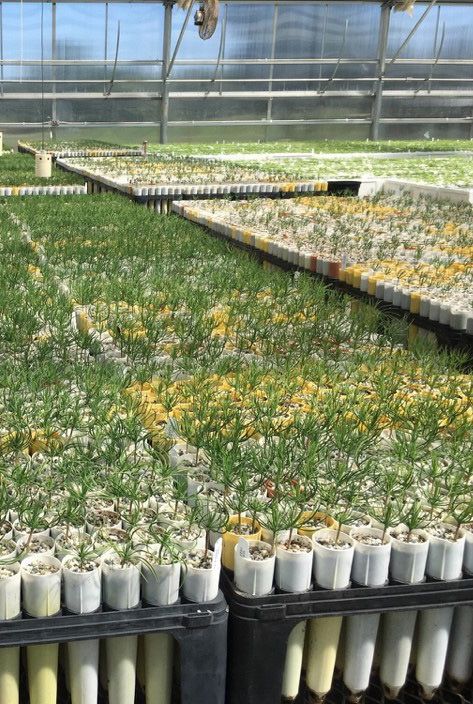
TAHOE: STATE OF THE L AKE REPORT 2018
                    CURRENT RESEARCH

                    Lake clarity in 2017, continued
                    Lake temperatures

                    The drop in the annual Secchi depth is the      have exacerbated the situation. The summer   temperatures extended into September
                    most obvious in-lake response to these          temperatures in 2017 were the warmest on     2017. This increase in the lake’s thermal
                    climatic and hydrologic drivers. However,       record at Lake Tahoe, almost 4° F higher     stratification would keep inflow waters and
                    alterations to some of the physical processes   than the previous three years. As evident    their sediment loads suspended in the upper
                    in the lake due to a changing climate may       in the figure below, the elevated water      part of the lake.

                                     Surface water temperature in 2010 to 2016 (blue) and 2017 (red).

TAHOE.UCDAVIS.EDU                                                                                                                                              6.6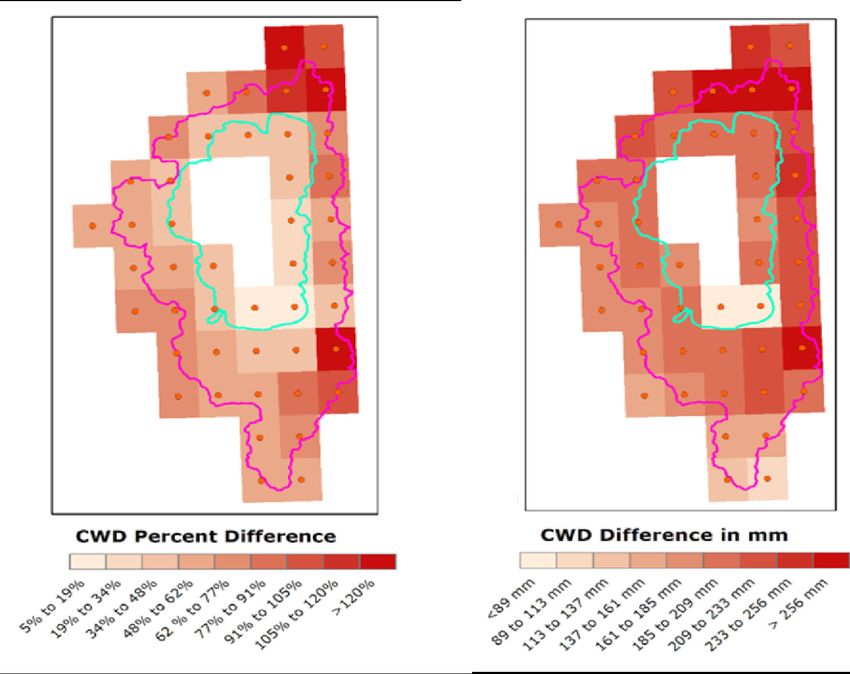
TAHOE: STATE OF THE L AKE REPORT 2018
                    CURRENT RESEARCH

                    Lake clarity in 2017, continued
                    Fine sediment distribution

                    Fine sediment was kept in suspension in                 lake depth for 2017. From May until the end
                    the upper part of the lake in the latter part           of the year, a distinct, high concentration
                    of 2017 as shown in the figure below, where             layer of fine particles, those causing the loss
                    the concentration of fine particles (less than          in clarity, is evident.
                    16 micron diameter) are shown over the full


                                                                                                                                                             1TL3ZRGJWTKUFWYNHQJX !mRUJWRNQQNQNYJW


                                                                                                                                      )JUYM 2JYJWX
                          )JUYM +JJY


                                            /FS            2FW         2F^            /ZQ           8JU           3T[         /FS

                                                Fine sediment distribution in 2017.

TAHOE.UCDAVIS.EDU                                                                                                                                                                                               6.7
TAHOE: STATE OF THE L AKE REPORT 2018
                    CURRENT RESEARCH

                    Lake clarity in 2017, continued
                    Conclusion

                    In 2017, Lake Tahoe’s low clarity was         of the lake and an alteration to the mixing    for the first six months of 2018 appear to
                    primarily the result of the coincidence of    regime due to the impacts of a changing        confirm this, with the “regular” Lake Tahoe
                    two extreme climatic and hydrologic events.   climate. As such, the clarity value for 2017   range of clarity readings returning.
                    There are likely other factors at play that   may be seen as an anomalous value and
                    are producing changes in the behavior and     should not be considered as representing
                    response of the lake, such as the warming     the underlying long-term trend. Clarity data

                    Photo: N. McMahon

TAHOE.UCDAVIS.EDU                                                                                                                                              6.8
TAHOE: STATE OF THE L AKE REPORT 2018
                    CURRENT RESEARCH

                    The nexus between invasive species and lake clarity
                    Pilot project in Emerald Bay

                    During a six-year study (2011-2016) funded by
                    private donors, TERC researchers were able to
                    chronicle a doubling of clarity in Emerald Bay.
                    This clarity improvement was coincident with the
                    disappearance of the introduced Mysis shrimp and
                    the return of the native zooplankton, Daphnia.
                       This occurrence presented two intriguing
                    questions. First, were Mysis shrimp having a large
                    impact on clarity through their intense grazing of
                    algae-eating Daphnia? The answer to that appears
                    to be yes. Second, is it possible to harvest Mysis to
                    the point where Daphnia can return throughout
                    the lake and help with the restoration of lake
                    clarity? These answers are being addressed in an
                    ongoing pilot project.
                       The 2018-2020 pilot project is being funded by         A Mysis shrimp (actual length 1/2 inch).
                    the California Tahoe Conservancy and the Nevada
                    Division of Environmental Protection. It entails the
                    location and quantification of the Mysis shrimp in
                    Emerald Bay using echosounding technology, and
                    then removal of Mysis using a custom-designed
                    trawl net. Prior research has shown that the Mysis
                    only have to be reduced by 50-70% for Daphnia to
                    return.

                                                                              A Mysis trawl net being tested in Lake Tahoe.

TAHOE.UCDAVIS.EDU                                                                                                             6.9
TAHOE: STATE OF THE L AKE REPORT 2018
CURRENT RESEARCH
The nexus between invasive species and lake clarity, continued
Pilot project in Emerald Bay
While this sounds simple enough, the a Biosonics Echosounder shows the during nighttime removal.
real challenge is presented by the daily, location of the discrete band of Mysis While undertaking this research is
vertical migration that the Mysis shrimp shrimp in Emerald Bay close to midnight. proving to be arduous, the potential
undertake. To avoid predation, Mysis This image shows researchers precisely it holds for restoring lake clarity is
spend daylight hours on the lake bottom, the depth at which the trawl net needs to tremendous.
and then swim toward the surface at be maintained in order to intercept the
night. The figure below produced by largest concentrations of Mysis shrimp
An echogram showing the location of a band of Mysis shrimp in Emerald Bay at midnight, The peak of
their distribution is at a depth of 60 feet.
TAHOE.UCDAVIS.EDU 6.10TAHOE: STATE OF THE L AKE REPORT 2018
CURRENT RESEARCH
Project UPWELL
A collaboration on lake physics
In the spring of 2018, TERC graduate and falling of deep, nutrient-rich water on depth. Temperature, current velocity, and
student Derek Roberts led a collaboration Lake Tahoe’s west shore, and to ascertain its dissolved oxygen measurements were
of researchers from UC Davis Civil and impact on the growth of algae on shoreline taken every 30 seconds in order to resolve
Environmental Engineering, Bodega Bay rocks (periphyton). the upwellings that were driven by the
Marine Laboratory, Stanford University, A 1.5 mile wide “measurement curtain” strong spring winds. An autonomous,
and the University of British Columbia was installed in the lake from the shoreline underwater glider was used to collect data
in a first-of-its-kind experiment in the toward the center of the lake. Pre- along the shoreline to examine how variable
nearshore region of a lake. The overarching programmed instruments were deployed the upwelling was along the west shore.
goal of UPWELL (Upwelled Pelagic Water at seven moorings along the curtain, the Water samples were taken for nutrient
Exchange driving Littoral Limnology) shallowest near the shoreline at 7 feet and concentrations before, during, and after
experiment, was to document the rising the farthest offshore at almost 900 feet upwelling events.
One of TERC’s real-time Nearshore Water Quality Stations (right) with a newly installed Acoustic Doppler
Anemometer (left) for turbulence measurements during UPWELL. The instruments were at 6.5 feet depth.
Notice the heavy periphyton growth covering the rocks. Photo: B. Allen
TAHOE.UCDAVIS.EDU 6.11TAHOE: STATE OF THE L AKE REPORT 2018
CURRENT RESEARCH
Project UPWELL, continued
A collaboration on lake physics
The experiment was motivated by data will be analyzed in great detail. But even while the east shore remained a balmy 57° F.
from the TERC Nearshore Network of water after an initial look, it is clear that our The upwelling ended with a rapid transition
quality instruments. The network has understanding of upwelling dynamics has to a downwelling. After the wind died
shown that an upwelling event can bring been advanced. The experiment was able down, the cold water rushed back down the
water 1,000 feet deep, up to the surface of to document two major and two minor west slope of the lakebed and warm water
the lake, but how this process stimulates upwelling events. During the major events from the east shore surged back across the
periphyton growth is not well understood. (May 31 and June 9), water from as deep as lake surface. The speed of this water was in
The instruments were recovered and 500 feet rose to the surface along the west excess of 2 feet per second (1.5 mph).
the data were downloaded in June 2018, shore in a matter of several hours, dropping
and for the next six months these data west shore temperatures to a frigid 40° F
A diver inspects UPWELL instruments at 33 feet depth. The Acoustic Doppler Current Profiler (right)
measures currents between the bottom and the surface. The Acoustic Doppler Velocimeter (left) measures
current turbulence near the bottom. Photo: B. Allen
TAHOE.UCDAVIS.EDU 6.12TAHOE: STATE OF THE L AKE REPORT 2018
CURRENT RESEARCH
Where does the nearshore end?
Periphyton diversity
Periphyton, or attached algae, can make Karen Atkins deployed growth surfaces two months of spring, their peak growing
lake rocks slippery and green. To help for periphyton at different depths and season. At the end of the experiment,
understand the distribution of conditions distances from the shore. The periphyton the taxonomy and quantity of algae was
that favor growth, TERC graduate student colonized and grew on the surfaces during assessed from nearly 80 substrate surfaces.
An example of the diversity of the alga in a periphyton sample. Those shown here include Golenkinia, Cyclotella,
Gomphoneis, and Synedra. The diameter of the view is approximately 0.6 mm. Photo: K. Atkins
TAHOE.UCDAVIS.EDU 6.13TAHOE: STATE OF THE L AKE REPORT 2018
CURRENT RESEARCH
Where does the nearshore end?, continued
Periphyton growth
The outcome of a visual growth assessment nearshore. The growth toward the surface site of about 100 m (330 feet).
is shown below. A rating of 5 indicates that was not unexpected, as the periphyton These findings help researchers better
the algae colonizing the substrate grew require light to photosynthesize. What was understand the sources of nutrients that
to a large mass that included filamentous surprising was the Level 3 growth at depths are driving excess periphyton growth in
strands. By contrast, surfaces exhibiting a down to 40 m (130 feet). Also surprising the nearshore. With this information we
rating of 1 had no visible algae and did not was the observation that conditions favoring can better advise agencies about the best
feel slick with a biofilm. high growth (Level 3 and 4) extend to strategies for managing the nearshore
The results showed that periphyton over 500 m (1,650 feet) from the shore, environment.
growth is highest at the surface, toward the corresponding to a depth at this west shore
The dots indicate the locations of deployed growth surfaces coinciding with
individual UPWELL instruments. The colors refer to the degree of growth.
TAHOE.UCDAVIS.EDU 6.14TAHOE: STATE OF THE L AKE REPORT 2018
CURRENT RESEARCH
Forest health
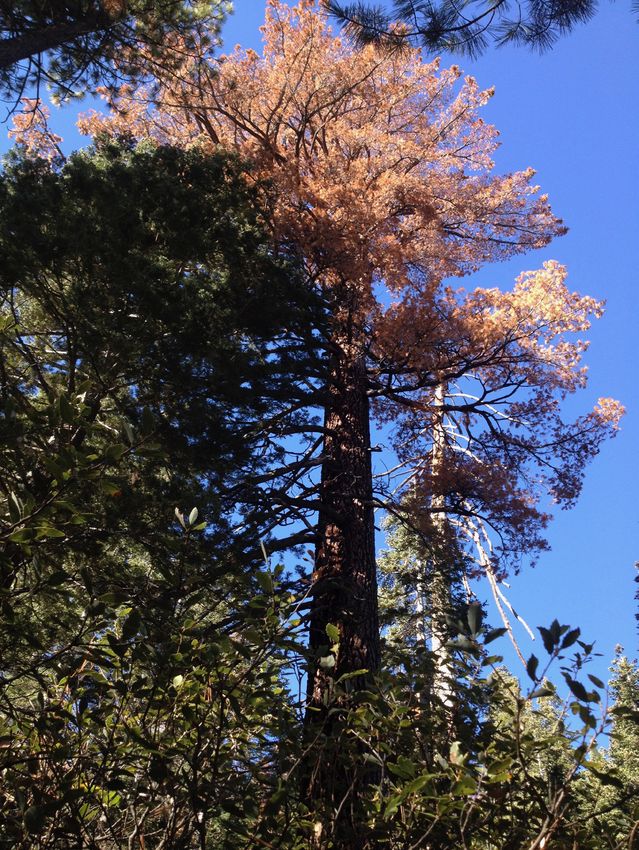
Ecology and evolution
The iconic sugar pine experienced mortality in large
parts of the Tahoe Basin during the recent drought.
What are some of the ecological and evolutionary
consequences of this?
There will likely be shifts in species composition
and structure, as well as genetic shifts.
Is climate change already exerting a selective
pressure for drought resilient forest trees? In our
reforestation of sugar pine, we purposefully chose
those sugar pine trees that survived drought and
avoided attack by mountain pine beetle.
Mountain pine beetles (pictured above)
are responsible for killing sugar pine above
Crystal Bay, Nevada (pictured to the right).
Photos: P. Maloney
TAHOE.UCDAVIS.EDU 6.15TAHOE: STATE OF THE L AKE REPORT 2018
CURRENT RESEARCH
Forest health, continued
Host-bark beetle interactions
Mountain pine beetle (MPB) numbers Nevada are drought stressed, they can emit the recent MPB outbreak. In contrast, those
(abundance) peaked in 2016 in the Lake chemicals such as ethylene that signal sugar pines killed by MPB utilized water less
Tahoe Basin. Bark beetles such as MPB are tree vulnerability when detected by MPB. efficiently and were most susceptible to MPB
known to preferentially attack drought- TERC’s forest biology lab is exploring the attack.
stressed trees. Trees have a physical-based relationships between tree physiology, water- Forest surveys have shown the value of
defense by producing resin or “pitching out.” use efficiency, and susceptibility to MPB. active forest management. Stands that receive
Tree chemistry can either defend against Preliminary findings show that sugar pine no treatments such as thinning or prescribed
bark beetle attack or aid beetles in locating trees that are more water-use efficient, and fire had much higher numbers of MPB
a suitable host tree. When trees in the Sierra perhaps better adapted to drought, survived compared to stands that received treatments.
The impact of forest treatments on the abundance of MPB. A sugar pine “pitching out” a mountain pine
beetle. Drought-stressed trees are limited in
their ability to do this. Photo: P. Maloney
TAHOE.UCDAVIS.EDU 6.16TAHOE: STATE OF THE L AKE REPORT 2018
CURRENT RESEARCH
Forest health, continued
Reforestation
One solution to drought-mediated mortality collected from 100 local and diverse seed improve sugar pine population and facilitate
is to reforest stands for bark beetle outbreak sources mainly on the North Shore of Lake sugar pine regeneration in mountain
resilience. Despite high levels of sugar pine Tahoe. The seeds were germinated at the pine beetle impacted stands. This work
mortality, there were numerous surviving USDA Forest Service Placerville Nursery. is supported by the Tahoe Fund and the
sugar pine trees on the north shore of the The seedlings will be relocated to our Tahoe California Tahoe Conservancy.
Lake Tahoe Basin. In September 2017, City Field Station in spring 2019.
TERC’s forest and conservation biology lab Sugar pine reforestation will allow us to
Sites of seed collections. Collecting cones at Incline Lake. Sugar pine seedlings at Placerville
Photo: P. Maloney nursery. Photo: P. Maloney
TAHOE.UCDAVIS.EDU 6.17TAHOE: STATE OF THE L AKE REPORT 2018
CURRENT RESEARCH
Forest health, continued
Tree mortality
In 2017, TERC’s forest and conservation biology lab resurveyed a network
of 84 long-term monitoring plots in the Lake Tahoe Basin to determine tree
mortality across three elevation zones. On average, we found a 5% increase
in cumulative tree mortality across all three elevation zones in between the
two survey periods (2009 & 2017). Average tree mortality increased from
9% to 15%, 10% to 14%, and 2% to 6% in lower montane, upper montane,
and subalpine forests, respectively. Primary causes of mortality were bark
beetles, pathogens, and drought stress.
TAHOE.UCDAVIS.EDU 6.18TAHOE: STATE OF THE L AKE REPORT 2018
CURRENT RESEARCH
This is not your grandparents’ climate
Climate modeling - air temperature
As part of its ongoing focus on climate been working with funding support shows the average of daily maximum
change impacts on the Lake Tahoe from the California Tahoe Conservancy. temperatures and minimum temperatures,
watershed, TERC has been analyzing sets The project will provide a set of climatic averaged by year across the Basin for the
of future climate scenarios. The climate and hydrologic conditions for the Tahoe modeled historic (1950-2005) period and
scenarios were produced by a research basin that capture the range of extreme the modeled future (2006-2100) using the
team from the Southwest Climate Center events possible in the next one hundred future carbon scenario RCP 8.5. The results
(SWC) as part of the project “Development, years, based on the SWC projections. The suggest a 9 °F (5 °C)rise in air temperature
delivery, and application of data on climate information will assist in the planning between now (dashed vertical line) and
extremes for the southwestern United and design of watershed restoration and the end of the century for the maximum
States.” stormwater projects. and a 7 °F (3.9 °C) rise for the minimum
TERC’s team of Goloka Sahoo, Robert The initial results are showing that the temperatures.
Coats, Zack Coats, Jack Lewis, Mariza Lake Tahoe basin will be considerably
Costa-Cabral, and Geoff Schladow have warmer in the future. The figure below
The trend of maximum and minimum temperatures averaged over the Tahoe Basin under RCP 8.5 for an
ensemble of four models.
TAHOE.UCDAVIS.EDU 6.19TAHOE: STATE OF THE L AKE REPORT 2018
CURRENT RESEARCH
This is not your grandparents’ climate, continued
Climate modeling - precipitation
Under the influence of climate change, air temperatures will mean that there mean of a four-model ensemble of expected
the expected difference in the Lake Tahoe will be less snow, continuing the historic precipitation from 2070 to 2099 on the
Basin’s precipitation will be small, but measured trend (see page 7.7). The figure right. The expected rain shadow is present
statistically significant. Despite this increase below compares the modeled historical in both, with higher precipitation evident
in precipitation, the projected warmer precipitation 1950 to 2005 on the left, to the on the west side of the lake.
The modeled historical precipitation from 1950 to 2005 is on the left. The predicted precipitation from
2070 to 2099 is on the right. Both represent the mean values from a four-model ensemble.
TAHOE.UCDAVIS.EDU 6.20TAHOE: STATE OF THE L AKE REPORT 2018
CURRENT RESEARCH
This is not your grandparents’ climate, continued
Climate modeling - climatic water deficit
The basin will also be drier in the coming The figures below show the differences in As the CWD increases, it leads to a drying
decades. The “climatic water deficit” (CWD) CWD for the period 1950-2005 to the period of the forest soils and added stress to the
is a measure of the amount of additional 2070-2099. CWD can be seen to increase forest. Such stress makes trees more prone
water that would have evaporated or throughout the basin, and by over 100% to disease and insect attack, as well as
transpired had it been present in the soil. on the north and east sides of the basin. increasing the wildfire hazard.
Figure 3 The difference in the spatial distribution of “climatic water deficit” (CWD) between the period
1950-2005 and 2070-2099.
TAHOE.UCDAVIS.EDU 6.21TAHOE: STATE OF THE L AKE REPORT 2018
CURRENT RESEARCH
What goes around, come around
A comparative study of two lakes
Gyres, or large-scale circulations, occur in Lake Tahoe and other large lakes.
They are important because they can rapidly transport contaminants across
the lake. How much they dilute contaminants requires an understanding of
turbulence.
Researchers from TERC, led by Alex Forrest, are collaborating with the
École Polytechnique Fédérale de Lausanne (EPFL, Switzerland) to measure
turbulence in gyres in Lake Geneva using the UC Davis underwater glider. A
newly acquired Rockland Scientific Microstructure sensor, mounted to the
front of the glider, provides the very rapid measurements (512 measurements
per second) of temperature which can be used to determine the turbulence
level.
Next summer the measurements will be repeated in Lake Tahoe as the
second part of this comparative study. Lake Geneva is where François-
Alphonse Forel founded the field of limnology. Forel corresponded with John
LeConte, the first limnologist at Lake Tahoe and the first professor hired by
the University of California.
Oscar Sepúlveda mounting the microstructure package onto
the glider at Lake Geneva. Photo: A. Bahr
TAHOE.UCDAVIS.EDU 6.22You can also read