Analysts' Ideas of the Week - Does AngloGold Ashanti's Financing Signal an M&A Event for this Gold Junior? - Baystreet.ca
←
→
Page content transcription
If your browser does not render page correctly, please read the page content below

Analysts' Ideas of the Week
Does AngloGold Ashanti’s Financing Signal an M&A Event for this Gold Junior?

                               May 10, 2021
                          www.researchfrc.com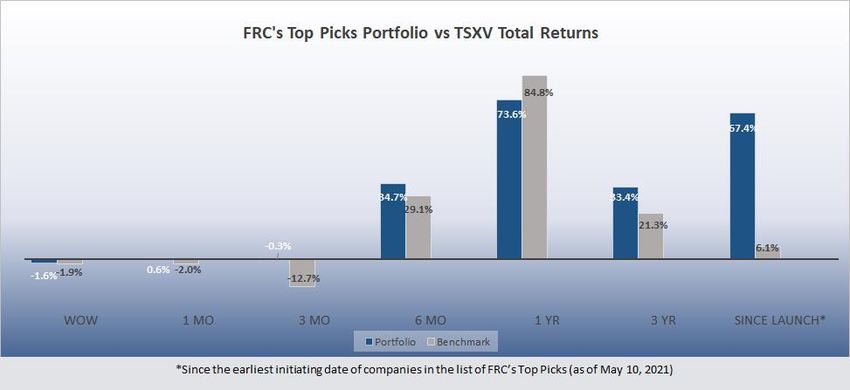
Page 2

                                     Reddit Discussed Stocks

Our last week’s pick, Precipio, Inc. (NASDAQ: PRPO) went up from $4.95 on last
Monday’s closing, to $9.18 the next day (up 85%). We note that the Electric Vehicle
(EV) sector is the most actively discussed among retail investors, followed by cannabis
and sports betting. This week, we are observing strong retail sentiment around,
Protagenic Therapeutics (NASDAQ: PTIX). Key parameters used may include – a) total
number of mentions, b) percentage change in the number of mentions, c) stock
sentiment, d) stock price trend, and e) market capitalization.

      May 10, 2021
      Company                                        Ticker Sector
      Protagenic Therapeutics, Inc.                  PTIX Diagnostics & Research
                                                  Source: FRC

                                             FRC Top Picks
The following table shows last week’s top five performers among our Top Picks,
including four junior resource companies (two gold and two silver), and one Mortgage
Investment Corporation. The top performer, Corvus Gold (TSX: KOR), was up 18%
WoW, due to a financing arrangement with AngloGold Ashanti. Additional
comments on Corvus are presented later in this report. Our reports on KOR can be
viewed here.

                                   Top Five Performers Last Week

                                                  Source: FRC

Our portfolio (equally weighted) outperformed the benchmark (TSXV) in six out of
seven time periods we track.

   ©2021 Fundamental Research Corp. “17+ Years of Bringing Undiscovered Investment Opportunities to the Forefront”
                    Click here to view FRC’s complete list of top picks
      PLEASE READ THE IMPORTANT DISCLOSURES AT THE BACK OF THIS REPORT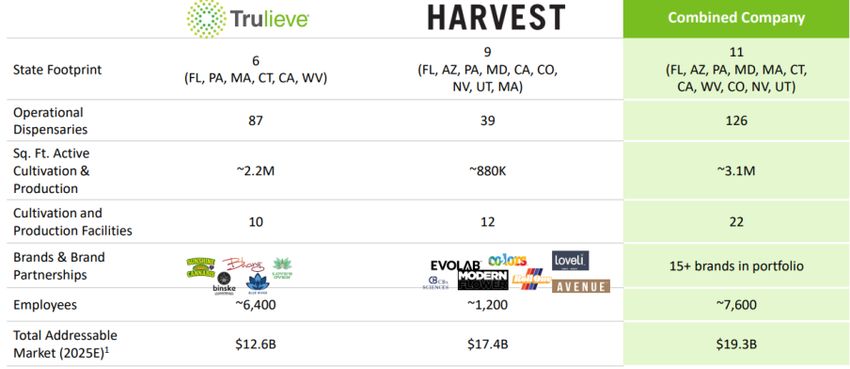
Page 3

                                         Performance by Sector

                                                  Source: FRC

Our complete list of top picks (updated weekly) can be viewed here.

                                  Weekly Mining Commentary

Six out of seven global equity indices we track returned positive returns last week.

   ©2021 Fundamental Research Corp. “17+ Years of Bringing Undiscovered Investment Opportunities to the Forefront”
                    Click here to view FRC’s complete list of top picks
      PLEASE READ THE IMPORTANT DISCLOSURES AT THE BACK OF THIS REPORT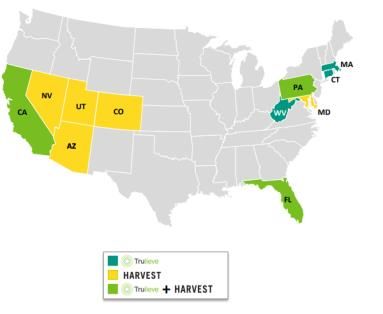
Page 4

Weakness in the US$ drove mainstream metal prices higher. Once again, copper
was the best weekly performer, as inventory levels fell sharply on the LME, and
manufacturing activities picked up in China last month. We recently uploaded a video on
attractive copper targets on our Youtube channel.

                                            Source: MarketWatch

   ©2021 Fundamental Research Corp. “17+ Years of Bringing Undiscovered Investment Opportunities to the Forefront”
                    Click here to view FRC’s complete list of top picks
      PLEASE READ THE IMPORTANT DISCLOSURES AT THE BACK OF THIS REPORT
Page 5
China Manufacturing PMI
Source: Trading Economics
©2021 Fundamental Research Corp. “17+ Years of Bringing Undiscovered Investment Opportunities to the Forefront”
Click here to view FRC’s complete list of top picks
PLEASE READ THE IMPORTANT DISCLOSURES AT THE BACK OF THIS REPORTPage 6
Valuations of gold producers were up 9% WoW; base metal producers were up
12%.
©2021 Fundamental Research Corp. “17+ Years of Bringing Undiscovered Investment Opportunities to the Forefront”
Click here to view FRC’s complete list of top picks
PLEASE READ THE IMPORTANT DISCLOSURES AT THE BACK OF THIS REPORTPage 7
Source: S&P Capital IQ & FRC
For two weeks in a row, India was the only country among the top 15 hardest hit
nations to report a WoW increase in new COVID-19 cases. Only 9.7% of India’s
population has received a dose of vaccine vs 9.2% at the same time last week. At
current rates, we expect India to take 10 more months to vaccinate 50% of its
population.
©2021 Fundamental Research Corp. “17+ Years of Bringing Undiscovered Investment Opportunities to the Forefront”
Click here to view FRC’s complete list of top picks
PLEASE READ THE IMPORTANT DISCLOSURES AT THE BACK OF THIS REPORTPage 8
Source: https://www.worldometers.info/coronavirus/
Highly vaccinated nations such as the U.S., the U.K., and Israel, continued to
report flat or declines in new cases. 45.5% of the U.S. population has received
vaccinations (at least one dose) vs 44.0% at the same time last week. This compares to
52.1% in the U.K. (up from 50.8%), and 38.9% in Canada (up from 33.6%). We note
that the vaccination rate has declined steeply in countries that have over 40% of its
population vaccinated (at least one dose). For example, the U.S.’ weekly vaccination
has declined from 4% of its population in April 2021, to 1.5%. This has been the case
with the other five countries that have surpassed 40%. We believe the primary reason
for this is vaccine hesitancy among a high percentage of the population. We
continue to estimate that 50% of the U.S. population will be vaccinated by June. At
current rates, we estimate that Germany/France/Italy are expected to reach 50% by
July/August. South American countries are expected to hit 50% by October.
©2021 Fundamental Research Corp. “17+ Years of Bringing Undiscovered Investment Opportunities to the Forefront”
Click here to view FRC’s complete list of top picks
PLEASE READ THE IMPORTANT DISCLOSURES AT THE BACK OF THIS REPORTPage 9
Source: https://www.worldometers.info/coronavirus/
We are maintaining our metals price forecasts.
The table below summarizes the changes we made in ratings/fair value estimates/EPS
projections of companies under coverage in this report.
1. Completed deliverables per our agreement with the company.
2. Management has been unwilling to provide us with responses to our questions regarding their recent 2020
year-end financial results.
In the following section, we review companies that announced key developments in the
past week.
©2021 Fundamental Research Corp. “17+ Years of Bringing Undiscovered Investment Opportunities to the Forefront”
Click here to view FRC’s complete list of top picks
PLEASE READ THE IMPORTANT DISCLOSURES AT THE BACK OF THIS REPORTPage 10
Mining / Exploration
Company Ticker Current Share FRC Fair Value Date of PR:
Name: Symbol Price: Estimate:
Corvus Gold Inc. TSX: KOR $3.15 $3.75 May 6, 2021
PR Content FRC Opinion
Entered into a US$20M loan agreement Positive – This is a vote of confidence from
(at 1.1% p.a.) with AngloGold Ashanti AU, especially considering that AU already
(NYSE: AU) to fund ongoing permitting owns 19.7% equity. We have previously
and pre-development work at the North stated that KOR is an attractive acquisition
Bullfrog project, and exploration at its target for majors. This move by AU is an
Mother Lode and Lynnda Strip projects. indication that an M&A event is around the
corner. A recently completed PEA on the
NB project had returned an ATNPV5% of
US$452M, with an AT-IRR of 47%, using
US$1,500 per oz gold. Corvus’ current
MCAP is C$397M, implying that the market
is not only discounting NB’s value, but also
assigning zero value to Mother Lode.
Company Ticker Current Share FRC Fair Value Date of PR:
Name: Symbol Price: Estimate:
Golden Minerals NYSE: AUMN US$0.76 US$0.92 May 6, 2021
Corp.
PR Content FRC Opinion
Reported $1.8M revenue in Q1, with an Positive – We note that it is highly unusual
operating profit of $0.2M. Produced 1,559 for a brand new producer to report operating
oz, and sold 1,054 oz gold equivalent in profits in the first quarter of production.
the quarter. AUMN commenced production at Rodeo in
January. Management’s 2021 production
guidance remains unchanged at 12,000 to
14,000 oz. We are expecting US$12M in
operating cash flows this year, with
US$800/oz in cash costs. The company
maintained a strong balance sheet at the
end of Q1, with $8M in cash.
©2021 Fundamental Research Corp. “17+ Years of Bringing Undiscovered Investment Opportunities to the Forefront”
Click here to view FRC’s complete list of top picks
PLEASE READ THE IMPORTANT DISCLOSURES AT THE BACK OF THIS REPORTPage 11
Company Ticker Current Share FRC Fair Value Date of PR:
Name: Symbol Price: Estimate:
K9 Gold Corp. TSXV: KNC $0.53 $0.65 May 4, 2021
PR Content FRC Opinion
Announced a $2.25M private placement Positive - Shares are up 53% since we
at $0.30 per unit. Sprott is expected to initiated coverage on February 25, 2021.
subscribe for $2M. Each unit will consist Funds will be used towards an upcoming
of a share and one full warrant (exercise drill program on its Stony Lake project in
price of $0.40 for three years). central Newfoundland. Stony Lake lies
along a 27 km trend between Marathon
Gold’s (TSX: MOZ) Valentine Lake project
and Sokoman Minerals’ (TSXV: SIC)
Moosehead project, and on a parallel
structure to New Found Gold’s (TSXV:
NFG) Queensway project.
Company Ticker Current Share FRC Fair Value Date of PR:
Name: Symbol Price: Estimate:
South Star TSXV: STS $0.21 $0.52 May 10, 2021
Mining
PR Content FRC Opinion
Entered into a MOU with a European Positive – Management is working on
industrial company for an offtake multiple other similar offtake agreements.
agreement for 4,000 tonnes of flake The company is preparing to start
graphite. Terms were undisclosed. construction of Phase 1 (5,000 tpy) this
year, with commercial production targeted
for Q4-2022. STS has all the required
permits to advance to construction,
commissioning, and production. Per a
recent PFS, STS’ Santa Cruz graphite
project in Brazil has an ATNPV5% of US$81
million. STS’ MCAP is $15M.
©2021 Fundamental Research Corp. “17+ Years of Bringing Undiscovered Investment Opportunities to the Forefront”
Click here to view FRC’s complete list of top picks
PLEASE READ THE IMPORTANT DISCLOSURES AT THE BACK OF THIS REPORTPage 12
Company Ticker Current Share FRC Fair Value Date of PR:
Name: Symbol Price: Estimate:
Rio2 Limited TSXV: RIO $0.79 $1.40 May 4, 2020
PR Content FRC Opinion
Provided an update regarding its Positive - We are pleased to see that
progress on the Fenix gold project in management has maintained their
Chile. Preparations are ongoing to production timeline of H2-2022. A recent
commence production in late 2022. The PFS, which used US$1,400 per oz gold,
company expects to receive an had shown an AT-NPV5% of US$181M,
Environmental Impact Assessment with an AT-IRR of 36%. RIO’s current
approval in H1-2022, followed by a MCAP is C$158M.
construction permit.
Company Ticker Current Share FRC Fair Value Date of PR:
Name: Symbol Price: Estimate:
Blue Lagoon CSE: BLLG $0.56 $1.03 May 5, 2021
Resources
PR Content FRC Opinion
The toll milling arrangement with Nicola Positive - The Dome Mountain gold mine
Mining (TSXV: NIM) has been extended project can be advanced to production for
for two years, through to March 2023. In under $2M in CAPEX. The toll milling
April, BLLG sent its first truck of gold and arrangement allows for a quick route to
silver mill feed to Nicola. production. BLLG also has aggressive
exploration plans as 90% of its 19,000 ha
land package is untested.
Company Ticker Current Share FRC Fair Value Date of PR:
Name: Symbol Price: Estimate:
Colibri TSXV: CBI $0.135 $0.17 May 4, 2021
Resources
Corporation
PR Content FRC Opinion
Preliminary met tests conducted by Positive - Tocvan is in year two of a five-
partner, Tocvan Ventures (CSE: TOC), year option agreement to earn a 51%
on the Pilar gold project, returned gold interest in Pilar. Most of our fair value
recoveries of 91.6% and 90.6% from two estimate on CBI comes from the Pilar
samples. Tocvan has completed 1,394 m project; we have a 150 Koz preliminary
of a planned 2,400 m drill program. estimate on it. We will be publishing an
update report shortly.
©2021 Fundamental Research Corp. “17+ Years of Bringing Undiscovered Investment Opportunities to the Forefront”
Click here to view FRC’s complete list of top picks
PLEASE READ THE IMPORTANT DISCLOSURES AT THE BACK OF THIS REPORTPage 13
Company Ticker Current Share FRC Fair Value Date of PR:
Name: Symbol Price: Estimate:
Grid Metals TSXV: GRDM $0.25 $0.54 May 5, 2021
Corp.
PR Content FRC Opinion
Additional results from the drill program at Positive - The current program is an
the East Bull Lake ("EBL") palladium encouraging follow up to the 2020 program.
property in Ontario returned very high EBL is an early stage/relatively untested
grades: property in Sudbury. GRDM has yet to
announce plans for its flagship advanced
➢ 0.54 m of 37.6 g/t palladium and stage nickel-copper-palladium asset in
21.3% copper Manitoba. A 2014 PEA had returned an AT-
➢ 1.0 m of 11.5 g/t Pd NPV7.5% of $97M, based on US$3.4/lb
copper, and US$8.5/lb nickel. Grid’s MCAP
is just $19M.
Company Ticker Current Share FRC Fair Value Date of PR:
Name: Symbol Price: Estimate:
GR Silver Mining TSXV: GRSL $0.73 $0.98 May 6, 2021
Ltd.
PR Content FRC Opinion
Made the final option payment of $2.5M, Positive – As we had expected this move,
and issued 1.5M common shares to SSR we are maintaining our fair value estimate.
Mining (TSX: SSRM) to increase its The company is preparing maiden resource
ownership in San Marcial to 100%. estimates on its Plomosas and San Juan
projects (expected in Q2). Note that our fair
value estimate is solely based on San
Marcial, which has an indicated resource of
36 Moz, and an inferred resource of 11
Moz. GRSL is well funded via a recently
completed $11.5M bought deal financing.
©2021 Fundamental Research Corp. “17+ Years of Bringing Undiscovered Investment Opportunities to the Forefront”
Click here to view FRC’s complete list of top picks
PLEASE READ THE IMPORTANT DISCLOSURES AT THE BACK OF THIS REPORTPage 14
Company Ticker Current Share FRC Fair Value Date of PR:
Name: Symbol Price: Estimate:
Doubleview TSXV:DBG $0.36 $0.47 May 7, 2021
Gold Corp.
PR Content FRC Opinion
Initial flotation tests demonstrate that it is Positive - These recoveries are
possible to produce a high-gold/low encouraging. We are expecting a maiden
cobalt-copper concentrate, and a high- resource estimate on Hat this year. Our fair
cobalt/low gold pyrite concentrate from its value estimate is based on just 10% of our
Hat copper-gold-cobalt project in B.C. preliminary resource estimate (540 Mt at
These tests showed potential recoveries 0.57 gpt AuEq) on Hat.
of 82% copper, 87% gold, and 74%
cobalt.
Company Ticker Current Share FRC Fair Value Date of PR:
Name: Symbol Price: Estimate:
Mammoth TSXV: MTH $0.14 $0.27 Apr 22, 2021
Resources
PR Content FRC Opinion
Encouraging results from an additional Positive – MTH is continuing with its
two kilometres of 3D drill target modelling modeling to identify drill targets. The
from a geophysical survey recently company has a permit to drill up to 139
completed at its Tenoriba gold-silver holes. Note that Tenoriba is only partially
property in Mexico. tested, and has characteristics associated
with high sulphidation epithermal precious
metal systems over a large 15 sq. km area.
Technology, Energy, and Special Situations
Company Ticker Current Share FRC Fair Value Date of PR:
Name: Symbol Price: Estimate:
Banxa Holdings TSXV: BNXA $5.25 $13.30 May 5, 2021
Inc.
PR Content FRC Opinion
Announced record $110M in Total Positive – Our TTV estimate for FY2021
Transaction Value (TTV) in April 2021, (12 months ending June 30, 2021) is
exceeding the $100M mark for the first A$700M (unchanged), with A$18M in
time. In the first ten months of FY2021 revenue.
(ended April 30, 2021), the company’s
TTV was $510M.
©2021 Fundamental Research Corp. “17+ Years of Bringing Undiscovered Investment Opportunities to the Forefront”
Click here to view FRC’s complete list of top picks
PLEASE READ THE IMPORTANT DISCLOSURES AT THE BACK OF THIS REPORTPage 15
Company Ticker Current Share FRC Fair Value Date of PR:
Name: Symbol Price: Estimate:
BIGG Digital CSE: BIGG $1.37 $5.11 May 5, 2021
Assets Inc.
PR Content FRC Opinion
Announced record monthly trading Positive – We are estimating 2021 full-year
volume of $147M in April (vs $264M in trading volume of $930M, and revenue of
Q1-2021), with monthly revenue of $15M (unchanged). We are not overly
$1.55M, up 31% MoM. Management concerned with the delay in fling as the
announced a delay in annual filings due crypto space is new, and we feel auditors
to a longer than anticipated auditing are likely to take more time to complete their
process. process. That said, we will be closely
monitoring the company’s developments
and issue updates/notes as required.
Company Ticker Current Share FRC Fair Value Date of PR:
Name: Symbol Price: Estimate:
Diginex Limited NASDAQ: $5.33 $24.70 May 4, 2021
EQOS
PR Content FRC Opinion
Announced that spot and derivative Positive – We are pleased to see Diginex
trading volumes on its platform exceeded positing strong April numbers, as did the
$2B in the 30 days ended May 4th, with other companies we cover in the crypto
300% MoM growth. space. For 2021, we are estimating $17B in
trading volume, and $10.2M in revenue
(unchanged).
©2021 Fundamental Research Corp. “17+ Years of Bringing Undiscovered Investment Opportunities to the Forefront”
Click here to view FRC’s complete list of top picks
PLEASE READ THE IMPORTANT DISCLOSURES AT THE BACK OF THIS REPORTPage 16
Cannabis
Company Ticker Current Share FRC Fair Value Date of PR:
Name: Symbol Price: Estimate:
Halo Collective NEO: HALO $0.09 $0.24 May 5, 2021
Inc.
PR Content FRC Opinion
Announced April 2021 revenue of $3.6M Positive – We are pleased to see the
from retail product sales in Oregon and company’s products being well received in
California. Management also announced the Oregon and California markets. With
an at-the-market equity financing program multiple expansion projects underway, the
to potentially raise up to C$20M. equity financing option adds more flexibility
to the company. We are maintaining our
estimate of $80M in revenue in 2021, with
approximately 90% of it coming from its
U.S. operations.
Weekly Cannabis Commentary
Cannabis Industry Performance
May 7, 2021
U.S. Companies YTD 1-Week 1-Year
Curaleaf Holdings Inc. 22% 2% 242%
Trulieve Cannabis Corp. 26% -5% 298%
Green Thumb Industries Inc. 28% -4% 350%
Cresco Labs Inc. 30% -1% 292%
Canadian Companies YTD 1-Week 1-Year
Aphria Inc. 121% -13% 261%
Aurora Cannabis Inc. 0% -1% -6%
Canopy Growth Corp. -3% -8% 42%
Cronos Group Inc. 6% -6% 19%
Tilray Inc. 92% -13% 113%
HEXO Corp. 90% 7% 214%
Organigram Holdings Inc. 97% 2% 63%
The Supreme Cannabis Co., Inc. 109% -7% 35%
Canadian Average 64% -5% 93%
U.S. Average 27% -2% 296%
Canadian MIN -3% -13% -6%
U.S. MIN 22% -5% 242%
Canadian MAX 121% 7% 261%
U.S. MAX 30% 2% 350%
Indices
Canadian YTD 1-Week 1-Year
HMMJ 27% -5% 61%
MCAN 23% -3% 73%
XCAN 22% -3% 68%
U.S. YTD 1-Week 1-Year
MSOS 15% -1% N/A*
*Launched on September 1, 2020 *Launched on September 1, 2020
Source: FRC
©2021 Fundamental Research Corp. “17+ Years of Bringing Undiscovered Investment Opportunities to the Forefront”
Click here to view FRC’s complete list of top picks
PLEASE READ THE IMPORTANT DISCLOSURES AT THE BACK OF THIS REPORTPage 17
Today, Florida-based Trulieve Cannabis (OTC: TCNNF) announced an agreement to
acquire Arizona-based Harvest Health & Recreation (OTCQX: HRVSF) in an all-share
deal valued at US$2.1B, the largest U.S. cannabis transaction to date. The implied
EV/R acquisition multiple is 9x vs the sector average of 12x. The combined entity
has operations in 11 states in the U.S., with 22 growing and processing facilities, and
126 cannabis stores.
Trulieve and Harvest Health & Recreation Combined Operations
Source: Company
In Canada, cannabis industry consolidation continues. On May 5, 2021, Sundial
Growers (NASDAQ: SNDL) announced its plans to acquire Inner Spirit Holdings (CSE:
ISH). The implied EV/R acquisition multiple of this C$131M deal is 5x vs the sector
average of 16x. The acquisition price is 72% of our last fair value estimate (March
30, 2021).
Recent data published by Statistics Canada showed that cannabis extracts sales
grew 242%, from Q1-2020 to Q4-2020, to reach $124M. Even with this sizeable
growth, extracts and concentrates only accounted for 15% of Q4 total cannabis sales –
indicating significant room for further growth. We note that mature markets such as
Colorado have over 30% from extracts and concentrates.
©2021 Fundamental Research Corp. “17+ Years of Bringing Undiscovered Investment Opportunities to the Forefront”
Click here to view FRC’s complete list of top picks
PLEASE READ THE IMPORTANT DISCLOSURES AT THE BACK OF THIS REPORTPage 18
Canadian Cannabis Sales in 2020
Source: MJBizDaily.com
Valuation
As of May 7, 2021, the Canadian big four LPs were trading at a 94% premium
(down from 106% in previous week) over their U.S. peers. The valuation gap
between the two sectors decreased WoW as the Canadian sector underperformed, per
our anticipation. Two factors contributed to this - declining Canadian cannabis sales
data, and increased short position in Canadian cannabis stocks (discussed in the
previous AIW).
April 30, 2021 May 7, 2021
Canadian Companies Ticker TEV/Revenue TEV/EBITDA TEV/Revenue TEV/EBITDA
Aphria Inc. TSX: APHA 11.0 NM N/A NM
Aurora Cannabis Inc. TSX: ACB 7.9 NM 7.8 NM
Canopy Growth Corp. TSX: WEED 23.7 NM 21.9 NM
Cronos Group Inc. TSX: CRON 49.9 NM 44.7 NM
Tilray Inc. NASDAQ: TLRY 17.2 NM 9.6 NM
HEXO Corp. NYSE: HEXO 8.7 NM 9.5 NM
Organigram Holdings Inc. TSX: OGI 13.3 NM 13.7 NM
The Supreme Cannabis Co., Inc. TSX: FIRE 6.1 NM 5.7 NM
AVERAGE 17.2 NM 16.1 NM
MEDIAN 12.1 NM 9.6 NM
MINIMUM 6.1 NM 5.7 NM
MAXIMUM 49.9 NM 44.7 NM
U.S. Companies Ticker TEV/Revenue TEV/EBITDA TEV/Revenue TEV/EBITDA
Curaleaf Holdings Inc. OTC: CURLF 15.7 59.9 16.7 63.5
Trulieve Cannabis Corp. OTC TCNNF 10.1 21.28 9.9 20.95
Green Thumb Industries Inc. OTC: GTBIF 12.9 45.2 12.6 44.2
Cresco Labs Inc. OTC: CRLBF 9.6 38.35 9.6 38.43
AVERAGE 12.1 41.2 12.2 41.8
MEDIAN 11.5 41.8 11.3 41.3
MINIMUM 9.6 21.3 9.6 21.0
MAXIMUM 15.7 59.9 16.7 63.5
Canadian Big Four Average 30.2 25.4
WEED, APHA, TLRY, CRON Median 23.7 21.9
Implied Premium Over U.S. Big Four (Median) 106% 94%
Source: S&P Capital IQ, FRC
©2021 Fundamental Research Corp. “17+ Years of Bringing Undiscovered Investment Opportunities to the Forefront”
Click here to view FRC’s complete list of top picks
PLEASE READ THE IMPORTANT DISCLOSURES AT THE BACK OF THIS REPORTPage 19
The following chart shows the average EV/R of the companies we track in both sectors:
Average EV/R (October 2019 – May 2021)
Source: S&P Capital IQ, FRC
Canadian Retail Cannabis Pricing
Province (As of 2021/05/10) Average Price per Gram Average Price per Gram THC Average Price per Gram CBD # of Products Min. Price Max. Price
B.C. $ 9.79 $ 9.87 $ 8.42 220 $ 3.53 $ 15.71
Ontario $ 9.58 $ 9.77 $ 7.93 356 $ 3.66 $ 22.66
Quebec $ 9.37 $ 9.36 $ 9.44 250 $ 4.85 $ 21.68
Alberta $ 10.95 $ 10.95 $ 10.82 375 $ 3.52 $ 22.00
N.B. $ 9.49 $ 9.65 $ 7.49 216 $ 3.57 $ 16.28
P.E.I. $ 9.65 $ 9.67 $ 9.34 170 $ 2.20 $ 23.30
Newfoundland $ 10.02 $ 9.96 $ 10.36 161 $ 4.46 $ 15.40
Yukon $ 16.33 $ 16.92 $ 13.95 5 $ 13.68 $ 22.28
N.S. $ 10.13 $ 10.17 $ 9.66 389 $ 5.14 $ 42.85
Nunavut $ 13.15 $ 13.35 $ 12.41 32 $ 9.43 $ 17.91
Northwest Territories $ 14.68 $ 14.68 2 $ 12.08 $ 17.28
Manitoba $ 11.44 $ 11.37 $ 11.55 357 $ 4.87 $ 23.57
Saskatchewan $ 12.09 $ 12.09 $ 12.07 244 4.40 38.50
CANADA $ 11.28 $ 11.37 $ 10.29
Province (As of 2021/05/03) Average Price per Gram Average Price per Gram THC Average Price per Gram CBD # of Products Min. Price Max. Price
B.C. $ 9.78 $ 9.87 $ 8.42 220 $ 3.53 $ 15.71
Ontario $ 9.61 $ 9.80 $ 7.93 356 $ 3.66 $ 22.66
Quebec $ 9.38 $ 9.38 $ 9.44 250 $ 4.85 $ 21.68
Alberta $ 11.01 $ 11.01 $ 10.82 375 $ 3.52 $ 22.00
N.B. $ 9.49 $ 9.66 $ 7.49 216 $ 3.57 $ 16.28
P.E.I. $ 9.65 $ 9.67 $ 9.34 170 $ 2.20 $ 23.30
Newfoundland $ 10.02 $ 9.96 $ 10.36 161 $ 4.46 $ 15.40
Yukon $ 16.33 $ 16.92 $ 13.95 5 $ 13.68 $ 22.28
N.S. $ 10.17 $ 10.22 $ 9.66 193 $ 5.36 $ 42.85
Nunavut $ 13.15 $ 13.35 $ 12.41 32 $ 9.43 $ 17.91
Northwest Territories $ 14.68 $ 14.68 2 $ 12.08 $ 17.28
Manitoba $ 11.44 $ 11.37 $ 11.55 357 $ 4.87 $ 23.57
Saskatchewan $ 12.09 $ 12.09 $ 12.07 244 4.40 38.50
CANADA $ 11.29 $ 11.38 $ 10.29
Source: Online Provincial Cannabis Stores, FRC
The average retail price per gram decreased week-over-week, from $11.29 to
$11.28. The chart below shows the Canadian retail dried cannabis flower pricing trend:
©2021 Fundamental Research Corp. “17+ Years of Bringing Undiscovered Investment Opportunities to the Forefront”
Click here to view FRC’s complete list of top picks
PLEASE READ THE IMPORTANT DISCLOSURES AT THE BACK OF THIS REPORTPage 20
Canadian Retail Dried Cannabis Flower Pricing
Source: Online Provincial Cannabis Stores, FRC
Canadian Retail Cannabis Stores
As of May 10, 2021, there are 1,982 retail cannabis stores, a week-over-week increase
of 33 stores across Canada, with 23 in Ontario, and five each in Alberta and B.C.
Nationwide Store Count
©2021 Fundamental Research Corp. “17+ Years of Bringing Undiscovered Investment Opportunities to the Forefront”
Click here to view FRC’s complete list of top picks
PLEASE READ THE IMPORTANT DISCLOSURES AT THE BACK OF THIS REPORTPage 21
April-19-2021 April-26-2021 May-3-2021 May-10-2021
Geographic Region Store Count Store Count Store Count Store Count Population Population / Store
Alberta 611 616 618 623 4,428,247 7,108
B.C. 331 331 333 338 5,120,184 15,148
Manitoba 73 73 80 80 1,379,121 17,239
N.B. 20 20 20 20 780,890 39,045
N.S. 24 24 25 25 978,274 39,131
Newfoundland 30 30 30 30 520,437 17,348
Northwest Territories 6 6 6 6 44,982 7,497
Nunavut N/A N/A N/A N/A 39,486 N/A
Ontario 622 652 692 715 14,745,040 20,622
P.E.I. 4 4 4 4 158,717 39,679
Quebec 68 68 68 68 8,552,362 125,770
Saskatchewan 62 62 68 68 1,181,987 17,382
Yukon 5 5 5 5 41,293 8,259
CANADA 1,856 1,891 1,949 1,982 37,971,020 19,158
Source: Provincial Websites, FRC
Weekly Psychedelic Commentary
Psychedelic Industry Performance
May 7, 2021
Company YTD 1-Week 1-Year
COMPASS Pathways plc -31% -9% N/A
Numinus Wellness Inc. -19% -16% N/A
Mind Medicine Inc. 7% -15% N/A
Seelos Therapeutics Inc. 244% -12% 810%
AVERAGE 50% -13% 810%
MIN -31% -16% 810%
MAX 244% -9% 810%
Index YTD 1-Week 1-Year
PSYK -9% -8% N/A*
*Launched on January 27, 2021 *Launched on January 27, 2021
Source: TMX Money, FRC
Over the past week, PSYK was down 8%.
©2021 Fundamental Research Corp. “17+ Years of Bringing Undiscovered Investment Opportunities to the Forefront”
Click here to view FRC’s complete list of top picks
PLEASE READ THE IMPORTANT DISCLOSURES AT THE BACK OF THIS REPORTPage 22
Disclaimers and Disclosure
The opinions expressed in this report are the true opinions of the analyst(s) about any companies and industries mentioned. Any
“forward looking statements” are our best estimates and opinions based upon information that is publicly available and that we
believe to be correct, but we have not independently verified with respect to truth or correctness. There is no guarantee that our
forecasts will materialize. Actual results will likely vary. Certain companies mentioned in pages 2, and 10-16 are covered by FRC
under an issuer paid model. FRC or companies with related management, and Analysts, may hold shares in some companies
mentioned in this report including Barrick, STS and PSYK. Distribution procedure: our reports are distributed first to our web-based
subscribers on the date shown on this report then made available to delayed access users through various other channels for a
limited time.
To subscribe for real-time access to research, visit https://www.researchfrc.com/website/subscribe for subscription options.
This report contains "forward looking" statements. Forward-looking statements regarding the Company, industry, and/or stock’s
performance inherently involve risks and uncertainties that could cause actual results to differ from such forward-looking statements.
Factors that would cause or contribute to such differences include, but are not limited to, continued acceptance of the Company's
products/services in the marketplace; acceptance in the marketplace of the Company's new product lines/services; competitive
factors; new product/service introductions by others; technological changes; dependence on suppliers; systematic market risks and
other risks discussed in the Company's periodic report filings, including interim reports, annual reports, and annual information forms
filed with the various securities regulators. By making these forward-looking statements, Fundamental Research Corp. and the
analyst/author of this report undertakes no obligation to update these statements for revisions or changes after the date of this
report.
Fundamental Research Corp DOES NOT MAKE ANY WARRANTIES, EXPRESSED OR IMPLIED, AS TO RESULTS TO BE
OBTAINED FROM USING THIS INFORMATION AND MAKES NO EXPRESS OR IMPLIED WARRANTIES OR FITNESS FOR A
PARTICULAR USE. ANYONE USING THIS REPORT ASSUMES FULL RESPONSIBILITY FOR WHATEVER RESULTS THEY
OBTAIN FROM WHATEVER USE THE INFORMATION WAS PUT TO. ALWAYS TALK TO YOUR FINANCIAL ADVISOR BEFORE
YOU INVEST. WHETHER A STOCK SHOULD BE INCLUDED IN A PORTFOLIO DEPENDS ON ONE’S RISK TOLERANCE,
OBJECTIVES, SITUATION, RETURN ON OTHER ASSETS, ETC. ONLY YOUR INVESTMENT ADVISOR WHO KNOWS YOUR
UNIQUE CIRCUMSTANCES CAN MAKE A PROPER RECOMMENDATION AS TO THE MERIT OF ANY PARTICULAR
SECURITY FOR INCLUSION IN YOUR PORTFOLIO. This REPORT is solely for informative purposes and is not a solicitation or an
offer to buy or sell any security. It is not intended as being a complete description of the company, industry, securities or
developments referred to in the material. Any forecasts contained in this report were independently prepared unless otherwise
stated, and HAVE NOT BEEN endorsed by the Management of the company which is the subject of this report. Additional
information is available upon request. THIS REPORT IS COPYRIGHT. YOU MAY NOT REDISTRIBUTE THIS REPORT WITHOUT
OUR PERMISSION. Please give proper credit, including citing Fundamental Research Corp and/or the analyst, when quoting
information from this report. The information contained in this report is intended to be viewed only in jurisdictions where it may be
legally viewed and is not intended for use by any person or entity in any jurisdiction where such use would be contrary to local
regulations or which would require any registration requirement within such jurisdiction.
©2021 Fundamental Research Corp. “17+ Years of Bringing Undiscovered Investment Opportunities to the Forefront”
Click here to view FRC’s complete list of top picks
PLEASE READ THE IMPORTANT DISCLOSURES AT THE BACK OF THIS REPORTYou can also read