ProjectManagement: an R Package for Managing Projects - The R Journal
←
→
Page content transcription
If your browser does not render page correctly, please read the page content below
C ONTRIBUTED RESEARCH ARTICLE                                                                                               419

          ProjectManagement: an R Package for
          Managing Projects
          by Juan Carlos Gonçalves-Dosantos1 , Ignacio García-Jurado and Julián Costa

          Abstract Project management is an important body of knowledge and practices that comprises the
          planning, organisation and control of resources to achieve one or more pre-determined objectives. In
          this paper, we introduce ProjectManagement, a new R package that provides the necessary tools to
          manage projects in a broad sense, and illustrate its use by examples.

          Introduction

          Project management is an important body of knowledge and practices that comprises the planning,
          organisation and control of resources to achieve one or more pre-determined objectives. The most
          commonly used methods for project planning are PERT (Program Evaluation and Review Technique
          model) and CPM (Critical Path Method). PERT/CPM analyses the tasks involved in completing a
          project, especially the time needed to complete each task, and computes the minimum time needed
          to complete the total project. Through the data obtained in the analysis of the project, PERT/CPM
          identifies the critical activities, which are those for which any disturbance in its duration modifies
          the minimum time of execution of the project. Also, it obtains the times that can be assigned to
          non-critical activities, called slacks, in addition to their fixed durations, to give them flexibility. Project
          management often deals with the problem of redistribution of resources. Sometimes it is convenient to
          reduce the time of an activity by increasing the assigned costs. Other times, when the availability of
          resources is limited in a period of time, it may be necessary to level the use of those resources. These
          situations require a re-planning of the project.
              Even with good project management, once the project has been carried out and the actual durations
          of the activities are known, there can be a delay in the completion time of the project. When the
          delay generates an additional cost, ways are needed to distribute the cost of the delay among the
          different tasks involved. To solve this problem we can use cooperative game theory and rules based
          on bankruptcy problems.
              The essential elements related to project management can be found in Castro et al. (2007) or in
          Hillier and Lieberman (2001). Project management techniques have been widely used in all fields of
          engineering. Hall (2012) reviews the impact that such techniques have in various fields and their broad
          business opportunities. Their fields of application vary from classical construction and engineering to
          information technology and software development, including modern agile methods. Schmitz et al.
          (2019) also argue the usefulness of traditional project management techniques in the context of agile
          methodology. Evdokimov et al. (2018) include a case study that shows the current relevance of project
          management techniques in software development. Özdamar and Ulusoy (1995) present a survey of
          the problem of resource constraints. To distribute the delay cost of the project among the activities,
          Brânzei et al. (2002) provide two rules using, respectively, a game theoretical and a bankruptcy-based
          approach, and Bergantiños et al. (2018) introduce and analyse a consistent rule based on the Shapley
          value.
               A well-known project management software is Microsoft Project. This tool is designed to create
          and control a project, through the allocation of resources to tasks, the management of budget and
          workloads, as well as monitoring developments. Microsoft Project is not open source and its license
          is fee-based. Other project management applications have been created as free software, such as
          OpenProj, PpcProject or ProMes (Gregoriou et al., 2013). In Salas-Morera et al. (2013) we can see a
          useful comparison of these applications.
               The aforementioned tools are written in Java or Phyton. To the best of our knowledge, there are
          only two packages in R available for project management. PlotPrjNetworks (Muñoz, 2015) and plan
          (Kelley, 2018) are packages that offer the user the creation of a Gantt diagram for the visualization of
          the project structure. In our opinion, a tool was missing to manage a project from its development to
          its control. We believe that such a tool would be useful for the user community because it could be
          integrated with other tools developed in R, it could be easily modified to suit the specific needs of
          each user, and it could be wrapped into a graphical interface.
              In this paper, we introduce ProjectManagement1 (Gonçalves-Dosantos et al., 2020b), a new R
          package that provides the necessary tools to manage projects in a broad sense. It calculates the critical
          activities, the slack of each activity, the minimum duration of the project and the early and last times of
             1 https://github.com/Juan-Goncalves-Dosantos/ProjectManagement.git

          The R Journal Vol. 12/1, June 2020                                                         ISSN 2073-4859
C ONTRIBUTED RESEARCH ARTICLE 420
each activity. It plots a graph of the project and the schedule. The package also allows cost management
to reduce the minimum project time, as well as resource management. Once the actual durations of the
activities are known, it is possible to distribute the delay generated in the project among the different
activities. When activity durations are considered random variables, the package provides additional
functionality. In particular, it calculates the average duration of the project and the criticality index of
each activity. It plots a representation of the project duration distribution and the early and last times
of the activities. And it calculates several allocation proposals of the delay cost when the project has
been completed and the actual duration of the activities is known.
The paper is organized as follows. First, we recall the basic definitions of project management
and present different ways to distribute the delay cost when durations are assumed to be known and
when they are random variables. Then, we provide a description of ProjectManagement. Finally, we
illustrate the use of the package by way of examples.
Project management
In this section we discuss the basic concepts of deterministic and stochastic projects with a special
focus on allocating the delay cost among the project activities. The aim of this section is to provide a
brief (and quick) survey of the methodologies implemented in the R package ProjectManagement
that we introduce later, as well as to indicate the main bibliographical sources in which interested
readers can deepen their knowledge of each of these methodologies.
Let X be a finite non-empty set and N be a set of ordered pairs ( x1 , x2 ), with x1 , x2 ∈ X and | N | = n.
A directed graph is a pair G = ( X, N ), where X is the set of nodes and N is the set of arcs. We say that
an arc i = xi,1 , xi,2 ∈ N starts at node xi,1 ∈ X and ends at xi,2 ∈ X. A node xs ∈ X is a source node
if there is no arc i ∈ N such that xi,2 = xs . A node xe ∈ X is a sink node if there is no arc i ∈ N such
that xi,1 = xe . A cycle is a set of arcs i0 , i1 , ..., im ∈ N such that xi j ,2 = xi j+1 ,1 , with j ∈ {0, ..., m − 1},
and xim ,2 = xi0 ,1 . To illustrate the concept of directed graph consider the following example. Take
graph G = ( X, N ) given by X = { a, b, c, d} and N = {1 = ( a, b) , 2 = ( a, c) , 3 = (b, d) , 4 = (c, d)}.
The diagram representing this graph is depicted in Figure 1. This graph has one source ( a) and one
sink (d). Arc 3, for instance, starts at node b and ends at node d. This graph has no cycles. However, if
we add an arc 5 = (d, a), the resulting graph has two cycles: 1, 3, 5 and 2, 4, 5.
Figure 1: Diagram of the directed graph G = ( X, N ). The circles represent the nodes and the arrows
represent the arcs. This is the standard way of depicting a graph.
A deterministic project P is a tuple P = G, x0 , where G = ( X, N ) is a directed graph without
cycles, with one source node and one sink node, and x0 ∈ Rn+ is the vector of non-negative planned
durations. In this context, N represents the set of activities in the project. We denote by P N the family
of all deterministic projects with set of activities N, and by P the family of all deterministic projects.
In a deterministic project P = G, x0 ∈ P N , you can calculate the minimum duration of P,
denoted by D G, x0 , i.e. the minimum time the project needs to complete all activities taking into
account the structure of the graph. This time can be obtained as thesolution of a linear programming
problem, and thus, can be easily computed. Alternatively, D G, x0 can be calculated using a project
planning methodology like PERT (see, for instance, Hillier and Lieberman (2001) for details on project
planning).
Given a node x ∈ X, we define the set of immediate predecessors of x as the set of activities ending
in x, Pred ( x ) = {i ∈ N/xi,2 = x }, and the immediate successors of x as Suc ( x ) = {i ∈ N/x = xi,1 }.
We define the earliest time DiE G, x0 of an activity i ∈ N as the minimum time required to complete
all immediate predecessor activities of xi,1 , i.e. the earliest start time the activity i can start taking into
account the graph
DiE G, x0 = max { D jE G, x0 + x0j }.
j∈ Pred( xi,1 )
The R Journal Vol. 12/1, June 2020 ISSN 2073-4859C ONTRIBUTED RESEARCH ARTICLE 421
The latest completion time DiL G, x0 of an activity i ∈ N is the latest point in time when the activity
can end without delaying the project
max j∈ N;Suc( x j,2 )=∅ { D j G, x + x j } i f Suc xi,2 = ∅,
E 0 0
DiL G, x0 =
L 0 0
j∈Suc( xi,2 ) { D j G, x − x j } otherwise.
min
It is easy to see that DiE G, x0 ≤ DiL G, x0 for all i ∈ N. Also, we can calculate the minimum
duration of a project, using the earliest start times, as D G, x0 = maxi∈ N { DiE G, x0 + xi0 }.
We define the slack Si G, x0 of an activity i ∈ N as the maximum time, in addition to xi0 , that i
can use to complete its task without delaying the project
Si G, x0 = DiL G, x0 − DiE G, x0 − xi0 .
If the slack for an activity is equal to 0, then this activity is critical, i.e. any perturbation in its time
modifies the duration of the project. We can also define two other types of slack. The free slack of an
activity is the maximum amount of time that this activity can be delayed without causing a delay in
the project or in the earliest time of the other activities. The free slack of an activity can be calculated as
FSi G, x0 = min { D jE G, x0 } − DiE G, x0 − xi0 .
j∈Suc( xi,2 )
The independent slack of an activity is the maximum time that the activity duration can be
increased without affecting the times of others activities
ISi G, x0 = max{ min { D jE G, x0 } − DiL G, x0 − xi0 , 0}.
j∈Suc( xi,2 )
Given the slack of an activity, we define the latest start time as the latest time that an activity can
start without delaying the project
DiEL G, x0 = DiE G, x0 + Si G, x0
and the earliest completion time as the earliest time in which an activity can end if it starts in its earliest
start time
DiLE G, x0 = DiL G, x0 − Si G, x0 .
Besides the schedule of a project, we can manage the resources allocated to the activities. The
minimal cost expediting or MCE method (Kelley, 1961) considers that the duration of some activities
can be reduced by increasing the resources allocated to them and thus the implementation costs. An
MCE problem is a tuple P, x̄0 , c, D , where P is a deterministic project, x̄0 ∈ Rn+ is the vector of
minimum durations, that is, for each activity i ∈ N, x̄i0 is the minimum duration that the activity can
take if the resources allocated to carry it out are increased, c ∈ Rn is the vector of unit costs, that is, for
each activity i ∈ N, ci is the cost of accelerating a unit of time the duration of i, and D is the minimum
duration of the project we are trying to achieve, with D < D G, x0 . This problem can be solved as a
linear programming problem.
Two other interesting problems that arise from the management of resources are the levelling
and the allocation (Hegazy, 1999). These problems take into account that in order for activities to
be carried out in the estimated time, a certain level of resources must be used. The problem of
levelling of resources is to find a schedule that allows to execute the project in its minimum duration
time D G, x0 whilst the use of resources is as uniform as possible over time. In the problem of
allocation of resources, the level of resources available in each period of time is limited. The aim
is to find the minimum duration time and a schedule for the execution of the project taking into
account this resource constraint. Given the complex nature of these problems, their exact resolution is
computationally demanding. The most common practice is to use heuristic methods to solve them.
Once the project is completed, we can know the actual (observed) duration of the activities and,
therefore, whether there has been a delay in the project, that is, whether the actual duration of the
project has been different than expected. We define a deterministic project with delays as a tuple
CP = G, x0 , x, C , where G, x0 is a deterministic project, x ∈ Rn+ is the vector of actual duration
of the activities, and C : R+ → R is the delay cost function. We assumethat C only depends on the
duration of the project, it is a non-decreasing function, and C D G, x0 = 0. In practice, the most
The R Journal Vol. 12/1, June 2020 ISSN 2073-4859C ONTRIBUTED RESEARCH ARTICLE 422
commonly used functions, for a vector y ∈ Rn+ , are
C ( D ( G, y)) = D ( G, y) − δ (1)
with δ ∈ R+ , for example δ = D G, x0 .
We denote by CP N the family of all deterministic projects with delays with set of activities N, and
by CP the family of all deterministic projects with delays.
In a deterministic project with delays CP ∈ CP N , we may need to allocate C ( D ( G, x )) among the
activities. This can be useful for several reasons. For example, it can serve as an incentive for those
responsible for the activities that have been delayed to be more diligent in similar projects that we may
carry out with them in the future; or it can be a mechanism to distribute among those responsible for
the activities that have been delayed the financial penalty that the project manager has contractually
guaranteed. Brânzei et al. (2002) propose two rules based on bankruptcy problems to address this
problem: the Proportional rule and the Truncated Proportional rule. Although they define these rules
for the case xi ≥ xi0 , we do not consider this restriction. These rules are only defined when the sum of
the individual delays is not zero.
The Proportional rule for deterministic scheduling problems with delays φ is defined, for each
i ∈ N, by
xi − xi0
φi = · C ( D ( G, x )) .
∑ j∈ N x j − x0j
The Truncated Proportional rule for deterministic scheduling problems with delays φ̄ is defined,
for each i ∈ N, by
min{ xi − xi0 , C ( D ( G, x ))}
φ̄i = · C ( D ( G, x )) .
∑ j∈ N min{ x j − x0j , C ( D ( G, x ))}
In Bergantiños et al. (2018), the problem of allocating the delay costs is addressed in the context
of cooperative game theory using a Shapley rule. As we illustrate later in an example, the Shapley
rule allocates the delay costs in a more sensible way than the proportional rules, at least in some cases.
It is much more costly to compute it but, in general, the extra effort is worthwhile. A TU-game is a
pair ( N, v) where N is a finite non-empty set, and v is a map from 2 N to R with v (∅) = 0. We say
that N is the player (activity) set of the game and v is the characteristic function of the game, and
we usually identify ( N, v) with its characteristic function v. The Shapley value, an allocation rule
in cooperative game theory, is a map Φ that associates to each TU-game ( N, v) a vector Φ (v) ∈ R N
satisfying ∑i∈ N Φi (v) = v ( N ) and providing a fair allocation of v ( N ) among the players in N. The
explicit formula of the Shapley value for every TU-game ( N, v) and every i ∈ N is given by
(| N | − |S| − 1)! |S|!
Φi (v) = ∑ | N |!
(v (S ∪ {i }) − v (S)) .
S⊆ N \{i }
Since its introduction by Shapley (1953), the Shapley value has proved to be one of the most
important rules in cooperative game theory and to have applications in many practical problems (see,
for instance, Moretti and Patrone (2008)).
Bergantiños et al. (2018) define the Shapley rule for deterministic projects with delays Sh as
Sh (CP) = Φ vCP , where for all CP = G, x0 , x, C ∈ CP N :
• vCP is the TU-game with set of players N given by
vCP (S) = C D G, xS , x0N \S
for all S ⊆ N, where xS , x0N \S denotes the vector in R N whose i-th component is xi if i ∈ S or
xi0 if i ∈ N \ S, and
• Φ vCP denotes the proposal of the Shapley value for vCP .
The calculation of the Shapley value has, in general, an exponential complexity. In this context, its
exact calculation is impossible in practice, even for a moderate number of activities. As an alternative
to exact calculation, Castro et al. (2009) proposed an estimate of the Shapley value in polynomial time
using a sampling process. In practical terms, this estimate is a reasonable solution.
Next, we introduce a generalization of the model and the rules described above. It follows the
results in Gonçalves-Dosantos et al. (2020a). If instead of xi0 , the planned duration of activity i ∈ N , we
consider the non-negative random variable Xi0 describing the duration of i, we can define a stochastic
project SP as tuple SP = G, X 0 . Unlike in the deterministic setting, the duration of activities, the
The R Journal Vol. 12/1, June 2020 ISSN 2073-4859C ONTRIBUTED RESEARCH ARTICLE 423
duration of the project, as well as the early and last times are now random variables instead of fixed
numbers.
A stochastic project with delays is a tuple SCP = G, X 0 , x, C , where G, X 0 is a stochastic
project, x is the vector of actual durations, and C : R+ → R is the delay cost function. We assume that
C is non-decreasing and C ( D ( G, 0)) = 0, where 0 ∈ Rn is the vector with all components equal to
zero. Proportional rules can be extended to stochastic projects with delays in a straightforward way.
The Stochastic Proportional rule for deterministic scheduling problems with delays φ is defined,
for each i ∈ N, by
xi − E Xi0
φi = · C ( D ( G, x )) .
∑ j∈ N x j − E X 0j
The Stochastic Truncated Proportional rule for deterministic scheduling problems with delays φ̄ is
defined, for each i ∈ N, by
min{ xi − E Xi0 , C ( D ( G, x ))}
φ̄i = · C ( D ( G, x )) .
∑ j∈ N min{ x j − E X 0j , C ( D ( G, x ))}
Also, we can extend the Shapley rule to the stochastic context. Let us see two extensions of the rule.
The Shapley rule for stochastic projects with delays SSh is defined by SSh (SCP) = Φ vSCP , where
• vSCP is the TU-game with set of players N given by
vSCP (S) = E C D G, xS , X 0N \S
for all non-empty S ⊆ N,2 and
• Φ vSCP denotes the proposal of the Shapley value for vSCP .
As an alternative to the previous rule, the Shapley rule in
two steps for stochastic projects with
delays SSh2 is defined by SSh2 (SCP) = Φ v1SCP + Φ v2SCP , where
• v1SCP is the TU-game with set of players N given by
v1SCP (S) = E C D G, xS , X 0N \S − E C D G, X 0
for all S ⊆ N,
• v2SCP is the TU-game with set of players N given by
v2SCP (S) = E C D G, XS0 , 0 N \S
for all S ⊆ N, where 0 ∈ Rn is the vector with all components equal to zero, and
• Φ v1SCP and Φ v2SCP denote the proposal of the Shapley value for v1SCP and v2SCP .
In general, the calculation of vSCP , v1SCP and v2SCP is very complex. In our package, we use
simulations to approximate these characteristic functions.
ProjectManagement package
ProjectManagement is a new R package that allows the user to address different tasks in project
management. The user can obtain the duration of a project and a schedule of activities, and can plot
this schedule for a better understanding of the problem. When the actual durations of each activity
are observed, the package proposes several allocations of the delay cost, if there was any, among the
activities. In the stochastic context, the package estimates the average duration of the project and plots
the density functions of the following random variables: duration of the project, and early and last
times of the activities. As in the deterministic case, it can make an allocation of the delay cost, if any.
The following dependencies of the package must be taken into account: triangle (Carnell, 2019),
plotly (Sievert, 2020), igraph (Csardi and Nepusz, 2006), kappalab (Grabisch et al., 2015), GameThe-
ory (Cano-Berlanga, 2017) and lpSolveAPI (lp_solve et al., 2020). The first one is used for calculations
with triangular distributions, the second one to plot interactive graphics, the third one to plot graphs,
the next two are related to game-theoretic concepts and the last one to solve linear programming
problems.
2 As in all TU-games, we define vSCP (∅) = 0.
The R Journal Vol. 12/1, June 2020 ISSN 2073-4859C ONTRIBUTED RESEARCH ARTICLE 424
The functions incorporated in the package can be seen in Table 1. Note that for projects of more
than 10 activities, functions delay.pert and delay.stochastic.pert will approximate the Shapley
value through a sampling process. Table 2 describes the complete list of parameters used by the
functions. Tables 3, 4, 5, and 6 state which arguments use each function.
Function Description
dag.plot Plots the AON graph of a project.
delay.pert Calculates the delay cost of a deterministic project and
allocates it among the activities.
delay.stochastic.pert Calculates the delay cost of a stochastic project and
allocates it among the activities.
early.time Calculates the earliest start time for each activity.
last.time Calculates the latest completion time for each activity.
levelling.resources Calculates the schedule of the project so that the
consumption of resources is as uniform as possible.
mce Calculates the costs per activity needed to accelerate the project.
organize Relabels the activities of a project (if i precedes j then i ≤ j).
rebuild Builds a type 1 precedence matrix.
resource.allocation Calculates the project schedule so that resource consumption
does not exceed the maximum available per time period.
schedule.pert Calculates the duration of a project and the schedule of each
activity, and plots the schedule and the AON graph.
stochastic.pert Calculates the average duration of a stochastic project,
the criticality index of each activity, and the density functions
of the duration of the project, early times and last times.
Table 1: Summary of functions in ProjectManagement.
ProjectManagement allows the user to plot the activities on nodes graph of the Project (AON).
Originally, in the PERT methodology, projects are represented by activities on arcs graphs (AOA). This
is the representation we have used in this paper up to now. Both AON and AOA representations are
widely used in the literature, each having some advantages over the other in particular circumstances.
For automatically drawing the network of a project, the AON representation is more appropriate
because it is computationally much more efficient. This is why we have incorporated it into the
dag.plot function. This representation will be useful mainly for the user to check that he has entered
the precedence matrices correctly, which are the ones that really characterize the project.
ProjectManagement also allows the user to choose from four different types of immediate prece-
dences between the activities.
• Type 1: Finish to start (FS). If an activity i ∈ N precedes type 1 to j ∈ N, then j cannot start until
activity i has finished.
• Type 2: Start to start (SS). If an activity i ∈ N precedes type 2 to j ∈ N, then j cannot start until
activity i has started.
• Type 3: Finish to finish (FF). If an activity i ∈ N precedes type 3 to j ∈ N, then j cannot finish
until activity i has finished.
• Type 4: Start to finish (SF). If an activity i ∈ N precedes type 4 to j ∈ N, then j cannot finish
until activity i has started.
The relationships between the types of dependencies are as follows: Type 1 implies type 2, type 2
implies type 4, type 1 implies type 3 and finally type 3 implies type 4. Considering these relations, if
one activity precedes another by more than one type, it is only necessary to indicate the one with the
strongest character.
The user can indicate types 1 or 2 in the "prec1and2" parameter (see Table 2) using the values 1 or
2 respectively, and types 3 or 4 in "prec3and4" using 3 or 4 respectively. Note that cycles can not exist.
The R Journal Vol. 12/1, June 2020 ISSN 2073-4859C ONTRIBUTED RESEARCH ARTICLE 425
Parameter Description
duration Vector with the expected duration for each activity.
prec1and2 Matrix indicating precedence type 1 or type 2 between
the activities (Default=matrix(0)).
prec3and4 Matrix indicating precedence type 3 or type 4 between
the activities (Default=matrix(0)).
observed.duration Vector with the actual duration for each activity.
delta Value indicating the maximum time that the project can take
without delay (see equation 1). This value is only used with
the default cost function.
distribution Vector with the distribution function of the duration for each
activity. It can be normal, triangular, exponential, uniform,
beta, t-Student, F distribution, chi-squared, gamma, Weibull,
binomial, Poisson, geometric, hypergeometric, and empirical.
values Matrix with the arguments of the distribution function of
the duration for each activity. By rows the activities,
and by columns the arguments.
percentile Value used to calculate the maximum time allowed for the
duration of the project without delay. This value is only used
if no delta value is assigned.
compilations Number of simulations that the function uses for estimation
(Default=1000).
cost.funtion Delay cost function. If this value is not added, the package uses
equation 1.
early.times Vector with the early time for each activity.
PRINT Logical parameter indicating if the schedule and the AON graph
are depicted (Default=TRUE).
plot.activities.times Vector of selected activities from which it is shown
the distribution of their early and last times (Default=NULL).
minimum.durations Vector with the minimum duration an activity can take even
if the resources are increased.
critical.activities Vector with the critical activities to represent them in a different color
in the AON graph (Default=NULL).
duration.project Value indicating the minimum time sought in the project
(Default=NULL).
activities.costs Vector indicating the cost of accelerating a unit of time
the duration for each activity.
resources Vector indicating the necessary resources for each activity
per period of time.
int Value indicating the duration of each period of time
(Default=1).
max.resources Value indicating the maximum number of resources
that can be used in each period of time.
Table 2: Summary of parameters in ProjectManagement.
The R Journal Vol. 12/1, June 2020 ISSN 2073-4859C ONTRIBUTED RESEARCH ARTICLE 426
Function duration prec1and2 prec3and4 observed.duration delta
dag.plot X X
delay.pert X X X X X
delay.stochastic.pert X X X X
early.time X X X
last.time X X X
levelling.resources X X X
mce X X X
organize X X
resource.allocation X X X
schedule.pert X X X
stochastic.pert X X
Table 3: Arguments used by each function in ProjectManagement.
Function distribution values percentile cost.function compilations
dag.plot
delay.pert X X
delay.stochastic.pert X X X X X
early.time
last.time
levelling.resources
mce
organize
resource.allocation
schedule.pert
stochastic.pert X X X
Table 4: Arguments used by each function in ProjectManagement.
Function early.times PRINT plot.activities.times minimum.durations critical.activities
dag.plot X
delay.pert
delay.stochastic.pert
early.time
last.time X
levelling.resources
mce X
organize
resource.allocation
schedule.pert X
stochastic.pert X
Table 5: Arguments used by each function in ProjectManagement.
The R Journal Vol. 12/1, June 2020 ISSN 2073-4859C ONTRIBUTED RESEARCH ARTICLE 427
Function duration.project activities.costs resources int max.resources
dag.plot
delay.pert
delay.stochastic.pert
early.time
last.time
levelling.resources X X
mce X X
organize
resource.allocation X X X
schedule.pert
stochastic.pert
Table 6: Arguments used by each function in ProjectManagement.
Examples
ProjectManagement is available for download from CRAN. To use the package you will need to load
it at the beginning of the session, usually by typing
> library("ProjectManagement")
Next we analyse the following deterministic project with 10 activities. Their durations and
precedence relations are given in Table 7.
N 1 2 3 4 5 6 7 8 9 10
Immediate precedence type 1 - - - 2 3 3 1, 4 2 5, 8 6
Immediate precedence type 2 - - - - 4 - - - - -
Immediate precedence type 3 - - - - - 8 - - - -
Immediate precedence type 4 - - - - - - 9 - - -
Durations 2 1.5 1 4.5 2 2.5 3 4 2 5
Table 7: Example of a deterministic project.
We start by introducing the data set characterizing the project. We use the function dag.plot for
depicting its AON graph. Figure 2 shows it; the green blocks contain the activities and the precedences
are represented by arrows. The blocks S and E are the source and sink nodes, respectively. Note that
the precedences type 1 are arrows without label, precedences type 2 are labeled as SS, precedences
type 3 as FF, and precedences type 4 as SF.
> prec1and2 prec1and2[1,7]C ONTRIBUTED RESEARCH ARTICLE 428
Figure 2: AON graph of the project. In an AON graph the activities are embodied in the nodes
(squares) and the precedences of the various types, FS, SS, FF, SF, in the arcs (arrows).
[[2]]
Activities Duration Earliest start time Latest start time Earliest completion time
1 2.0 0.0 5.5 2.0
2 1.5 0.0 0.0 1.5
3 1.0 0.0 2.0 1.0
4 1.5 1.5 6.0 3.0
5 2.0 1.5 6.5 3.5
6 2.5 2.0 3.0 5.5
7 3.0 3.0 7.5 6.0
8 4.0 1.5 1.5 5.5
9 2.0 5.5 8.5 7.5
10 5.0 5.5 5.5 10.5
Activities Latest completion time Slack Free Slack Independent Slack
1 7.5 5.5 1.0 0.0
2 1.5 0.0 0.0 0.0
3 3.0 2.0 0.0 0.0
4 7.5 4.5 0.0 0.0
5 8.5 5.0 2.0 0.0
6 5.5 2.0 2.0 0.0
7 10.5 4.5 4.5 0.0
8 5.5 0.0 0.0 0.0
9 10.5 3.0 3.0 0.0
10 10.5 0.0 0.0 0.0
[[3]]
In this output we can see the total duration (10.5 units) of the project as well as other relevant
information for each activity. Figure 3 depicts the different times of each activity using a colour coding.
If we click on the points on the graph, a label indicates which activity and time it belongs to. Also, if
we double click on a section of the legend we can see the data related to it, as in Figure 4 with the last
times for each activity (another double click restarts the graph). In the output, the plot depicted in
Figure 3 is saved as an object on [[3]]; this allows the users to manipulate the plot according to their
needs. Finally, Figure 5 shows the AON graph of the project where critical activities are represented in
red.
The R Journal Vol. 12/1, June 2020 ISSN 2073-4859C ONTRIBUTED RESEARCH ARTICLE 429
Figure 3: This figure shows an interactive graphic that displays the schedule of the project. If we move
the mouse over the highlighted points of the segments, pop-up tags are generated with information
about the activities.
Figure 4: Latest completion times. This interactive graphic is the result of double clicking on the
"Latest completion date" section of the legend.
The R Journal Vol. 12/1, June 2020 ISSN 2073-4859C ONTRIBUTED RESEARCH ARTICLE 430
Figure 5: AON graph of the project. In an AON graph the activities are embodied in the nodes
(squares) and the precedences of the various types, FS, SS, FF, SF, in the arcs (arrows). Nodes in red
indicate critical activities.
Next, suppose we are interested in shortening the duration of the project. The mce function is used
for this purpose. Let us use the function with the following input data: the minimum duration for
each activity even if the resources are increased
x̄0 = (1, 1, 0.5, 1, 1, 2, 2, 3, 1, 3)
and the costs per unit time to shorten each activity
c = (1, 2, 1, 1, 3, 2, 1, 2, 3, 5) .
> minimum.durations activities.costs mce(duration,minimum.durations,prec1and2,prec3and4,
activities.costs,duration.project=NULL)
necessary negative increase
1: 0.5
Read 1 item
Project duration =
[1] 10.0 9.5 9.0 8.5 8.0 7.5 7.0
Estimated durations = Costs per solution =
2.0 2.0 2.0 2.0 2.0 2.0 2.0 0.0 0.0 0.0 0.0 0.0 0.0 0.0
1.5 1.5 1.0 1.0 1.0 1.0 1.0 0.0 0.0 1.0 1.0 1.0 1.0 1.0
1.0 1.0 1.0 1.0 1.0 1.0 1.0 0.0 0.0 0.0 0.0 0.0 0.0 0.0
1.5 1.5 1.5 1.5 1.5 1.5 1.5 0.0 0.0 0.0 0.0 0.0 0.0 0.0
2.0 2.0 2.0 2.0 2.0 2.0 2.0 0.0 0.0 0.0 0.0 0.0 0.0 0.0
2.5 2.5 2.5 2.5 2.5 2.5 2.5 0.0 0.0 0.0 0.0 0.0 0.0 0.0
3.0 3.0 3.0 3.0 3.0 3.0 3.0 0.0 0.0 0.0 0.0 0.0 0.0 0.0
3.5 3.0 3.0 3.0 3.0 3.0 3.0 1.0 2.0 2.0 2.0 2.0 2.0 2.0
2.0 2.0 2.0 2.0 2.0 2.0 2.0 0.0 0.0 0.0 0.0 0.0 0.0 0.0
5.0 5.0 5.0 4.5 4.0 3.5 3.0 0.0 0.0 0.0 2.5 5.0 7.5 10
The parameter duration.project=NULL means that we do not indicate a minimum duration of
the project, so the function asks us for a decrease of the duration of the project to obtain all possible
solutions. We have considered it convenient a decrease of 0.5 units of time. Therefore, we have
obtained that the project can reduce its minimum duration to 10, 9.5, 9, 8.5, 8, 7.5 and 7. For each
possible duration of the project, we have the durations of each activity (duration per column and
activity per row), as well as the cost needed to reduce their times to these durations.
The R Journal Vol. 12/1, June 2020 ISSN 2073-4859C ONTRIBUTED RESEARCH ARTICLE 431
Suppose now that to complete the project each activity needs the amount of resources
(6, 6, 6, 3, 4, 2, 1, 2, 3, 1) ,
and we are interested in obtaining a new schedule with a uniform consumption of resources over time.
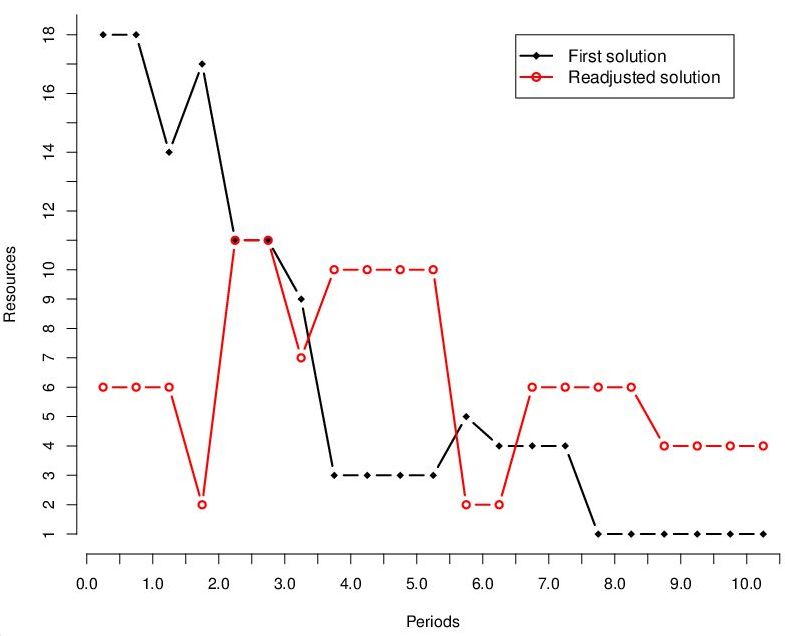
To do this we use the function levelling.resources in such a way
> resources levelling.resources(duration,prec1and2,prec3and4,resources,int=0.5)
Earliest start times =
[1] 3.5 0.0 2.0 2.0 6.5 3.0 5.5 1.5 8.5 5.5
Resources by period=
[1] 6 6 6 2 11 11 7 10 10 10 10 2 2 6 6 6 6 4 4 4 4
Figure 6: This graphic shows the resource consumption according to the initial scheduling (in black)
and according to the scheduling after leveling (in red). The x-axis represents time and the y-axis
represents resource consumption.
As we can see, the function returns the new earliest start times of the activities and the resources
consumed in each period with the new schedule, where time periods start at 0 and end at 10.5 with an
increase of 0.5 time units. Figure 6 represents the resources required in each period of time, before and
after the readjustment.
To conclude with the analysis of resources, consider that the maximum amount of resources
available in each period is 10. We use the resource.allocation function in this situation.
> max.resources resource.allocation(duration,prec1and2,prec3and4,resources,
max.resources,int=0.5)
Project duration =
[1] 11
Earliest start times =
[1] 6.0 0.0 1.5 2.5 4.0 2.5 8.0 1.5 6.0 5.5
Resources by period =
[1] 6 6 6 8 8 7 7 7 8 8 6 5 10 10 10 10 2 2 2 2 2 1
The R Journal Vol. 12/1, June 2020 ISSN 2073-4859C ONTRIBUTED RESEARCH ARTICLE 432
With the new restriction, the minimum duration of the project becomes 11 instead of 10. The output
includes the new earliest start times for each activity and the consumption of resources by period
(note that the last period is now 11).
Continuing the example, we now analyse the allocation of delays. The function delay.pert shows
if there has been a delay in the project and, in that case, allocates it among the activities. Let us see it
using the delay cost function
0 if D ( G, y) ≤ 10.5,
C ( D ( G, y)) =
D ( G, y) − 10.5 otherwise,
and the (observed) actual durations
x = (2.5, 1.5, 2, 2, 2, 6, 4, 6, 3, 5.5) .
> observed.duration cost.function delay.pert(duration,prec1and2,prec3and4,observed.duration,
delta=NULL,cost.function)
There has been a delay of = 3
1 2 3 4 5
The proportional payment 0.15000 0.00000 0.30000 0.15000 0.00000
The truncated proportional payment 0.15789 0.00000 0.31579 0.15789 0.00000
Shapley rule 0.00000 0.00000 0.33333 0.00000 0.00000
6 7 8 9 10
The proportional payment 1.05000 0.30000 0.60000 0.30000 0.15000
The truncated proportional payment 0.94737 0.31579 0.63158 0.31579 0.15789
Shapley rule 1.08333 0.00000 1.08333 0.00000 0.50000
The output shows that there is a delay in the project of 3 units. As there is a delay, we proceed to
make the allocation using three rules: proportional, truncated proportional and Shapley. We can see
the differences between the three rules, especially in activities 1, 4, 7 and 9. While the proportional and
truncated proportional rules assign a positive payment, the Shapley rule does not assign costs to these
activities. This is due to the fact that, although they fall behind the planned duration, they do not
affect the overall delay of the project. Note that if the project has more than ten activities, delay.pert
does not calculate the Shapley rule; instead, it asks the user if he wants to calculate an estimate of its
value.
Let us now assume that we are in a stochastic context, with additional information on planned
durations being random variables. Using the function stochastic.pert with the following random
variables to describe the duration of the activities
X 0 = (t (1, 2, 3) , exp (2/3) , t (1/2, 5/4, 5/4) , t (1/4, 7/4, 5/2) , t (1, 2, 3) ,
t (1, 3/2, 5) , t (1, 1, 7) , t (3, 4, 5) , t (1/2, 5/2, 3) , t (1, 6, 8)) ,
where t ( a, b, c) denotes the triangular distribution with parameters a, b, and c, and exp (α) denotes
the exponential distribution with parameter α, we can obtain relevant information about the project.
Note that with the argument plot.activities.times=c(7,8) we indicate the activities for which we
want to estimate the densities of their earliest and latest start and completion times; in this example
we have requested only such densities for activities 7 and 8.
> values distribution stochastic.pert(prec1and2,prec3and4,distribution,values,percentile=0.95,
plot.activities.times=c(7,8))
Average duration of the project = 10.64242
Percentile duration of the project = 14.21999
The R Journal Vol. 12/1, June 2020 ISSN 2073-4859C ONTRIBUTED RESEARCH ARTICLE 433
1 2 3 4 5 6 7 8 9 10
Criticality index by activity 0.6 88 11.4 2 0.1 11.3 2.6 86 4 93.4
In the output we can see the average duration of the project and the percentile duration of the
project. The percentile duration of the project shows the value of such that the probability that the
duration of the project is smaller than d equals the variable percentile introduced by the user (see Table
2); in this case percentile=0.95. In addition, we obtain the criticality index by activity, that is, the
proportion of times that an activity is critical. An activity is critical when it has zero slack. Figure 7
plots estimations of the density function of the project duration, the earliest start time and the latest
completion time of activities 7 and 8.
Figure 7: Density estimation of project duration time and earliest start and latest completion times for activities 7
and 8.
We proceed now to the allocation of the delay cost in the stochastic model using the function
delay.stochastic.pert. To be able to compare the results, we will use the same delay cost function
as in the deterministic case. As expected, there are noticeable differences in the allocations between
the two models, as the stochastic model makes use of more complex information.
> delay.stochastic.pert(prec1and2,prec3and4,distribution,values,
observed.duration,percentile=NULL,delta=NULL,cost.function)
Total delay of the stochastic project = 3
The R Journal Vol. 12/1, June 2020 ISSN 2073-4859C ONTRIBUTED RESEARCH ARTICLE 434
1 2 3 4 5
Stochastic Shapley rule 0.07238 -0.07569 0.56946 0.07440 0.07238
Stochastic Shapley rule 2 0.00693 0.03470 0.51967 0.01363 0.00731
The proportional payment 0.15000 0.00000 0.30000 0.15000 0.00000
The truncated proportional payment 0.15789 0.00000 0.31579 0.15789 0.00000
6 7 8 9 10
Stochastic Shapley rule 1.66514 0.08271 0.11897 0.07256 0.34769
Stochastic Shapley rule 2 1.62101 0.02287 0.25006 0.01046 0.51336
The proportional payment 1.05000 0.30000 0.60000 0.30000 0.15000
The truncated proportional payment 0.94737 0.31579 0.63158 0.31579 0.15789
Finally, to illustrate the runtime of previously used functions, Table 8 shows the time (in seconds)
needed to compute several problems. We have selected a variety of projects with 2, 4, 6, 8 and 10
activities, and we have run the different routines on a computer with Intel Core i5 − 7200U and 12 GB
of RAM.
Activities 2 4 6 8 10
delay.pert 0.00 0.00 0.00 0.03 0.11
delay.stochastic.pert 0.06 0.44 1.68 6.23 30.58
early.time 0.00 0.00 0.00 0.00 0.00
last.time 0.00 0.00 0.00 0.00 0.00
levelling.resources 0.00 0.00 0.00 0.02 0.03
mce 0.00 0.00 0.00 0.00 0.02
organize 0.00 0.00 0.00 0.00 0.00
resources.allocation 0.00 0.00 0.00 0.01 0.02
schedule.pert 0.08 0.11 0.13 0.11 0.12
stochastic.pert 0.02 0.03 0.05 0.04 0.04
Table 8: Runtime in seconds of ProjectManagemet functions.
Acknowledgements
This work has been supported by the MINECO grant MTM2017-87197-C3-1-P and by the Xunta de
Galicia through the ERDF (Grupos de Referencia Competitiva ED431C-2016-015 and Centro Singular
de Investigación de Galicia ED431G/01). The comments of an anonymous reviewer have helped us to
improve this paper significantly.
Bibliography
G. Bergantiños, A. Valencia-Toledo, and J. Vidal-Puga. Hart and mas-colell consistency in pert problems.
Discrete Applied Mathematics, 243:11–20, 2018. URL https://doi.org/10.1016/j.dam.2017.08.012.
[p419, 422]
R. Brânzei, G. Ferrari, V. Fragnelli, and S. Tijs. Two approaches to the problem of sharing delay costs in
joint projects. Annals of Operations Research, 109(1):359–374, 2002. URL https://doi.org/10.1023/A:
1016372707256. [p419, 422]
S. Cano-Berlanga. GameTheory: Cooperative Game Theory, 2017. URL https://CRAN.R-project.org/
package=GameTheory. R package version 2.7. [p423]
R. Carnell. triangle: Provides the Standard Distribution Functions for the Triangle Distribution, 2019. URL
https://CRAN.R-project.org/package=triangle. R package version 0.12. [p423]
J. Castro, D. Gómez, and J. Tejada. A project game for pert networks. Operations Research Letters, 35(6):
791–798, 2007. URL https://doi.org/10.1016/j.orl.2007.01.003. [p419]
The R Journal Vol. 12/1, June 2020 ISSN 2073-4859C ONTRIBUTED RESEARCH ARTICLE 435
J. Castro, D. Gómez, and J. Tejada. Polynomial calculation of the shapley value based on sampling.
Computers and Operations Research, 36(5):1726–1730, 2009. URL https://doi.org/10.1016/j.cor.
2008.04.004. [p422]
G. Csardi and T. Nepusz. The igraph software package for complex network research. InterJournal,
Complex Systems:1695, 2006. URL http://igraph.org. [p423]
I. V. Evdokimov, R. Y. Tsarev, T. N. Yamskikh, and A. N. Pupkov. Using pert and gantt charts for
planning software projects on the basis of distributed digital ecosystems. In Journal of Physics:
Conference Series, volume 1074, page 012127. IOP Publishing, 2018. URL https://doi.org/10.1088/
1742-6596/1074/1/012127. [p419]
J. C. Gonçalves-Dosantos, I. García-Jurado, and J. Costa. Sharing delay costs in stochastic scheduling
problems with delays. 4OR - A Quarterly Journal of Operations Research, 2020a. URL https://doi.
org/10.1007/s10288-019-00427-9. [p422]
J. C. Gonçalves-Dosantos, I. García-Jurado, and J. Costa. ProjectManagement: Management of Determinis-
tic and Stochastic Projects, 2020b. URL https://CRAN.R-project.org/package=ProjectManagement.
R package version 1.3.3. [p419]
M. Grabisch, I. Kojadinovic, and P. Meyer. kappalab: Non-Additive Measure and Integral Manipulation
Functions, 2015. URL https://CRAN.R-project.org/package=kappalab. R package version 0.4-7.
[p423]
G. Gregoriou, K. Kirytopoulos, and C. Kiriklidis. Project management educational software (promes).
Computer Applications in Engineering Education, 21(1):46–59, 2013. URL https://doi.org/10.1002/
cae.20450. [p419]
N. G. Hall. Project management: Recent developments and research opportunities. Journal of Systems
Science and Systems Engineering, 21(2):129–143, 2012. URL https://doi.org/10.1007/s11518-012-
5190-5. [p419]
T. Hegazy. Optimization of resource allocation and leveling using genetic algorithms. Journal of
construction engineering and management, 125(3):167–175, 1999. URL https://doi.org/10.1061/
(ASCE)0733-9364(1999)125:3(167). [p421]
F. S. Hillier and G. J. Lieberman. Introduction to Operations Research. McGraw-Hill, 2001. ISBN
0072321695. [p419, 420]
D. Kelley. plan: Tools for Project Planning, 2018. URL https://CRAN.R-project.org/package=plan. R
package version 0.4-3. [p419]
J. E. Kelley. Critical-path planning and scheduling: Mathematical basis. Operations Research, 9(3):
296–320, 1961. URL https://doi.org/10.1287/opre.9.3.296. [p421]
lp_solve, K. Konis, and F. Schwendinger. lpSolveAPI: R Interface to lp_solve Version 5.5.2.0, 2020. URL
https://CRAN.R-project.org/package=lpSolveAPI. R package version 5.5.2.0-17.7. [p423]
S. Moretti and F. Patrone. Transversality of the shapley value. Top, 16(1):1–41, 2008. URL https:
//doi.org/10.1007/s11750-008-0044-5. [p422]
J. C. Muñoz. PlotPrjNetworks: Useful Networking Tools for Project Management, 2015. URL https:
//CRAN.R-project.org/package=PlotPrjNetworks. R package version 1.0.0. [p419]
L. Özdamar and G. Ulusoy. A survey on the resource-constrained project scheduling problem. IIE
transactions, 27(5):574–586, 1995. URL https://doi.org/10.1080/07408179508936773. [p419]
L. Salas-Morera, A. Arauzo-Azofra, L. García-Hernández, J. M. Palomo-Romero, and H.-M. César.
Ppcproject: An educational tool for software project management. Computers and Education, 69:
181–188, 2013. URL https://doi.org/10.1016/j.compedu.2013.07.018. [p419]
K. Schmitz, R. Mahapatra, and S. Nerur. User engagement in the era of hybrid agile methodology.
IEEE Software, 36(4):32–40, 2019. URL https://doi.org/10.1109/MS.2018.290100623. [p419]
L. S. Shapley. A value for n-person games. Contributions to the Theory of Games, 2(28):307–317, 1953.
URL https://doi.org/10.1016/j.compedu.2013.07.018. [p422]
C. Sievert. Interactive Web-Based Data Visualization with R, plotly, and shiny. Chapman and Hall/CRC,
2020. ISBN 9781138331457. URL https://plotly-r.com. [p423]
The R Journal Vol. 12/1, June 2020 ISSN 2073-4859C ONTRIBUTED RESEARCH ARTICLE 436
Juan Carlos Gonçalves-Dosantos
Grupo MODES, CITIC and Departamento de Matemáticas, Universidade da Coruña
Campus de Elviña, 15071 A Coruña
Spain
ORCID: 0000-0003-1578-8411
juan.carlos.goncalves@udc.es
Ignacio García-Jurado
Grupo MODES, CITIC and Departamento de Matemáticas, Universidade da Coruña
Campus de Elviña, 15071 A Coruña
Spain
ORCID: 0000-0002-6681-1629
ignacio.garcia.jurado@udc.es
Julian Costa
Grupo MODES, Departamento de Matemáticas, Universidade da Coruña
Campus de Elviña, 15071 A Coruña
Spain
ORCID: 0000-0001-9760-9581
julian.costa@udc.es
The R Journal Vol. 12/1, June 2020 ISSN 2073-4859You can also read