The members of this study
←
→
Page content transcription
If your browser does not render page correctly, please read the page content below
FY2010 CDM/JI Feasibility Study (FS) Report (Summary)

FS Project Title
   The pineapple waste to energy project in Mindanao Island, Philippines

Implementer
   Eight-Japan Engineering Consultants Inc.

1. The members of this study
      In Japan
      - Eight-Japan Engineering Consultants Inc.           Main member
      - EJ Business Partners Co., Ltd.                     Study support
      In the Philippines
      - Del Monte Philippines Inc.                         Local partner

2. Outline of the project
  (1) About the project
       This Feasibility Study aims to evaluate the feasibility and economic profitability of power
    generation using pineapple waste instead of the existing fossil fuel. Del Monte Philippines Inc.,
    hereafter called as (“DMPI”) in Mindanao, Philippines annually produces approximately 600,000t of
    pineapple and other fruits. The pineapple and other fruits are delivered to their own cannery in
    Cagayan de Oro City where it is processed into canned and juice products. From the processing line,
    12,000 m3/day of wastewater with high organic content are continuously generated during the cannery
    operation. Also, approximately 270t/day of solid pineapple fruit waste, hereafter called as (“pineapple
    pulp”), approx. 50t/day solid waste of papaya and other fruits, hereafter called (“other fruit pulps”) are
    produced. Approximately 50t/day of the pineapple pulp is used as cattle feed for their own farm within
    the plantation and the remaining pineapple pulp and other fruit pulps ,hereafter called as (“pulps”), are
    mixed into the soil in the plantation. The wastewater is treated by an existing wastewater treatment
    facility utilizing the aerobic treatment process in the cannery. Its wastewater treatment facility is in
    overload condition.
       Conceptual diagram of the project is shown in Fig. 1.
       In this project, the methane is captured from the anaerobic fermentation of pineapple pulp
    (220t/day) , other fruit pulps (50t/day) and wastewater (11,000m3/day). Previously, no recycling or
    alternative use of wastewater was done. In addition, the methane generation from an aerobic
    wastewater treatment facility is avoided by improvement of overloaded condition. This project will
    capture the methane which will be fed into gas generators to produce electricity.
       The baseline scenario is, “the power consumption from the public grid which is substituted by
    power generation from this project" and "methane generation from an aerobic wastewater treatment
    facility in overload condition". Since pineapple pulp is now being used as soil mixing fertilizer in the
    DMPI’s plantation, methane avoidance does not apply in the project scenario.
       Power generation capacity is projected at ten (10) MW (6 MW using wastewater; 4 MW using
    fruit pulps). In using methane gas to power the electric generator for the supply of power to DMPI and

                                              Summary -1-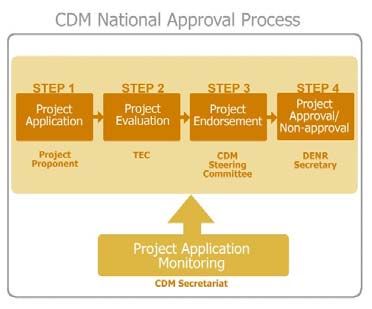
FY2010 CDM/JI Feasibility Study (FS) Report (Summary)

      the local grid, the amount of fossil fuel utilization in the grid will be reduced as well as the amount of
      greenhouse gas (GHG) emission. It is estimated that GHG emission will be reduced on the average of
      106,654t CO2/year over a period of 10 years (2013-2022) throughout the implementation of the
      project.
            This project was conceived to improve the global environment using collected methane as a clean
      energy source and therefore contribute to the sustainable development of the project area yielding both
      environmental and economic benefits.

                                                                                                                             Shipping

      Plantation                          Pineapple fruits                          Cannery                                     Canned processed
                                                                                                                                   goods etc

                                                    Biomass to be used for the
 Soil mixing fertilizer                             project

                              Feed for cattle

                                                                                                                                                   Discharging
                                                                                                                                                   into sea

                                                              Pineapple pulp                  Wastewater                Aerobic wastewater
                                                                                                                         treatment facility

                                                             Other fruit pulps

                                                         DMPI and Public grid                                   DMPI and Public grid

                     Project boundary

                          Biomass power generation plant                         Biomass power generation plant
                          in Plantation                          Power           in Cannery                             Power
                                                                  4MW                                                    6MW
                                           Heat                                                   Heat

                                           Biogas                                                 Biogas

                          Methane fermentation      Gas utilization                Methane fermentation    Gas utilization
                                facility             equipment                           facility           equipment

                                                                                                 (Wastewater after methane
                                            (Residue after methane fermentation)                  fermentation)

                                                Fig. 1 Conceptual diagram of the project

  (2) About application of baseline methodology
           AMS-I.D.; Grid connected renewable electricity generation
           AMS-III.H.; Methane recovery in wastewater treatment

3. The methods of this study
  (1) The subject of this study
      1) The conditions of approval of the Clean Development Mechanism (CDM) of the
            host country (the Philippines)

                                                                         Summary -2-
FY2010 CDM/JI Feasibility Study (FS) Report (Summary)
- Organization of the CDM approval in the Philippine government
- The conditions for approval (days required for approval, similar projects, etc.)
2) The current state of pulps and wastewater generation
- The present condition of the pineapple plantation and the cannery.
- The canning process of fruits
- Pineapple pulp generation
- Amount of other pulps
- Amount of wastewater
- Power supply used in the cannery and in the plantation
3) The current state of treatment and disposal of pulps and wastewater
- The state of treatment and disposal of pulps
- The condition of treatment and disposal of wastewater
4) Analysis of the biomass power generation system
- Determination of practicality of the use of biomass
- The conceptual design of the power generation system
5) Application of baseline methodology
- Selection of the methodology
- Definition of the project boundary
- Identification of the baseline scenario
- Calculation of the greenhouse gas emission reduction
- Monitoring methodology and the monitoring plan
6) Evaluation of the environmental impact of the project
- Study the system of environment impact assessment in the Philippines
- Study the environmental impact during project implementation
- Other indirect influences
7) Analysis of the project’s business potential
- Estimated cost of construction of the plant
- Estimated expenses for the operation and maintenance of the plant
- Estimated income of the project
- Determination of the benchmark for evaluation of the business potential
- Demonstration of additionality
- Financing plan
8) Project promotion discussion
- Project implementation structure
- Duration of the project activity/crediting period
- Project implementation schedule
9) Investigation about the co-benefit
- The items for evaluation
- The baseline scenario and the project scenario
- The evaluation method and monitoring plan of the baseline
Summary -3-FY2010 CDM/JI Feasibility Study (FS) Report (Summary)
- Trial calculation before project implementation (quantification)
(2) The contents of the study
1) CDM Project Policy in the Philippines
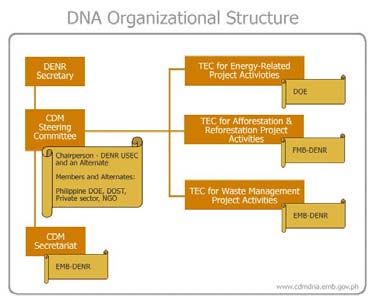
(a) Organization of the CDM approval in the Philippines government
The Philippines signed the Kyoto Protocol on April 15, 1998, and was ratified in November,
2003. By virtue of Executive Order No.320, Series of 2004, the Department of Environment and
Natural Resources (DENR) has been designated as the National Authority (DNA: Designated
National Authority) for CDM in Philippines. Information from DENR and scanning through
DENR’s website, the period required for approval of the CDM project in the Philippines,
organization and procedure of CDM approval were investigated (Fig. 2 and 3).
Fig. 2 DNA organizational structure Fig. 3 CDM national approval process
in the Philippines (*) in the Philippines (*)
(*)From website of Clean Development Mechanism - Philippines
(b) The conditions for approval (days required for approval, similar projects, etc.)
According to the latest project list approved by the Philippine government as disclosed by the
DENR, the letters of approval from the host country were published for 89 projects, 42 of these
projects have obtained approval from the CDM executive board (as of end of December, 2010).
About 80 percent of these projects are classified into waste management.
There is no similar project using pineapple waste as biomass for power generation that has
been registered yet. The use pineapple for one is an additional attraction of the project since
pineapple is one of the major fruit products of the Philippines. The innovation introduced by this
project would hopefully find approval from the DENR.
2) The current state of pulps and wastewater generation
(a) The present condition of the pineapple plantation and the cannery
The project sites are in DMPI’s plantation in Bukidnon province which is near Cagayan de
Oro City, and the cannery in Bugo, Cagayan de Oro City. The pineapple harvested in the
plantation at Bukidnon province is transported to the cannery in Cagayan de Oro City about 40
km away from the plantation.
Summary -4-FY2010 CDM/JI Feasibility Study (FS) Report (Summary)
(b) Pineapple pulp generation
The average amount of pineapple pulp generated from pineapple processing in the cannery is
around 270t/day.
(c) Other fruit pulps generation
In the cannery, papaya and other fruits are also processed in addition to pineapple where
pulps are also generated. The amount of the other fruit pulp produced is about 50t/day.
(d) Wastewater generation
The cannery also generates wastewater from pineapple and other fruits pocessing in the
cannery. The amount of wastewater generated from the cannery is around 11,000m3/day.
(e) BOD of wastewater
DMPI is monitoring regularly Biochemical Oxygen Demand (BOD) which is an index of
contamination for water quality. The average BOD value of wastewater for every year generated
in the cannery is around 8,000mg/L.
(f) Use of power supply in the cannery and in the plantation
Annual power consumption is about 1.5 MW/year in the plantation, and 7-7.5 MW/year in the
cannery which are all purchased from the local public grid.
3) The state of treatment and disposal of pulps and wastewater
(a) The state of treatment and disposal of pulps
The fruit pulps generated from the cannery are hauled back to the plantation. About 50t/day
of the pineapple pulps is used as cattle feed for their own farm within the plantation and the
remaining pulps are mixed into the soil at the plantation. Since the pulps have high moisture
content and their balance of nitrogen, phosphorus and potassium is not ideal, they are not good as
compost materials.
(b) The state of treatment and disposal of wastewater
The wastewater and other factory effluents are processed at the wastewater treatment facility
in the cannery and are discharged into the sea. Inflow amount and inflow BOD of wastewater
have exceeded the design values, and it is in an overload condition.
Design specification
- Design inflow amount of wastewater : 8,175 m3/day
- Design inflow of wastewater : BOD = 3,000 mg/L
4) The study of the power generation system
Pulps and wastewater are the principal biomass materials and that methane fermentation and
their collection from the biomass will be investigated in this study.
(a) Determination of the use of biomass.
After discussion with DMPI, the kind and amount of the biomass which will be used in the
project are summarized in Table 1.
Summary -5-FY2010 CDM/JI Feasibility Study (FS) Report (Summary)
Table 1 Kind and amount of biomass to be used for the project
Kind of biomass to be used Amount to be used
Pineapple pulp 220 t/day
Other fruit pulps 50t/day
Wastewater 11,000 m3/day
(b) The conceptual design of the power generation system
Methane is collected from the fermentation of pulps and wastewater produced. The biogas
will be used as fuel to produce electric power. Since the pulps and wastewater will have different
characteristics, different methane fermentation systems will be adopted. Electric power
generation from biomass that will use wastewater from the cannery and pulps from the plantation
is recommended.
Power generation by using pulps
The power generating facility using biomass (pulps) will be built at the plantation instead of the
cannery. Since pulps are solids, the dry methane fermentation method will be adopted. The outline
of the power generation system is shown below.
i) Fermentation method
Dry methane fermentation method
ii) System components
The system consists of a receiving and pre-treatment facility, methane fermentation facility,
gas utilization equipment (power generation, heat) and residue treatment equipment. The power
generated from this system is projected to be 4 MW.
iii) Simplified process flow
The biogas power generation concept of the system is shown in Fig. 4.
- The pulps will be transported from the cannery to the plantation and delivered to the facility.
- After pre-treating (crushing, mixing, moisture adjustment), the pulps will be added to the
methane fermentation digester.
- Methane fermentation will result from the activity of methanogenic bacteria in the methane
fermentation digester.
- Electric power and heat are produced from the biogas containing methane through the use of
power generation and heat equipment through the pretreatment of dehumidification,
desulfurization, etc.
- The generated electricity will supply the requirements of DMPI’s plantation and the excess
generated power will be sold to the local public grid. The heat from the generation of
electric power will be recycled for use in warming the methane fermentation equipment,
among others.
- The residue, after methane fermentation, is dried and mixed into soil of the plantation.
Summary -6-FY2010 CDM/JI Feasibility Study (FS) Report (Summary)
Pineapple pulp Other fruit pulps
Biomass power generation system
Feed for Receiving and pre-
cattle treatment facility
Biogas
Methane
fermentation facility
Residue Heat
after
methane
fermentation
Residue treatment Gas utilization equipment
equipment (Power generation, heat)
Soil mixing fertilizer
【Project site : in Plantetion】
Fig. 4 Biomass power generation system using pulps
Power generation by using wastewater
Wastewater from the cannery operations will be utilized for power generation through the
production of methane and used as an alternative fuel to run a generator that will produce electricity.
The wastewater after fermentation will be treated at the aerobic wastewater treatment facility. The
quality of the water at the treatment plant improves and eventually addresses the issue of overload
condition of the treatment plant.
i) Fermentation method)
Wet methane fermentation method
ii) System components
The system consists of a receiving facility, methane fermentation facility and gas utilization
equipment (power generation, heat). About 6 MW of power is projected to be generated by this
system.
iii) Simplified process flow
The processes involved in the system are shown in Fig. 5.
- The wastewater that passes through a screen in the aerobic wastewater treatment facility will
be collected and added into the methane fermentation digester.
- Methane fermentation occurs through the activity of methanogenic bacteria in the methane
Summary -7-FY2010 CDM/JI Feasibility Study (FS) Report (Summary)
fermentation digester.
- Electric power and heat are produced from the biogas containing methane through the use of
power generation and heat equipment through the pretreatment of dehumidification,
desulfurization, etc.
- The generated electricity will supply the requirements of DMPI and the excess generated
power will be sold to the local public grid. The heat from the generation of electric power
will be recycled for use in warming the methane fermentation equipment, among others.
- The wastewater after methane fermentation is again processed at the aerobic wastewater
treatment facility and is discharged into the sea.
- Any residue, after methane fermentation, of the wastewater collected at the treatment facility
is dried and mixed into the soil of the plantation.
Waste water
Aerobic treatment facility Biomass power generation plant
Screen Receiving facility
×
Wastewater after methane
fermentation Biogas
Collection tank Methane
fermentation facility
Residue
Aerobic treatment after Heat
methane
fermentation
Residue treatment Gas utilization equipment
equipment (Power generation, heat)
Discharging into sea
Soil mixing fertilizer
【Project site : in Cannery】
Fig. 5 Biomass power generation system using wastewater
In this project, the overload condition of the wastewater treatment facility will be improved
through the methane fermentation of the wastewater.
4. Result of the study towards CDM project implementation
(1) Definition of the project boundary and identification of baseline
1) Application of baseline methodology
In this project, electric power from the public grid will be substituted by the generated power
from alternative sources that involve treatment of pulps and wastewater. The AMS-I.D. (Grid
connected renewable electricity generation) and the AMS-III.H. (Methane recovery in wastewater
treatment) served as guides in quantifying the benefit of the project as shown in the calculations in
the succeeding sections.
Summary -8-FY2010 CDM/JI Feasibility Study (FS) Report (Summary)
2) Project boundary (SCOPE OF THE PROJECT)
The scope of this project will only involve that part shown in Fig. 1 where a “biomass power
generation plant will be built.”
3) Baseline scenario
Only a part of the total volume of pulps is used as cattle feed while the rest are mixed in the soil
within the plantation. Thus, it is deemed not used effectively considering that there are alternative
uses for these pulps such as for the production of methane (as a fuel source) to run a generator to
produce electricity.
The power requirements of DMPI in its plantation and cannery facility are supplied by a local
electric distribution company whose supply in turn is sourced from the national grid. Its wastewater
treatment facility is in overload condition where the inlet amount and inlet BOD of wastewater have
exceeded the design values.
The baseline scenario is, “the power consumption from the public grid which is substituted by
power generation from this project" and "methane generation from the water treatment facility in
overload condition". The project set-up will involve anaerobic fermentation of pulps and wastewater
and production of biogas containing methane which will then be used as an alternate fuel to
generate power. Power generated by this project will be sold to DMPI and the local grid through the
local power utility company thereby reducing the use of fossil fuel for power generation. Other
benefits of this project include improvement of the wastewater treatment facility where its overload
condition is addressed or improved and that the methane produced will be put into better use.
Not only wastewater but the pulps can also be used to generate methane which will be used as
an alternative fuel for power generation. There is no other case in the Philippines in which these
kinds of biomass are utilized effectively and converted to power.
4) Baseline emission
The quantity of baseline emission of this project is calculated from (1) the quantity of baseline
emission from the electric power which will be replaced by this project and (2) the amount of
carbon dioxide (CO2) during the aerobic treatment at the wastewater treatment facility.
(a) Grid electric power alternative (AMS-I.D.)
BEy (AMS-I.D.)=EGy×EFy
Parameter Content Value Calculation basis
BEy(AMS-I.D.) Baseline emission in year y 54,451 =76,800MWh/year×0.709t-CO2/MWh
(tCO2/year)
EGy Quantity of net electricity 76,800 =10MW×24hours×320days
supplied to the grid as a result
of the implementation of the CDM
project activity in year y
(MWh/year)
EFy CO2 emission factor of the grid 0.709 (Mindanao grid)
in year y
(tCO2/MWh)
Summary -9-FY2010 CDM/JI Feasibility Study (FS) Report (Summary)
(b) Methane generated from the DMPL wastewater facility (AMS-III.H.)
BEy (AMS-III.H.)={BEpower,y+BEww,treatment,y+BEww,dischaege,y}
Parameter Content Value Calculation basis
BEy(AMS-III.H.) Baseline emission in year y 84,257 =5,990+78,004+263
(tCO2/year)
BEpower,y Baseline emission from 5,990 =1.1MW×320days×24hours×0.709
electricity or fuel consumption
in year y
(tCO2/year)
BEww,treatment,y Baseline emission of wastewater 78,004 =4,015,000m3/year×0.0139t/m3×
treatment systems affected by the 0.3×0.25tCH4/tCOD×0.89×
project activity in year y 21tCO2/tCH4
(tCO2/year)
BEww,discharge,y Baseline methane emission from 263 =4,015,000m3/year×21tCO2/tCH4
degradable organic carbon in ×0.25tCH4/tCOD×0.89×
treated wastewater dishcharged 0.00014t/m3×0.1
into sea
(tCO2/year)
BEww,treatment,y=Qww,y×CODremoved,BL×MCFww,treatment,BL×Bo,ww×UFBL×GWPCH4
Parameter Content Value Calculation basis
Qww,y Volume of wastewater treated in 4,015,000 =11,000m3/day×365days
baseline wastewater treatment
system in year y
(m3/year)
CODremoved,BL Chemical oxygen demand removed by 0.0139 =0.014t/m3×99%
baseline treatment system in year
y
(t/m3)
MCFww,treatment,BL Methane correction factor for 0.3 (AMS-Ⅲ.H./Ver.15)
baseline wastewater treatment Aerobic trematment, overloaded
system
(-)
Bo,ww Methane producing capacity of the 0.25 (AMS-Ⅲ.H./Ver.15)
wastewater
(tCH4/tCOD)
UFBL Model correction factor to 0.89 (AMS-Ⅲ.H./Ver.15)
account for model uncertainties
(-)
GWPCH4 Global Warming Potential for 21 (AMS-Ⅲ.H./Ver.15)
methane
(tCO2/tCH4)
BEww,discharge,y=Qww,y×GWPCH4×Bo,ww×UFBL×CODww,discharge,BL×MCFww,BL,discharge
Parameter Content Value Calculation basis
CODww,discharge,BL Chemical oxygen demand of the 0.00014 =0.014t/m3×(100-99)%
treated wastewater discharged
into sea in the baseline
situation in the year y
(t/m3)
MCFww,BL,discharge Methane correction factor based 0.1 (AMS-Ⅲ.H./Ver.15)
on discharge pathway in the Discharge of wastewater to sea
baseline situation of the
wastewater
(-)
(c) Total baseline emission
Parameter Content Value Calculation basis
BEy(total) The total of baseline emission 138,708 =54,451+84,257
(tCO2/year)
Summary -10-FY2010 CDM/JI Feasibility Study (FS) Report (Summary)
(2) Project emission
The amount of gas emission in this project is calculated with (1) consumption of electricity
through this project activity, and (2) the amount of carbon dioxide (CO2) in the anaerobic
treatment from the wastewater treatment system used for the project.
(a) Consumption of electricity through the project activity (AMS-I.D.)
PEy (AMS-I.D.)=PGy×EFy
Parameter Content Value Calculation basis
PEy(AMS-I.D.) Project emission in year y 2,723 =3,840MWh/year×0.709t-CO2/MWh
(tCO2/year)
PGy Emissions from electricity 3,840 =0.5MW×24hours×320days
consumption through the project
in the year y
(MWh/year)
EFy CO2 emission factor of the grid 0.709 (Mindanao grid)
in year y
(tCO2/MWh)
(b) CO2 from the wastewater treatment system used for the project (AMS-III.H.)
PEy (AMS-III.H.)={PEpower,y+PEww,treatment,y+PEww,dischaege,y+PEfugitive,ww,y}
Parameter Content Value Calculation basis
PEy(AMS-III.H.) Project emission in year y 29,331 =6,806+50+22,475
(tCO2/year)
PEpower,y Emissions from electricity 6,806 =1.25MW×320days×24hours×
consumption for the wastewater 0.709
treatment system in the project
in the year y
(tCO2/year)
PEww,treatment,y Methane emissions from wastewater 0 =4,015,000m3/year×0.0021t/m3×
treatment systems affected by the 0.0×0.25×1.12×21tCO2/tCH4
project activity in year y
(tCO2/year)
PEww,discharge,y Methane emissions from degradable 50 =4,015,000m3/year×21tCO2/tCH4
organic carbon in treated ×0.25tCH4/tCOD×1.12×
wastewater in year y 0.00002t/m3×0.1
(tCO2/year)
PEfugitive,ww,y Fugitive emissions through 22,475 =(1-0.9)×4,015,000m3/年×
capture inefficiencies in the 0.25tCH4/tCOD×1.12×0.0119t/m3
anaerobic wastewater treatment ×0.8×21tCO2/tCH4
systems in the year y
(tCO2/year)
PEww,treatment,y=Qww,y×CODremoved,PJ,k×MCFww,treatment,PJ,k×Bo,ww×UFPJ×GWPCH4
Parameter Content Value Calculation basis
CODremoved,PJ,k Chemical oxygen demand removed by 0.0021 =0.014t/m3×(100-85)%×99%
project wastewater
treatment system affected by the
project activity in year y
3
(t/m )
MCFww,treatment,PJ,k Methane correction factor for 0.0 (AMS-Ⅲ.H./Ver.15)
project wastewater treatment anearobic treatment, well
affected by the project activity managed
(-)
UFPJ Model correction factor to 1.12 (AMS-Ⅲ.H./Ver.15)
account for model uncertainties
(-)
Summary -11-FY2010 CDM/JI Feasibility Study (FS) Report (Summary)
PEww,discharge,y=Qww,y×GWPCH4×Bo,ww×UFPJ×CODww,discharge,PJ×MCFww,PJ,discharge
Parameter Content Value Calculation basis
CODww,discharge,PJ Chemical oxygen demand of the 0.00002 =0.014t/m3×(100-85)%×(100-
treated wastewater discharged 99)%
into the sea in the project
scenario in year y
3
(t/m )
MCFww,PJ,discharge Methane correction factor based 0.1 (AMS-Ⅲ.H./Ver.15)
on the discharge pathway of the Discharge of wastewater to sea
wastewater in the project
scenario
(-)
PEfugitive,ww,y=(1-CFEww)×Qww,y×Bo,ww×UFPJ×CODremoved,PJ×MCFww,treatment,PJ×GWPCH4
Parameter Content Value Calculation basis
CFEww Capture efficiency of the biogas 0.9 (AMS-Ⅲ.H./Ver.15)
recovery equipment in the
wastewater treatment systems
(-)
CODremoved,PJ The chemical oxygen demand 0.0119 =0.014t/m3×85%
removed10 by the treatment system
of the project activity equipped
with biogas recovery in the year
y
3
(t/m )
MCFww,treatment,PJ Methane correction factor for 0.8 (AMS-Ⅲ.H./Ver.15)
project wastewater treatment syst anearobic reactor without
emequipped with biogas recovery methane recovery
equipment
(-)
(c) Total project emission
Parameter Content Value Calculation basis
PEy(total) The total of baseline emission 32,054 =2,723+29,331
(tCO2/year)
(3) Monitoring plan
Based on AMS-I.D and AMS-III.H, a plan which can collect and record required monitoring data
synthetically is adopted. The monitoring system is shown in Fig. 6 and the monitoring plan is shown
in Table 2.
No.14‐1
No.15‐1 No.16‐1 No.11‐1 No.19‐1
No.1 No.2 No.3 No.13‐1
No.17‐1 No.18‐1 No.12‐1
Methane Biogas Gas utilization
fermentation equipment DMPI
facility of fruit Electric BUSECO
pulps power
Pulps
Soil
No.6 No.7 No.8
Residue after methane mixing
Cannery fermentation
No.12‐2
Wastewater Methane
fermentation Gas utilization
facility of equipment DMPI
wastewater Biogas Electric CEPALCO
power
No.15‐2 No.16‐2
No.4 No.5 No.13‐2 No.11‐2 No.19‐2
No.17‐2 No.18‐2
No.14‐2
No.10
No.9
Aerobic treatment
facility of Discharging
Wastewater after Treatment
methane fermentation wastewater water
Fig. 6 Monitoring system of the project scenario
Summary -12-FY2010 CDM/JI Feasibility Study (FS) Report (Summary)
Table 2 Monitoring items and frequency of measurements
Measurement
No. Item Content
frequency
1 Qsw,y Amount of pulps 1 time/day
2 Msw,y Moisture content of pulps 1 time/month
3 CODsw,untreated,y COD of pulps 1 time/month
4 Qww,y Volume of wastewater 1 time/day
5 CODww,untreated,y COD of wastewater 1 time/month
6 Qsw,treated,y Amount of residue of pulps after 1 time/day
methane fermentation
7 Msw,treated,y Moisture of residue of pulps after 1 time/month
methane fermentation
8 CODsw,treated,y COD of residue of pulps after 1 time/month
methane fermentation
9 CODww,treated,y COD of wastewater after methane 1 time/month
fermentation
10 CODww,discharge,y COD wastewater discharged 1 time/month
11 EGy Amount of electric power production 1 time/day
12 EGfacility,y Annual electric power production 1 time/day
13 H Operation time 1 time/day
14 ECy Amount of power supplies to the grid 1 time/month
15 BGburnt,y Amount of biogas generation 1 time/day
16 WCH4,y Methane concentration in biogas 1 time/day
17 P Pressure of biogas 1 time/day
18 T Temperature of biogas 1 time/day
19 FE Flare efficiency Opportune
(4) Greenhouse gas emission reduction
The quantity of greenhouse gas (GHG) emission reduction expected in this project is estimated as
follows (Table 3).
Table 3 Greenhouse gas emission (GHG) reduction through this project
(Unit:tCO2/year)
Baseline emission Project emission
CO2 from
Methane Consumption
the
Operation Grid generated
Total
of
wastewater Total Emission
year electric from the electricity reduction
baseline treatment project
power aerobic through the
emission system used emission
alternative treatment project
for the
facility activity
project
2013 54,451 84,257 138,708 2,723 29,331 32,054 106,654
2014 54,451 84,257 138,708 2,723 29,331 32,054 106,654
2015 54,451 84,257 138,708 2,723 29,331 32,054 106,654
2016 54,451 84,257 138,708 2,723 29,331 32,054 106,654
2017 54,451 84,257 138,708 2,723 29,331 32,054 106,654
2018 54,451 84,257 138,708 2,723 29,331 32,054 106,654
2019 54,451 84,257 138,708 2,723 29,331 32,054 106,654
2020 54,451 84,257 138,708 2,723 29,331 32,054 106,654
2021 54,451 84,257 138,708 2,723 29,331 32,054 106,654
2022 54,451 84,257 138,708 2,723 29,331 32,054 106,654
Summary -13-FY2010 CDM/JI Feasibility Study (FS) Report (Summary)
(5) Duration of the project activity / crediting period
The project will start in 2011. The target commencement of commercial operation is on January
2013. The crediting period will be ten years from 2013 to 2022.
(6) Environmental impacts and other indirect influence
According to the standard procedure concerning the environmental impact indicated in the
"REVISED PROCEDURAL MANUAL FOR DENR ADMINISTRATIVE ORDER NO.30 SERIES
OF 2003” (DAO 03-30), this project is classified into a waste power generation project. Since power
generation capacity is projected at 4 MW (using pulps) and 6 MW (using wastewater) , both biomass
power generation plants do not need enforcement of Environmental Impact Statement (EIS). It will
only require submission of an Initial Environmental Examination (IEE) Report for the issuance of
Environmental Compliance Certificate (ECC).
The environmental impacts of the project during its implementation are air pollution coming from
the exhaust gas of the engine, plant noise and the dust during the construction stage, among others.
However, these can be minimized by doing high level exhaust management and the operation and
maintenance of suitable apparatus.
(7) Stakeholders’ comments
DMPI, which is the materials donor of pulps and wastewater from the cannery, and the Cagayan
Electric Power and Light Company, Inc., hereafter referred to as (“CEPALCO”) as the local public
utility that were interviewed in this study.
DMPI has a positive evaluation on this project because it maximizes the use the pulps and
wastewater which are currently not used effectively.
CEPALCO is a power distribution company that purchases electric power from the National Power
Corporation, hereafter referred as (“NPC”), and distributes to consumers. In Mindanao, since power
supply is insufficient, CEPALCO expects that the implementation of this project would help alleviate
this shortage especially in Cagayan de Oro City.
In the future, according to the standard procedure on environmental impact assessment as
indicated in the "INTERIM GUIDELINES ON THE CONDUCT OF STAKEHOLDER’S
CONSULTATION UNDER DAO 2005-17”, public scoping includes the provision of global warming
and the outline of CDM, among others and will be scheduled after establishment of the Special
Purpose Company (SPC).
(8) Project implementation structure
The project implementation structure is shown in Fig. 7.
Summary -14-FY2010 CDM/JI Feasibility Study (FS) Report (Summary)
EJBP etc.
-Materials
-Land Capital Dvidend
SPC Power
Payment
DMPI (Special Purpose Public grid
Payment Company) Payment
CERs
Application CERs
Poewr Payment
UNFCCC CDM Carbon
Executive Board credit buyer
Fig. 7 Project Structure
(9) Financing plan
1) Initial investment
The amount of initial gross investment is estimated at 3 billion yen (1,210 million yen: use of
pulps, 1,790 million yen: use of wastewater).
2) Cash planning (loan and interest rates)
The 30% of the initial gross investment of the project equivalent to approximately 900 million
yen will be raised as the initial capital and the remaining 70% equivalent to 245 million yen will be
loaned from banks and other institutions.
Concrete discussion about cash planning will be carried out; funds will be raised through project
financing or corporate financing from domestic banks such as Development Bank of the Philippines,
other local banks or the main financing banks of investors.
3) Financial assumptions
The main assumptions in this study are as follows:
- Electricity sales-to-utilities unit price: 6.0 pesos/kWh
- Power generation capacity: 10 MW
- Borrowing rate of interest: 8% (one-year deferment and five-year payment)
- Annual cost: 230 million yen/year (materials purchase, maintenance and repair, labor cost,
contingency)
- Plant investment: 2,700 million yen (10% of residual book-value, ten-year depreciation)
- Corporation tax for seven years: Duty-free by the application of Renewable Energy Act
- Corporation tax rate in the 8th and afterwards: 10% from the corporation tax rate tax cut action
- Local tax: Small sum
-Value-added tax: Duty-free by the application of Renewable Energy Act
- Acquisition CERs (NEDO - New Energy and Industrial Technology Development
Organization has priority to negotiate sales): 12 U.S. dollars/t-CO2
Summary -15-FY2010 CDM/JI Feasibility Study (FS) Report (Summary)
(10) Analysis of the project business potential
1) Business balance
IRR (Internal Rate of Return) with CERs profit at the price of 12 U.S. dollars/tCO2 is 12.1 %.
2) The sensitivity analysis of CERs profit
The result of the sensitivity analysis showing the IRR in the various conditions of CERs price is
clearly shown that CERs prices greater than 10 U.S. dollars/tCO2, the IRR would exceed the
benchmark of 11.0%. The importance of this result is discussed in later sections.
3) The standard of investment rating
The likelihood that institutions will invest into this project depends on the comparison of the
IRR and some other benchmarks such as loan interest on loans in the host country among others.
In the Philippines, the long-term interest rate ranges from 7.8% to 11%. Hence for this project,
the benchmark is set on the high side to 11%. For this project, if the IRR is less than the above
benchmark, the project may not be economically feasible. Conversely, if the IRR will be higher than
the benchmark, then the feasibility of the project is enhanced.
Applying such rule of thumb to get at least an intial idea on the feasibility of the project, if the
CDM framework is not adopted where no profit from CER sales is credited, the project IRR (around
6.6%) will be less than the benchmark, it is unlikely that the project will be feasible. However, if the
CDM framework is adopted and CER sales are priced at 12USD/tCO2, the IRR (around 12.1%) will
exceed the abovementioned benchmark and the project may be deemed feasible.
(11) Demonstration of additionality
This project is classified as a small-scale CDM. To demonstrate its additionality, it needs to hurdle
one or more investment barriers, the technological barrier, the common practice barrier and other
barriers relevant to project implementation.
Existence of the investment barrier
In the economic efficiency analysis of this project, great improvement is found in comparing
the IRR without CERs profit on sale and IRR with CERs profit on sale at 12 U.S. dollars/tCO2. The
potential of this project to be classified as a CDM project is high.
- IRR without CERs profit on the sale = 6.6% (eight years: recovery of investment)
- IRR with CERs profit on the sale = 12.1% (six years: recovery of investment)
The investment benchmark for this project is determined to be 11.0%, based on the long-term
interest rate of the Development Bank of the Philippines. Since the IRR (6.6%) without CERs profit
on the sale is less than the benchmark, the feasibility of this project is judged to be low if this is not
a CDM project. Otherwise, as shown in the previous section, this project may be feasible if this will
become a CDM project and CER sales will be at 12 U.S. dollars/tCO2.
Existence of the technological barrier and the common practice barrier
This potential CDM project will be the first of its kind in the Philippines where pulps will be
used to produce an alternative fuel source for power generation. As such, investment, technological
and common practice barriers exist. Thus, the additionality of this project is proven.
Summary -16-FY2010 CDM/JI Feasibility Study (FS) Report (Summary)
(12) Feasibility and problems of this project
1) Technical problem
To determine whether the project is technically feasible, actual trials or experiments will be
conducted using real samples, i.e., pulps and wastewater. Detailed examination of all parameters
such as sample injection method, number of stay days among others will be carried out.
2) Economic problem
The economic viability of the project should be high for this to be feasible. In the future, as this
technology evolves, it is necessary to increase its economic viability by making improvements in
various stages and parameters of the project. For example, reduction of initial capital cost, reduction
in operating and maintenance expenses, higher electricity price (sales to utilities) and many other
parameters. Another important parameter that is worth special mention is the foreign exchange risk.
This is especially true considering the repercussions in the instability of the US dollar as
demonstrated during the previous monetary crisis that greatly affected the global economy but
particularly Asia in 1997.
3) An institutional problem
The price of CERs-sales negotiation and the price of the electricity-sales contract negotiation
through the Renewable Energy Law greatly influence the business potential of this project. The
incentive granted to renewable energy is a global trend. It is expected that maintenance and further
improvement in the implementation of the renewable energy law is forthcoming although risks such
as policy changes that affect implementation especially in the Philippines should be taken into
consideration.
4) CDM registration period
A protracted registration period and approval process by the CDM Executive Board may place
some uncertainty into the full implementation of this project. Hence, the proper presentation of
valid results into the feasibility of this project, based on previous experience in other countries and
the actual trials or experiments done will hopefully allow for the smooth endorsement of this project
by the Executive Board.
5. Validation (Pre-validation)
(1) Outline of the Pre-validation
1) Major reviewed items
- Applicability of baseline methodology
- Demonstration of the Additionality
- Applicability of monitoring methodology
- Stakeholders' comments
2) Major suggested items
The following are the major items pointed out by the Designated Operational Entity
(DOE).
In response to the items pointed out as followings, corrections such as
supplementing PDD entries concerning locations which can be corrected at this time
Summary -17-FY2010 CDM/JI Feasibility Study (FS) Report (Summary)
were done. Furthermore, we submitted the Clarification for the applicability of the
methodology AMS III.H to the CDM-EB.
(a) Conclusion
As a result of the initial review of the PDD, there are no any clearly fatal issues
for the applicability and interpretation of this project as a CDM project.
(b) Applicability of baseline methodology
The application of AMS I.D is sufficiently justified.
Though the clause 1 (a) of the methodology AMS III.H is applicable for
“substitution” of an aerobic waste water treatment systems with anaerobic systems,
the project activity is described to be “introduction” of a new anaerobic treatment
system to an existing aerobic treatment system. DOE recommended the Clarification
to CDM-EB due to the difficulty of judgment of the applicability.
(c) Additionality
For the investment barrier, it needs to be demonstrated that the financial
analysis considers all applicable incentives for the project activity, including the
Japanese government fund support available for the project. Furthermore,
sensitivity analysis regarding with IRR calculation condition would be mentioned in
detail.
(d) Stakeholders’ comments
Local stakeholders consultation process needs to be completed before the
validation process and to be further considered about the stakeholder other than the
DMPI.
(2) Background to exchanges with the DOE
Pre-validation has been conducted by DOE during the period from January 14 to
January 27, 2011.
In response to the items pointed out above in the pre-validation report, the answers
were received from DOE toward our clarifications. In accordance with their reply, a part
of PDD was revised in correct and submitted the Clarification for the applicability of
AMS-III.H to the CDM-EB.
6. Results of study of co-benefit
(1) The item for evaluation
The quantification item of the effect of the environmental pollution control measure in this study is
shown below.
- Reduction of the chemical oxygen demand (COD) load flowing into the plantation
- Reduction of the COD load flowing into the aeroic wastewater treatment facility in overload
(2) A baseline / project scenario
1) Reduction of the COD load which flows into the plantation
Summary -18-FY2010 CDM/JI Feasibility Study (FS) Report (Summary)
Pulps from the cannery are currently left untreated and are simply mixed into the soil. The COD
load originates from pulps and the implementation of this project would allow for the extraction of
the methane generated from the fermentation of the pulps before the used pulps are mixed with the
soil. Therefore, the baseline state is "pulps are mixed with the soil" and the project state is "pulps
after methane fermentation are mixed with the soil."
2) Reduction of the COD load flowing into the aerobic wastewater treatment facility
in overload
At present, the wastewater treatment facility is in overload condition where the design values
are often exceeded in terms of water quality. The improvement in wastewater quality, after methane
production from this project, would allow the enhancement of the quality of water thereby resulting
in the reduction of the COD load. This wastewater will then be treated at the treatment plant before
it is discharged to the sea. Therefore, the baseline state is "wastewater is treated in the aerobic
wastewater treatment facility" and the project state is "wastewater after methane fermentation is
treated in the aerobic wastewater treatment facility."
(3) Evaluation method of the baseline / monitoring plan
1) Evaluation method of the baseline
As a rule, actual measurement data collected will be used for evaluation of the baseline
conditions.
2) Monitoring plan
(a) Reduction of the COD load which flows into the plantation
Several parameters will be monitored and actual measurements taken such as weight,
moisture content and COD of the pulps among others after methane fermentation and used power
generation will be taken.
(b) Reduction of the COD load flowing into the aerobic wastewater treatment
facility in overload
Among the parameters to be strictly monitored and measured are the inflow and COD of the
wastewater after fermentation and after power generation.
(4)The calculation process and the result of the property (quantification)
1) Reduction of the COD load which flows into the plantation
Calculation conditions
- Amount of pulps used in the project: 270 t/day
- COD of pulps: 1,300 g/kg (dry)
- Moisture content of pulps: 78%.
- COD decomposition rate of pulps: 85%
Therefore,
COD load reduction
= 270 t/day x (100% - 78%) x 1,300 g/kg x 70% x 365 day
= 19,730 tCOD / year
Summary -19-FY2010 CDM/JI Feasibility Study (FS) Report (Summary)
2) Reduction of the COD load flowing into the aerobic wastewater treatment facility
in overload
Calculation conditions
- Amount of wastewater used in the project: 11,000 m3/day
- COD of wastewater: 14,000 mg/L
- COD decomposition rate of wastewater: 85%.
Therefore,
COD load reduction
= 11,000 m3/day x 1,400 mg/L x 85% x 365 day
= 47,779 tCOD / year
7. The Result of investigation about contribution to sustainable development
The implementation of this project will not only lead to the reduction of GHG emission of the host
country but also contribute to the reduction in the share of fossil fuel to the power generation mix
thereby contribute to the reduction of air pollution as a result of the reduced fossil fuel use, address
issues regarding the stability of the local power supply and creation of job opportunities during the
construction period and operations period of the fermentation and power plants.
Summary -20-You can also read