Southern Atlanta Suburbs - COMPREHENSIVE HOUSING MARKET ANALYSIS Atlanta Metropolitan Area Series Focus On: HUD User
←
→
Page content transcription
If your browser does not render page correctly, please read the page content below

The analysis presented in this report was completed prior to the COVID-19 outbreak
in the United States and therefore the forecast estimates do not take into account
the economic and housing market impacts of the actions taken to limit contagion
of the virus. At this time, the duration and depth of the economic disruption are
unclear, as are the extent and effectiveness of countermeasures. HUD will continue
to monitor market conditions in the HMA and provide an updated report/addendum
in the future.

        COMPREHENSIVE HOUSING MARKET ANALYSIS
   Atlanta Metropolitan Area Series Focus On:
  Southern Atlanta Suburbs

      U.S. Department of Housing and Urban Development,
      Office of Policy Development and Research
      As of January 1, 2020

      Share on: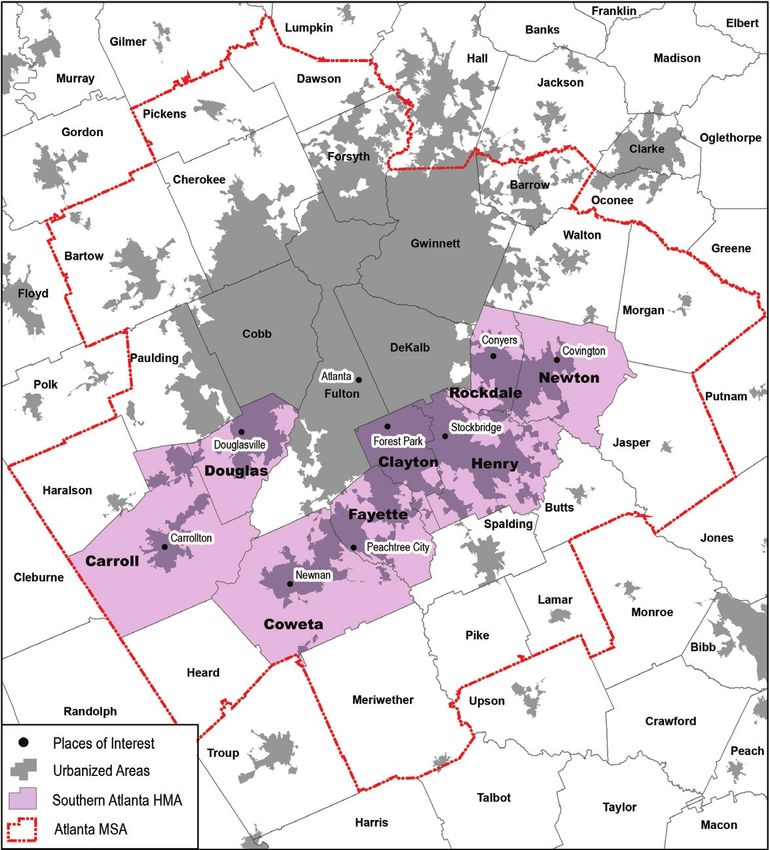
Atlanta Metropolitan Area Series Focus On: Southern Atlanta Suburbs Comprehensive Housing Market Analysis as of January 1, 2020                                                  Executive Summary 2

Executive Summary
Housing Market Area Description
The Southern Atlanta Suburbs Housing Market Area (HMA)
consists of eight counties (Carroll, Clayton, Coweta, Douglas,
Henry, Fayette, Newton, and Rockdale) and is part of the
29-county Atlanta-Sandy Springs-Roswell, GA Metropolitan
Statistical Area (hereafter, Atlanta MSA).

The current population of the HMA is estimated at 1.27 million,
21 percent of the Atlanta MSA population.

The HMA is a popular place to live for people who commute
to jobs in the economic core of the Atlanta MSA, particularly
DeKalb and Fulton Counties. The population is heavily
concentrated along the Interstate 75 (I-75), Interstate 85                                                Tools and Resources
(I-85), and Interstate 20 (I-20) corridors near the city of
                                                                                                           Find interim updates for this metropolitan area, and select geographies nationally,
Atlanta. Notable cities in the HMA include Carrollton,                                                     at PD&R’s Market-at-a-Glance tool.
                                                                                                           Additional data for the HMA can be found in this report’s supplemental tables.
Douglasville, Newnan, and Peachtree City.                                                                  For information on HUD-supported activity in this area, see the Community Assessment Reporting Tool.

                                                           Comprehensive Housing Market Analysis Atlanta Metropolitan Area Series Focus On: Southern Atlanta Suburbs
                                                                                                      U.S. Department of Housing and Urban Development, Office of Policy Development and Research
Atlanta Metropolitan Area Series Focus On: Southern Atlanta Suburbs Comprehensive Housing Market Analysis as of January 1, 2020                                                            Executive Summary 3

Market Qualifiers
Economy                                                              Sales Market                                                                     Rental Market
             Strong: 63,800 jobs were added                                    Balanced: A 3.5-month supply                                                          Balanced: The average apartment
             in the Atlanta MSA during 2019.                                   of inventory was available as of                                                      vacancy rate in the HMA decreased
                                                                               December 2019, down from a                                                            slightly, and the average apartment
                                                                     3.8-month supply during December 2018                                                           rent increased 6 percent during the
                                                                     and significantly less than the 13.5-month                                                      past year.
                                                                     supply during December 2010.
Economic conditions in the MSA are strong.                           The sales market in the HMA is currently balanced.                               The rental housing market in the HMA is currently
During 2019, nonfarm payrolls in the MSA                             Reduced levels of home construction and                                          balanced with an estimated overall rental vacancy
increased by 63,800 jobs, or 2.3 percent, up                         increased net in-migration have contributed to                                   rate of 6.0 percent, down from 13.2 percent in
from the 2.1-percent growth rate during 2018.                        significant absorption of excess inventory since                                 April 2010. Strong growth in renter households has
By comparison, nonfarm payrolls in the nation                        the early 2010s. As of January 1, 2020, the overall                              generally outpaced construction of rental units and
increased 1.4 percent during 2019 and 1.6 percent                    sales vacancy rate was estimated at 1.6 percent,                                 the conversion of owner-occupied units to rental
during 2018. During the 3-year forecast period,                      down from 3.7 percent in April 2010. During the                                  use since 2010. During the next 3 years, demand
nonfarm payroll growth in the MSA is expected                        3-year forecast period, demand is estimated for                                  in the HMA is expected for 3,850 new rental
to average 1.7 percent annually, with the HMA                        17,000 new homes, accounting for 24 percent                                      units, representing 12 percent of demand in the
benefitting from that growth.                                        of total demand in the Atlanta MSA. Demand                                       Atlanta MSA. The 1,800 rental units currently under
                                                                     is expected to increase each year during the                                     construction in the HMA, and the 930 additional
                                                                     forecast period as population growth accelerates                                 units in planning, will satisfy most of the demand
                                                                     and economic conditions remain strong. The                                       during the next 2 years.
                                                                     2,500 homes currently under construction will
                                                                     satisfy some of the forecast demand.

TABLE OF CONTENTS
Economic Conditions 4                                                                                                                  3-Year Housing Demand Forecast
                                                                                                                        Sales Units                                                      Rental Units
Population and Households 10                                                                          MSA*           Southern Atlanta Suburbs HMA                    MSA*              Southern Atlanta Suburbs HMA
Home Sales Market 14                                                Total Demand                     69,900                     17,000                              32,200                         3,850
                                                                    Under Construction               14,200                      2,500                              18,000                         1,800
Rental Market 19
                                                                     *Atlanta-Sandy Springs-Roswell Metropolitan Statistical Area
Terminology Definitions and Notes 22                                 Notes: Total demand represents estimated production necessary to achieve a balanced market at the end of the forecast period. Units under construction as of
                                                                     January 1, 2020. The forecast period is January 1, 2020, to January 1, 2023.
                                                                     Source: Estimates by the analyst

                                                           Comprehensive Housing Market Analysis Atlanta Metropolitan Area Series Focus On: Southern Atlanta Suburbs
                                                                                                           U.S. Department of Housing and Urban Development, Office of Policy Development and Research
Atlanta Metropolitan Area Series Focus On: Southern Atlanta Suburbs Comprehensive Housing Market Analysis as of January 1, 2020 Economic Conditions 4
Economic Conditions Table 1. 12-Month Average Nonfarm Payroll Jobs (1,000s)
in the Atlanta MSA* by Sector
12 Months 12 Months
Largest Sector: Professional and Business Services Ending Ending Absolute Percentage
December December Change Change
2018 2019
Economic conditions in the Atlanta MSA have been strong since 2014; Total Nonfarm Payroll Jobs 2,785.6 2,849.4 63.8 2.3
job growth has exceeded the national rate every year since 2011.
Goods-Producing Sectors 295.6 303.4 7.8 2.6
Mining, Logging, & Construction 126.9 131.5 4.6 3.6
Primary Local Economic Factors Manufacturing 168.7 171.9 3.2 1.9
The Atlanta MSA is an international hub for logistics, education, health care, Service-Providing Sectors 2,490.0 2,546.1 56.1 2.3
and trade. The presence of Hartsfield-Jackson Atlanta International Airport—the Wholesale & Retail Trade 443.7 445.5 1.8 0.4
busiest airport in the world since 2000 (Airports Council International)—and Transportation & Utilities 148.1 156.8 8.7 5.9
the educated workforce—including graduates from Emory University, Georgia Information 99.2 101.1 1.9 1.9
Institute of Technology, and Georgia State University—make the MSA an Financial Activities 173.1 177.4 4.3 2.5
attractive location for corporations. The headquarters of nearly 30 Fortune Professional & Business Services 537.2 549.3 12.1 2.3
Education & Health Services 356.5 371.7 15.2 4.3
1,000 companies are in the Atlanta MSA, including Delta Air Lines, Inc.,
Leisure & Hospitality 297.6 305.4 7.8 2.6
The Home Depot, Inc., AT&T Inc., United Parcel Service, Inc. (UPS), and
Other Services 100.8 104.2 3.4 3.4
The Coca-Cola Company. The HMA is located just outside the city of Atlanta
Government 333.9 334.7 0.8 0.2
and has been a generally stable part of the economy of the MSA during the
*Atlanta-Sandy Springs-Roswell Metropolitan Statistical Area
past two decades. The HMA currently accounts for approximately 15 percent Notes: Based on 12-month averages through December 2018 and December 2019. Numbers may not
of covered employment in the MSA, down slightly from 16 percent during 2010, add to totals due to rounding. Data are in thousands.
Source: U.S. Bureau of Labor Statistics
but equal to the 15-percent share in 2001 (Quarterly Census of Employment
and Wages [QCEW]).
the MSA during 2019 (Figure 1) and added the second most jobs, 12,100—an
Current Conditions—Nonfarm Payrolls increase of 2.3 percent. The fastest rate of job growth was in the transportation
Job growth remained strong in the Atlanta MSA during the past year and and utilities sector, which was up 5.9 percent, or by 8,700 jobs. The opening of
continued to exceed the rate for the nation. During 2019, nonfarm payrolls in a new UPS distribution hub outside the HMA in northwest Atlanta contributed
the MSA averaged 2.85 million jobs, an increase of 63,800 jobs, or 2.3 percent, significantly to the job growth in the sector. The facility, which is the second
from a year ago (Table 1). That rate of job growth was up from 2.1 percent during largest UPS facility in the nation at 1.2 million square feet, processes
2018 and was higher than the 1.4-percent rate for the nation. All nonfarm payroll approximately 100,000 parcels an hour and created 3,000 jobs when it opened
sectors added jobs in the MSA. The education and health services sector, which in late 2018. Current nonfarm payroll data is not available for the HMA, although
expanded by 15,200 jobs, or 4.3 percent, led job growth. The professional and recent economic conditions have been significantly influenced by the overall
business services sector accounted for 19 percent of the nonfarm payrolls in trends within the MSA.
Comprehensive Housing Market Analysis Atlanta Metropolitan Area Series Focus On: Southern Atlanta Suburbs
U.S. Department of Housing and Urban Development, Office of Policy Development and ResearchAtlanta Metropolitan Area Series Focus On: Southern Atlanta Suburbs Comprehensive Housing Market Analysis as of January 1, 2020 Economic Conditions 5
Figure 1. Share of Nonfarm Payroll Jobs in the Atlanta MSA* by Sector unemployment rate has been higher than that of the MSA throughout most of
Local 8% Mining, Logging, & Construction 5%
the past two decades (Figure 2). During 2019, the 3.7-percent rate in the HMA
State 3%
was down from the 4.2-percent rate during 2018 and a fraction of the peak rate
Federal 2% Manufacturing 6%
of 11.3 percent in 2010. By comparison, the unemployment rate of the nation
Other Services 4% Wholesale 5% was 3.7 percent during 2019, down from 3.9 percent a year ago.
Government
12%
Leisure & Hospitality 11% Retail 10%
Trade 16% Figure 2. 12-Month Average Unemployment Rate
Total
2,849.4 in the HMA*, the MSA**, and the Nation
Education
& Health Transportation & Utilities 6% MSA Nation HMA
Services
13% 12.0
Information 4%
Health 11%
Unemployment Rate (%)
10.0
Financial Activities 6%
Education 2% 8.0
Professional & Business Services 19% 6.0
*Atlanta-Sandy Springs-Roswell Metropolitan Statistical Area 4.0
Notes: Total nonfarm payroll is in thousands. Percentages may not add to 100 percent due to rounding.
Based on 12-month averages through December 2019. 2.0
Source: U.S. Bureau of Labor Statistics
0.0
Current Conditions—Unemployment
De 00
De 05
De 06
De 2
De 08
De 9
De 03
De 04
De 07
De 01
De 10
De 5
De 2
De 16
De 8
9
De 13
De 14
De 17
De 11
c-0
c-0
c-1
c-1
c-1
c-1
c-
c-
c-
c-
c-
c-
c-
c-
c-
c-
c-
c-
c-
c-
De
The unemployment rate in the Atlanta MSA was 3.3 percent during 2019,
down from 3.8 percent during 2018, and down significantly compared with *Southern Atlanta Suburbs Housing Market Area, **Atlanta-Sandy Springs-Roswell Metropolitan Statistical Area
Note: Based on the 12-month moving average.
the 10.3-percent peak unemployment rate during 2010. In the HMA, the Source: U.S. Bureau of Labor Statistics
Economic Periods of Significance or 3.2 percent, annually. The fastest job growth was in the education and health
2004 through 2007 services sector, which added an average of 9,300 jobs, or 4.2 percent, annually,
That fast job growth was due in part to several large-scale medical developments,
After declining an average of 1.4 percent a year from 2002 through 2003,
including Children’s Healthcare of Atlanta, which completed expansions at its
nonfarm payrolls in the Atlanta MSA increased by an average of 53,800 jobs, or
Egleston and Scottish Rite facilities for a combined $344 million in 2007.
2.3 percent, annually from 2004 through 2007. That rate was notably higher than
the 1.4-percent average rate for the nation. The professional and business sector The HMA accounted for approximately 23 percent of covered employment
added the most jobs during the period, expanding by an average of 12,100 jobs, growth in the Atlanta MSA from 2004 through 2007, adding an average of
Comprehensive Housing Market Analysis Atlanta Metropolitan Area Series Focus On: Southern Atlanta Suburbs
U.S. Department of Housing and Urban Development, Office of Policy Development and ResearchAtlanta Metropolitan Area Series Focus On: Southern Atlanta Suburbs Comprehensive Housing Market Analysis as of January 1, 2020 Economic Conditions 6
11,000 jobs, or 3.2 percent, annually (QCEW). Industry growth in the HMA Figure 3. 12-Month Average Nonfarm Payrolls in the Atlanta MSA*
generally mirrored that of the MSA, with strong gains in the professional and National Recession Nonfarm Payrolls
business services sector and the education and health services sector. Within
the HMA, those two sectors expanded by averages of 1,350 and 1,250 jobs, or 2,900
Nonfarm Payrolls (in Thousands)
4.5 and 4.0 percent, a year, respectively. 2,800
2,700
2008 through 2010 2,600
The MSA was impacted relatively severely by the economic downturn in the 2,500
late 2000s. Nonfarm payrolls declined by an average of 61,400 jobs, or 2.6
2,400
percent, annually from 2008 through 2010, when nonfarm payrolls in the
2,300
nation declined by an average of only 1.9 percent, annually. Both the largest
2,200
and fastest job losses in the MSA were in the mining, logging, and construction
2,100
sector. This sector accounted for more than one-fourth of all jobs lost in the
2,000
MSA during the period and contracted by an average of 16,000 jobs, or 12.9
De 00
De 06
De 05
De 08
De 09
De 4
De 2
De 03
De 07
De 01
De 15
De 16
De 4
De 10
De 18
9
De 2
De 13
De 17
De 11
percent, annually, as residential permitting declined an average of 44 percent,
c-0
c-0
c-1
c-1
c-1
c-
c-
c-
c-
c-
c-
c-
c-
c-
c-
c-
c-
c-
c-
c-
De
annually. Jobs losses were also particularly significant in the wholesale and
retail trade sector, which decreased by an average of 15,300 jobs, or 3.7 *Atlanta-Sandy Springs-Roswell Metropolitan Statistical Area
Note: 12-month moving average.
percent, a year. The retail trade subsector declined by an average of 9,900 Sources: U.S. Bureau of Labor Statistics; National Bureau of Economic Research
jobs, or 3.7 percent, annually during the period, accounting for just under two-
thirds of the jobs lost in the sector. From 2011 through 2018, the MSA added an average of 63,700 jobs, or 2.6
Covered employment in the HMA declined by an average of 11,250 jobs, or percent, annually, surpassing the pre-recessionary high in 2014. The rate of
3.1 percent, annually, from 2008 through 2010—a notably faster rate than the job growth in the MSA was well above the rate for the nation, which averaged
MSA. Manufacturing closures affected the HMA during the period; for example, 1.7 percent annually. Every sector in the MSA added jobs during the period. As
STMicroelectronics shuttered its facility in the city of Carrollton in 2008 for a with the period of economic expansion in the mid-2000s, the professional and
loss of 1,000 jobs. From 2008 through 2010, the manufacturing sector declined business services sector, which expanded by an average of 16,900 jobs, or 3.8
by an average of 2,500 jobs, or 7.0 percent, which accounted for more than percent, a year, led job growth. In 2013, AirWatch, a mobile technology and
20 percent of all job losses in the HMA. Decreased demand for goods also security provider, added 1,000 jobs as part of an expansion of its headquarters
contributed to a significant decline in retail trade activity in the HMA during in the MSA. More recently, Mercedes-Benz USA, LLC, created 700 jobs when
the period, and the retail trade subsector lost an average of 1,375 jobs, or 2.8 it relocated its headquarters to the MSA in 2015, and, in 2017, General Electric
percent, a year. Company created 650 jobs in the city of Atlanta as part of a relocation and
expansion of its North American Information Technology Unit. Job growth was
2011 through 2018 also significant from 2011 through 2018 in the education and health services
The Atlanta MSA recovered quickly from the economic downturn and has sector, which is also the only sector in the MSA to have added jobs each year
continuously added jobs at a rapid rate since the early 2010s (Figure 3). since 2000 and has led all other sectors in growth since 2000 (Figure 4). From
Comprehensive Housing Market Analysis Atlanta Metropolitan Area Series Focus On: Southern Atlanta Suburbs
U.S. Department of Housing and Urban Development, Office of Policy Development and ResearchAtlanta Metropolitan Area Series Focus On: Southern Atlanta Suburbs Comprehensive Housing Market Analysis as of January 1, 2020 Economic Conditions 7
Figure 4. Sector Growth in the Atlanta MSA* 2001 to Current
2011 through 2018, the education and health services sector added an average
Total Nonfarm Payroll Jobs
of 11,400 jobs, or 3.8 percent, due in part to the completion of several large
Goods-Producing Sectors
Mining, Logging, & Construction medical facilities. These facilities include the 210-bed medical tower at the Emory
Manufacturing
Service-Providing Sectors University Clifton Campus, which opened in early 2017, and WellStar Paulding
Wholesale & Retail Trade
Transportation & Utilities Hospital which created 500 new jobs when it opened in the city of Hiram in 2014.
Information
Financial Activities From 2011 through 2018, covered employment in the HMA increased an
Professional & Business Services
Education & Health Services average of 2.5 percent annually. During this period, the HMA accounted for
Leisure & Hospitality 15 percent of all covered employment growth in the MSA. Consistent with the
Other Services
Government MSA as a whole, gains in the professional and business services, leisure and
hospitality, and education and health sectors, which expanded by averages of
-10 0
00
11 00
00
60 0
10 0
70 0
90 0
30 0
40 0
50 0
0
80 0
20 0
0
.0
.0
.0
.0
.0
.0
.0
.0
.0
.0
0.
0.
0.
0.
10
1,650, 1,475, and 1,400 jobs, or 4.6, 3.4, and 3.4 percent, a year, respectively,
-2
Change in Jobs (%)
led job growth in the HMA.
*Atlanta-Sandy Springs-Roswell Metropolitan Statistical Area
Note: The current date is January 1, 2020.
Source: U.S. Bureau of Labor Statistics
Commuting Patterns 3 percent commute to primary jobs located outside of the MSA. Commutation
The HMA is currently estimated to account for a notably higher share from the HMA is particularly significant to DeKalb and Fulton Counties, which
(20 percent) of employed residents in the MSA than of the total number of jobs encompass the city of Atlanta and a large part of the economic core of the MSA.
(15 percent; Table 2). Approximately 38 percent of the employed residents of the Approximately 29 percent of the employed residents in the HMA commute to
HMA commute to primary jobs located elsewhere in the MSA, and an additional primary jobs located in DeKalb or Fulton Counties (Table 3).
Table 2. Estimated HMA* Share of MSA** Totals Table 3. Employed HMA* Residents by Location of Primary Jobs
2001 2010 Current Within HMA* 59%
(%) (%) (%) DeKalb and Fulton Counties 29%
Employed Residents 19 20 20 Remainder of Atlanta MSA** 9%
Jobs 15 16 15 Outside of Atlanta MSA** 3%
*Southern Atlanta Suburbs Housing Market Area, **Atlanta-Sandy Springs-Roswell Metropolitan Statistical Area *Southern Atlanta Suburbs Housing Market Area, **Atlanta-Sandy Springs-Roswell Metropolitan Statistical Area
Source: U.S. Bureau of Labor Statistics, estimates by the analyst Source: U.S. Census Bureau Journey to Work, 2015
Comprehensive Housing Market Analysis Atlanta Metropolitan Area Series Focus On: Southern Atlanta Suburbs
U.S. Department of Housing and Urban Development, Office of Policy Development and ResearchAtlanta Metropolitan Area Series Focus On: Southern Atlanta Suburbs Comprehensive Housing Market Analysis as of January 1, 2020 Economic Conditions 8
Table 4. Major Employers in the Southern Atlanta Suburbs HMA
Major Industries in the HMA Number of
Name of Employer Nonfarm Payroll Sector
Consistent with an abundance of readily developable land and close proximity Employees
to the economic core of the MSA, the trade, transportation, and utilities and the Delta TechOps Transportation & Utilities 6,000
manufacturing sectors are important to the economy of the HMA (Figure 5). The Southwire Company, LLC Manufacturing 3,400
trade and transportation and utilities sectors currently account for a combined Tanner Health System Education & Health Services 2,800
Luxottica Group S.p.A. Manufacturing 2,800
32 percent of all payrolls in the HMA, as compared with only 22 percent for the
Piedmont Henry Hospital Education & Health Services 1,800
MSA. The transportation and utilities sector in the HMA includes 6,000 employees
Yamaha Corporation Manufacturing 1,300
at Delta TechOps, a provider of maintenance and repair services at Hartsfield- Silver Line Building Products LLC Manufacturing 1,200
Jackson International Airport, which is partially located in Clayton County (Table 4). The Home Depot, Inc. Wholesale & Retail Trade 1,050
The HMA is also home to distribution and customer care centers for companies Federal Aviation Administration Government 1,000
such as The Home Depot, Inc. (1,050 jobs, Henry County), PetSmart Inc. (560 jobs, Takeda Pharmaceutical Company Limited Manufacturing 900
Coweta County), Georgia Power (550 jobs, Henry County), and Walmart Inc. Note: Excludes local school districts.
Sources: Carroll Tomorrow, Conyers Rockdale Economic Development Council, Coweta Development Authority,
(390 jobs, Carroll County). Due to a number of residents who commute to jobs Development Authority of Clayton County, Douglas County Economic Development Authority, Fayette County
Development Authority, Henry County Development Authority, Newton County Industrial Development Authority
Figure 5. Total Jobs in Selected Sectors and Industries in the Southern Atlanta Suburbs HMA
140,000
120,000
100,000
80,000
60,000
40,000
20,000
0
Trade, Retail Leisure Education Professional Manufacturing Financial Other Information
Transportation Trade & Hospitality & Health & Business Activities Services
& Utilities Services Services
Note: Average annual data for 2018, the most recent complete year available.
Source: U.S. Bureau of Labor Statistics, Quarterly Census of Employment and Wages
Comprehensive Housing Market Analysis Atlanta Metropolitan Area Series Focus On: Southern Atlanta Suburbs
U.S. Department of Housing and Urban Development, Office of Policy Development and ResearchAtlanta Metropolitan Area Series Focus On: Southern Atlanta Suburbs Comprehensive Housing Market Analysis as of January 1, 2020 Economic Conditions 9
located elsewhere, retail trade is a larger part of the economy in the HMA Employment Forecast
compared with the MSA as a whole. The subsector, which includes several large
During the 3-year forecast period, nonfarm payroll growth is expected to
shopping centers, currently accounts for an estimated 13 percent of all jobs
in the HMA, as compared with only 10 percent in the MSA. The HMA also has slow in the Atlanta MSA but remain strong at an average of 1.7 percent
a concentration of goods producers. The manufacturing sector accounts for annually. Notable job gains are expected in the transportation and utilities and
approximately 9 percent of all payrolls in the HMA, compared with 6 percent professional and business services sectors. Amazon.com, Inc. is expected to
for the MSA. Notable employers in the sector include Southwire Company, LLC open two new distribution centers in Gwinnett and Coweta Counties in 2020,
(3,400 jobs, Carroll County), Luxottica Group S.p.A. (2,800 jobs, Henry County), creating 1,000 and 500 new jobs, respectively. By the end of 2020, healthcare
Yamaha Corporation (1,300 jobs, Coweta County), Silver Line Building Products insurer Anthem, Inc. is expected to create 3,000 permanent jobs. Of these
LLC (1,200 jobs, Douglas County), and Takeda Pharmaceutical Company Limited jobs, 1,800 will be at the Anthem Technology Center, a $150-million, 21-story
(900 jobs, Newton County). skyscraper currently under construction in the city of Atlanta.
Comprehensive Housing Market Analysis Atlanta Metropolitan Area Series Focus On: Southern Atlanta Suburbs
U.S. Department of Housing and Urban Development, Office of Policy Development and ResearchAtlanta Metropolitan Area Series Focus On: Southern Atlanta Suburbs Comprehensive Housing Market Analysis as of January 1, 2020 Population and Households 10
Population and Households in-migration. From 2004 through 2008, annual population growth in the HMA
averaged 30,650 people, or 3.0 percent, in the HMA (U.S. Census Bureau
Current Population—Atlanta MSA: 6.06 million population estimates as of July 1). Net in-migration to the HMA averaged
Current Population—Southern Atlanta Suburbs HMA: 1.27 million 20,400 people a year during the period and accounted for 67 percent of total
population growth. By comparison, population growth in the MSA averaged
After averaging only 830 people a year from 2008 to 2013, net 2.6 percent a year from 2004 to 2008. Weak economic conditions in the MSA
in-migration to the HMA has increased considerably since 2013, contributed to significantly slowed net in-migration to the HMA in the late
averaging 12,100 people a year and accounting for 67 percent 2000s and early 2010s. Population growth averaged only 9,200 people, or
of total population growth. 0.8 percent, annually, in the HMA from 2008 to 2013; that growth is less than
the average growth of 1.3 percent a year for the MSA. Net in-migration to the
Population Trends HMA averaged only 830 people annually and accounted for 9 percent of total
The HMA currently accounts for approximately 21 percent of the total population growth during the period. Net in-migration has since accelerated as
population of the MSA, up slightly from 20 percent in 2000, but unchanged economic conditions in the MSA have strengthened, although net in-migration
from 2010. Population growth in the HMA exceeded the rate for the MSA during remains well below the levels of the mid-2000s (Figure 6). Since 2013,
much of the 2000s, with strong job growth contributing to high levels of net population growth in the HMA has averaged an estimated 18,150 people, or 1.5
Figure 6. Components of Population Change in the Southern Atlanta Suburbs HMA, 2000 Through the Forecast
Net Natural Change Net Migration Population Growth
60,000
50,000
40,000
Population Change
30,000
20,000
10,000
0
-10,000
t
nt
6
5
9
4
7
3
8
1
0
2
as
6
9
5
4
7
3
8
1
2
00
00
00
00
00
00
00
00
01
00
01
01
01
01
01
01
01
01
01
re
ec
-2
-2
-2
ur
-2
-2
-2
-2
-2
-2
-2
-2
-2
-2
-2
-2
-2
-2
-2
-2
or
10
00
09
16
06
12
-C
18
02
15
13
08
17
05
14
03
04
07
11
01
-F
20
20
20
19
20
20
20
20
20
20
20
20
20
20
20
20
20
nt
20
20
20
20
rre
Cu
Notes: Net natural change and net migration totals are average annual totals over the time period. The forecast period is from the current date (January 1, 2020), to January 1, 2023.
Sources: U.S. Census Bureau; current to forecast—estimates by the analyst
Comprehensive Housing Market Analysis Atlanta Metropolitan Area Series Focus On: Southern Atlanta Suburbs
U.S. Department of Housing and Urban Development, Office of Policy Development and ResearchAtlanta Metropolitan Area Series Focus On: Southern Atlanta Suburbs Comprehensive Housing Market Analysis as of January 1, 2020 Population and Households 11
percent, annually, while net in-migration has averaged 12,100 people annually. Population by Geography
The population of the MSA has also grown by an estimated average of 1.5 The HMA encompasses 2 of the 10 most populous counties in the state of
percent, annually, since 2013. Georgia. Clayton and Henry Counties were ranked fifth and ninth in population,
Migration Trends with 292,256 and 234,561, respectively, as of 2019 (U.S. Census Bureau
population estimates as of July 1). Since 2010, population growth has averaged
Strong job growth in the MSA has resulted in significant net in-migration from
an estimated 1.3 and 1.5 percent, respectively, each year in the two counties,
outside the state of Georgia to the HMA during much of the past two decades.
which are located along I-75 to the southeast of Atlanta. Recent population
Residents who relocated from outside of the state accounted for approximately
growth in the HMA has been fastest in Coweta County, which is located along
41 percent, or 31,389, of the domestic in-migration to the HMA from 2013 to
I-85 approximately 30 miles southwest of the city of Atlanta. The population
2017; those leaving the state accounted for only 33 percent, or 21,893, of the
of Coweta County grew by an average annual rate of 1.7 percent from 127,937,
domestic out-migration. These influxes contributed to an overall net in-flow
in 2010, to 148,509 in 2019; this rate was the 12th fastest growth rate in the
of residents (U.S. Census Bureau County-to-County Migration Flows). Net in-
state. Population growth within the HMA has generally been slower along the
migration from DeKalb and Fulton Counties, where housing costs are generally
I-20 corridor. The respective populations of Douglas and Carroll Counties,
higher than the HMA, has also been a particularly significant contributor to
which lie to the west of Atlanta along I-20, increased by averages of 1.1 and 0.9
recent population growth. The counties accounted for a combined 18 percent of
percent a year, from 132,573 and 110,728, in 2010, to 146,343 and 119,992 in
net domestic in-migration to the HMA from 2013 to 2017 (Table 5). Conversely,
2019. In Newton and Rockdale Counties, which are located directly southeast
housing costs are generally lower than in the HMA in counties within Georgia
of DeKalb County along I-20, population growth averaged 1.2 and 0.7 percent,
but outside of the MSA; residents from this area accounted for 35 percent of all
respectively, from 2010 to 2019. The respective populations of the two counties
domestic in-migration but 42 percent of all domestic out-migration, resulting in a net
were 111,744 and 90,896, as of 2019, up from 100,133 and 85,354 in 2010. As of
out-flow of residents. People relocating from outside the United States accounted for
2019, the population of Fayette County was 114,421, an average annual increase
approximately 5 percent of all in-migration to the HMA from 2013 to 2017.
of 0.8 percent from 106,938 in 2010.
Table 5. County-to-County Migration Flows
in the Southern Atlanta Suburbs HMA: 2013–2017 Household Growth Trends
Into the Out of the Consistent with population growth trends, the rate of household growth was
Net
HMA HMA faster in the HMA than in the MSA during the 2000s but has slowed since 2010.
DeKalb and Fulton Counties 18,813 16,839 1,974 From 2000 to 2010, the number of households in the HMA expanded from
Remainder of Atlanta MSA* 17,369 16,155 1,214 297,021 to 394,956, an average annual increase of 2.9 percent, compared with
Remainder of Georgia 9,857 11,583 -1,726 the 2.2-percent average annual growth rate for the MSA. As of January 1, 2020,
Remainder of U.S. 31,389 21,893 9,496 the number of households in the HMA is estimated at 445,600, an average
Outside of U.S. 4,111 NA NA annual increase of 1.2 percent since 2010 (Table 6). The number of households
*Atlanta-Sandy Springs-Roswell Metropolitan Statistical Area in the MSA is estimated at 2.24 million as of January 1, 2020, an average
NA = data not available.
Source: U.S. Census Bureau County-to-County Migration Flows increase of 1.5 percent annually since 2010.
Comprehensive Housing Market Analysis Atlanta Metropolitan Area Series Focus On: Southern Atlanta Suburbs
U.S. Department of Housing and Urban Development, Office of Policy Development and ResearchAtlanta Metropolitan Area Series Focus On: Southern Atlanta Suburbs Comprehensive Housing Market Analysis as of January 1, 2020 Population and Households 12
Table 6. Population and Household Quick Facts Table 7. Selected Population and Household Demographics
Southern Atlanta
MSA* HMA* MSA** Nation
Suburbs HMA
(%) (%) (%)
2010 Current Forecast 2010 Current Forecast
Population Population Age 17 and Under 26 25 23
Quick Facts Population 5,286,728 6,062,000 6,297,000 1,125,333 1,270,000 1,325,000
Population Age 65 and Over 12 12 15
Average
Annual Change 102,300 79,450 78,600 27,750 14,850 18,500
Percentage White 48 54 73
Change 2.2% 1.4% 1.3% 2.9% 1.2% 1.4%
Black 43 34 13
Southern Atlanta Asian 3 6 5
MSA* Suburbs HMA
Other Race 6 6 9
2010 Current Forecast 2010 Current Forecast
Household
Quick Facts Households 1,943,885 2,240,000 2,328,000 394,956 445,600 465,200 Hispanic 9 11 18
Average Non-Hispanic 91 89 82
Annual Change 38,400 30,350 29,450 9,800 5,200 6,525
Percentage
Change 2.2% 1.5% 1.3% 2.9% 1.2% 1.4% Households with 1–2 People 55 58 62
*Atlanta-Sandy Springs-Roswell Metropolitan Statistical Area Households with 3+ People 45 42 38
Notes: Average annual changes and percentage changes are based on averages from 2000 to 2010, 2010 to
current, and current to forecast. The forecast period is from the current date (January 1, 2020), to January 1, 2023. *Southern Atlanta Housing Market Area, **Atlanta-Sandy Springs-Roswell Metropolitan Statistical Area
Sources: 2000 and 2010—2000 Census and 2010 Census; current and forecast—estimates by the analyst Source: 2018 American Community Survey, 1-year data
The HMA has a notably larger average household size than that of the MSA as average of $94,476 in the MSA (2018 American Community Survey [ACS] 1-year
a whole. The average household size in the HMA is currently estimated at 2.82, data). By comparison, however, the average home sales price in the HMA,
up from 2.81 in 2010. By comparison, the average household size in the MSA $210,000, was 20 percent lower than the average of $265,700 for the MSA
was 2.68 in 2010 and is currently estimated at 2.67. The difference in average during 2018. Homeownership has declined in both the HMA and the MSA since
household size is due in large part to a relatively high concentration of families 2010, due in large part to high foreclosure rates in the early part of the decade.
in the HMA. As of 2018, 45 percent of households in the HMA included three or As of January 1, 2020, the homeownership rate in the HMA is estimated at 67.3
more people as compared with only 42 percent for the MSA (Table 7). percent, down from 70.2 percent in 2010 and 73.6 percent in 2000 (Figure 7).
The homeownership rate in the MSA is currently estimated at 63.7 percent,
Households by Tenure down from both 66.1 percent in 2010 and 66.8 percent in 2000. By comparison,
Despite relatively low household incomes, the homeownership rate in the HMA the homeownership rate for the nation was 65.1 percent as of the fourth quarter
is higher than the MSA as a whole due to affordable home prices. The average of 2019, down from 66.9 percent during the second quarter of 2010 and 67.2
household income in the HMA was $80,191 in 2018, 16 percent lower than the percent during the second quarter of 2000.
Comprehensive Housing Market Analysis Atlanta Metropolitan Area Series Focus On: Southern Atlanta Suburbs
U.S. Department of Housing and Urban Development, Office of Policy Development and ResearchAtlanta Metropolitan Area Series Focus On: Southern Atlanta Suburbs Comprehensive Housing Market Analysis as of January 1, 2020 Population and Households 13
Figure 7. Households by Tenure and Homeownership Rate
in the Southern Atlanta Suburbs HMA
Owner Renter Homeownership Rate
Forecast
During the forecast period, the rate of population growth in the HMA is
500,000 73.6 75.0 expected to exceed the average since 2010, while the rate for the MSA
declines slightly. Job growth in the MSA is expected to attract net in-migration
Homeownership Rate (%)
400,000 72.0
70.2 to the HMA, particularly from areas outside of Georgia. The population of the
Households
300,000 67.3 69.0 HMA is expected to increase an average of 1.4 percent annually, during the
next 3 years, as compared with average annual growth of 1.3 percent for the
200,000 66.0
MSA. The number of households in the HMA is also expected to increase by
71.0
100,000 70.5 63.0 an average of 1.4 percent annually, slightly higher than the 1.3-percent rate for
the MSA. The homeownership rate in the HMA is expected to decline during
0 60.0
2000 2010 Current the forecast period—but only slightly—to 67.1 percent as economic conditions
remain strong.
Note: The current date is January 1, 2020.
Sources: 2000 and 2010—2000 Census and 2010 Census; current—estimates by the analyst
Comprehensive Housing Market Analysis Atlanta Metropolitan Area Series Focus On: Southern Atlanta Suburbs
U.S. Department of Housing and Urban Development, Office of Policy Development and ResearchAtlanta Metropolitan Area Series Focus On: Southern Atlanta Suburbs Comprehensive Housing Market Analysis as of January 1, 2020 Home Sales Market 14
Home Sales Market Home Sales Trends
Despite rapidly declining numbers of distressed sales in the HMA during the
Market Conditions: Balanced period, new and existing home sales (hereafter, total home sales) have generally
trended upwards since the mid-2010s as economic conditions have strengthened.
Demand for homes in the HMA has generally been greater than
After peaking at 49,450 in 2006, the number of homes sold in the HMA declined
supply since the early 2010s, contributing to the absorption of for-sale
during 6 of the next 8 years to a low of only 26,600 in 2014. The number of home
inventory, declining sales vacancy rates, and rising home prices.
sales subsequently increased during 3 of the next 4 years and totaled 33,250 in
2018. During 2019, total home sales declined 1 percent to 32,850 from a year ago.
Current Conditions
The sales housing market in the Southern Atlanta Suburbs HMA is currently REO Sales
balanced. As of January 1, 2020, the overall sales vacancy rate was estimated Prior to the housing crisis, the number of real estate owned (REO) sales in the
at 1.6 percent (Table 8), down from 3.7 percent in April 2010 and slightly below HMA totaled 2,650 in 2005 and accounted for only 7 percent of existing home
the 1.7-percent rate in April 2000. The inventory of available homes in the HMA sales. Those figures peaked at 12,200 homes and 41 percent of all existing home
in December 2019 was a 3.5-month supply, down from a 3.8-month supply sales in 2009 but have declined during 9 of the 10 years since. During 2019,
during December 2018 and significantly less than the 13.5-month supply during the number of REO sales totaled 2,500, or 9 percent of all existing home sales,
December 2010 (CoreLogic, Inc.). down from 2,975 and 11 percent of existing home sales during 2018 (Figure 8).
Table 8. Home Sales Quick Facts in the HMA*, MSA**, and the Nation Figure 8. 12-Month Sales Totals by Type in the Southern Atlanta Suburbs HMA
HMA* MSA** Nation New Sales Regular Resales REO Sales
Vacancy Rate 1.6% 1.8% NA 45,000
Months of Inventory 3.5 3.4 3.3 40,000
Total Home Sales 32,850 152,600 6,174,000 35,000
Home Sales 1-Year Change -1% 0% 1% 30,000
Quick Facts New Home Sales Price $285,000 $361,700 $413,000 25,000
1-Year Change 5% 4% -1% 20,000
Existing Home Sales Price $186,000 $266,700 $313,200
15,000
1-Year Change 8% 6% 3%
10,000
Mortgage Delinquency Rate 2.2% 1.4% 1.4%
5,000
0
*Southern Atlanta Suburbs Housing Market Area, **Atlanta-Sandy Springs-Roswell Metropolitan Statistical Area
NA = data not available.
De 6
De 5
De 8
9
De 7
0
5
6
8
9
2
4
3
7
1
c-0
c-0
c-0
c-0
c-0
c-1
c-1
c-1
c-1
c-1
c-1
c-1
c-1
c-1
c-1
Notes: Vacancy rates are as of the current date; home sales and prices are for the 12 months ending
De
De
De
De
De
De
De
De
De
De
De
December 2019; and months of inventory and mortgage delinquency data are as of December 2019.
Sources: Vacancy rates: estimates by the analyst; sales and sales prices: Metrostudy, A Hanley Wood REO = real estate owned.
Company; inventory and delinquency rates: CoreLogic, Inc., with adjustments by the analyst Source: Metrostudy, A Hanley Wood Company, with adjustments by the analyst
Comprehensive Housing Market Analysis Atlanta Metropolitan Area Series Focus On: Southern Atlanta Suburbs
U.S. Department of Housing and Urban Development, Office of Policy Development and ResearchAtlanta Metropolitan Area Series Focus On: Southern Atlanta Suburbs Comprehensive Housing Market Analysis as of January 1, 2020 Home Sales Market 15
Seriously Delinquent Mortgages Home Sales Price Trends
The impact of the foreclosure crisis was notably more significant in the The average home sales price in the HMA has increased each year since
HMA than for both the MSA as a whole and the nation. The rate of seriously 2013, following 5 consecutive years of price declines in the late 2000s and
delinquent mortgages and REO properties peaked in the HMA, the MSA, and early 2010s. After reaching a high of $184,400 in 2007, the average home price
the nation in February 2010. In the HMA, the rate peaked at 13.3 percent— in the HMA declined an average of 9 percent, annually, to a low of $117,300 in
higher than both the 8.6-percent peak for the nation and the 10.8-percent 2012. A relatively high share of REO sales, which sold for an average of only
peak in the MSA. The rate has since declined rapidly in the HMA but remains $88,300 in 2012, contributed significantly to the declining average home price
higher than the respective rates for the MSA and the nation (Figure 9). As during the period. The average home price increased an average of 8 percent,
of December 2019, the rate of seriously delinquent mortgages and REO annually, during the subsequent 7 years, surpassing the pre-recession high by
properties in the HMA was 2.2 percent, down from 2.6 percent during 2018. During 2019, the average sales price in the HMA was $201,400, up
December 2018. By comparison, the respective rates for the MSA and the 7 percent from a year ago (Figure 10).
nation both declined from 1.7 percent during December 2018 to 1.4 percent
during December 2019. Figure 10. 12-Month Average Sales Price by Type of Sale
in the Southern Atlanta Suburbs HMA
Figure 9. Percentage of Loans 90 or More Days Delinquent, in Foreclosure,
or Transitioned to REO in the HMA*, MSA**, and the Nation New Sales Existing All Sales
HMA MSA Nation $300,000
15.0
$250,000
12.0
$200,000
9.0
$150,000
6.0
$100,000
3.0 $50,000
0.0 De 5$0
De 6
De 8
De 9
9
De 7
De 0
De 5
De 2
De 6
De 8
9
0
De 3
De 4
5
2
6
8
9
3
4
De 7
7
De 1
1
c-0
c-0
c-0
c-0
c-0
c-1
c-0
c-1
c-1
c-1
c-1
c-1
c-1
c-1
c-1
c-1
c-1
c-1
c-1
c-1
c-1
c-1
c-1
c-1
c-1
c-1
De
De
De
De
De
De
De
De
De
De
De
De
*Southern Atlanta Suburbs Housing Market Area, **Atlanta-Sandy Springs-Roswell Metropolitan Statistical Area Source: Metrostudy, A Hanley Wood Company, with adjustments by the analyst
Source: CoreLogic, Inc.
Comprehensive Housing Market Analysis Atlanta Metropolitan Area Series Focus On: Southern Atlanta Suburbs
U.S. Department of Housing and Urban Development, Office of Policy Development and ResearchAtlanta Metropolitan Area Series Focus On: Southern Atlanta Suburbs Comprehensive Housing Market Analysis as of January 1, 2020 Home Sales Market 16
Home Sales Price Comparisons by Geography foot during 2019, $134, was in Fayette County. Fayette County encompasses
Since the mid-2000s, home prices have been significantly lower in the HMA than several affluent suburbs, including Peachtree City, and has the highest average
the MSA as a whole, particularly in DeKalb and Fulton Counties. During 2019, the household income in the HMA, $115,469. Clayton County had the lowest
average home sales price in the HMA was 28 percent lower than the average average price per square foot in the HMA during 2019, $78, and has the lowest
for the MSA, $280,700, and 41 percent below the average for DeKalb and Fulton average household income, $57,211.
Counties, $342,700. The average size of homes sold in the HMA during 2019 (2,125
square feet) was 3 percent smaller than the average for the MSA (2,200 square
Housing Affordability in the Atlanta MSA—Sales
feet) but 8 percent larger than the average for DeKalb and Fulton Counties (1,975 The affordability of homes in the Atlanta MSA has generally trended downward
square feet). As a result, the difference in price between the HMA and the MSA was since the early 2010s as home price increases have exceeded income growth.
Affordability in the MSA improved, however, during the past year and is about
less pronounced on a per square foot basis, while the difference between the
average when compared to other metropolitan areas in the country. The National
HMA and DeKalb and Fulton Counties was larger. The average price per square
Association of Home Builders’ (NAHB) Housing Opportunity Index (HOI), which
foot was $98 in the HMA in 2019, 26 percent below the average of $132 for the
represents the share of homes sold that would have been affordable to a family
MSA and 43 percent below the average of $172 in DeKalb and Fulton Counties.
earning the local median income, was 72.7 for the MSA during the fourth quarter
Home prices vary significantly within the HMA, however, with per square foot prices of 2019, up from 65.1 during the fourth quarter of 2018 (Figure 12). The HOI
highest along the I-85 corridor (Figure 11). The highest average price per square peaked at 86.1 during the fourth quarter of 2012, when a significant inventory
Figure 11. Home Sales Prices and Household Incomes
in the Southern Atlanta Suburbs HMA Figure 12. Atlanta MSA* Housing Opportunity Index
Price Per Square Foot Average Household Income 90
Average Home Sales Price Per Square Foot
$140 $140,000
$130 $120,000 85
Average Household Income
NAHB Opportunity Index
$120 $100,000
80
$110 $80,000
$100 $60,000 75
$90 $40,000
70
$80 $20,000
$70 $0 65
y
ty
y
ty
ty
y
y
y
nt
nt
nt
nt
nt
un
un
un
u
u
60
u
u
ou
Co
Co
Co
Co
Co
Co
Co
ll C
n
ta
tte
ale
on
y
as
to
nr
ro
we
gl
wt
ye
d
15
16
18
19
12
13
14
17
ay
He
r
ck
u
Ca
Co
Fa
Ne
Cl
Do
Q4
Q4
Q4
Q4
Q4
Q4
Q4
Q4
Ro
Note: New and existing sales include single-family homes, townhomes, and condominium units. *Atlanta-Sandy Springs-Roswell Metropolitan Statistical Area
Sources: Per square foot home prices—Metrostudy, A Hanley Wood Company, with adjustments by the NAHB = National Association of Home Builders. Q4 = fourth quarter.
analyst; 2019, average household income—2014–2018 American Community Survey 5-year data Sources: NAHB/Wells Fargo
Comprehensive Housing Market Analysis Atlanta Metropolitan Area Series Focus On: Southern Atlanta Suburbs
U.S. Department of Housing and Urban Development, Office of Policy Development and ResearchAtlanta Metropolitan Area Series Focus On: Southern Atlanta Suburbs Comprehensive Housing Market Analysis as of January 1, 2020 Home Sales Market 17
of distressed homes suppressed home prices, but it has since declined during from 2000 through 2006. Sales construction activity fell by 45 percent during
6 of the past 7 years as existing inventory has been absorbed. The median home 2007, however, and averaged only 1,375 homes a year from 2008 through 2011.
price in the MSA has increased 90 percent since the fourth quarter of 2012, while Rapid absorption of available existing inventory has subsequently contributed
the median income has increased only 15 percent (NAHB). According to the HOI, to higher levels of new home construction since the early 2010s. Sales
the MSA was more affordable than 118, or just under one-half, of the 238 ranked construction activity increased an average of 30 percent annually, from a low
metropolitan areas in the nation during the fourth quarter of 2019, as compared of 930 homes in 2011 to 5,900 homes in 2018. During 2019, 5,575 homes were
with 139, or 61 percent, of the 226 ranked metropolitan areas during the fourth permitted in the HMA, a 6-percent decline from a year ago (preliminary data
quarter of 2012. and estimates by the analyst).
Sales Construction Activity The increase in development activity since the early 2010s has been generally
consistent with increased demand associated with accelerated population
Sales construction activity in the HMA, as measured by the number of single-
growth and strong economic conditions. From 2012 through 2019, Coweta and
family homes, townhomes, and condominiums permitted, has generally
Henry Counties—which have had the two highest rates of population growth in
trended upwards since 2012. Sales construction activity declined during the
the HMA since 2010—accounted for more than one-half of all sales construction
most recent 12 months and is well below the historically high levels of the
in the HMA. Rockdale County, which has had the slowest population growth rate
early 2000s (Figure 13). An average of 14,450 homes was permitted annually
in the HMA since 2010, accounted for only 5 percent of sales construction from
2012 through 2019.
Figure 13. Average Annual Sales Permitting Activity
in the Southern Atlanta Suburbs HMA Notable new home developments include Twelve Parks, which consists of
694 single-family home sites along Highway 54 in Coweta County. Initial
Single-Family Homes/Townhomes Condominiums
construction at the development began in 2018, and sales recently began with
16,000 prices currently starting in the low $300,000s for three-bedroom homes and
the mid-$300,000s for four-bedroom homes. In Henry County, preliminary
12,000 construction at Bridges at Jodeco, a $400 million mixed-use development
located along I-75, began in late 2019. Phase 1 of the development will include
8,000 300 apartment units, 90 townhomes, and 176 single-family homes as well as
65 acres of retail, dining, and entertainment. This phase is expected to be
complete by late 2020. Initial prices for the sales units have yet to be released.
4,000
Recently, new home sales in the HMA have been concentrated in the $150,000-
to-$349,999 price range (Figure 14).
0
Forecast
00
06
05
08
04
09
02
03
07
01
10
15
16
18
19
12
13
14
17
11
20
20
20
20
20
20
20
20
20
20
20
20
20
20
20
20
20
20
20
20
During the 3-year forecast period, demand is expected for an estimated 17,000
Sources: U.S. Census Bureau, Building Permits Survey; 2000 through 2018—final data and estimates by the new sales units in the HMA, accounting for 24 percent of the estimated demand
analyst; 2019—preliminary data and estimates by the analyst
Comprehensive Housing Market Analysis Atlanta Metropolitan Area Series Focus On: Southern Atlanta Suburbs
U.S. Department of Housing and Urban Development, Office of Policy Development and ResearchAtlanta Metropolitan Area Series Focus On: Southern Atlanta Suburbs Comprehensive Housing Market Analysis as of January 1, 2020 Home Sales Market 18
Figure 14. Share of Sales by Price Range During 2019
in the Southern Atlanta Suburbs HMA
for new homes in the MSA (Table 9). The 2,500 new homes currently under
Existing Sales New Sales construction in the HMA, which represent 18 percent of the homes currently
12,500 under construction in the MSA, will meet some of the forecast demand during
the first year. Demand for new homes in the HMA is expected to increase
10,000 each year of the forecast period, due to greater household growth and strong
7,500 economic conditions.
5,000 Table 9. Demand for New Sales Units During the Forecast Period
2,500 MSA** HMA*
0 Demand 69,900 Units 17,000 Units
$0 to $150,000 to $250,000 to $350,000 to $450,000 to $500,000 and Under Construction 14,200 Units 2,500 Units
$149,999 $249,999 $349,999 $449,999 $549,999 More
*Southern Atlanta Suburbs Housing Market Area, **Atlanta-Sandy Springs-Roswell Metropolitan Statistical Area
Note: New and existing sales include single-family homes, townhomes, and condominium units. Note: The forecast period is from January 1, 2020, to January 1, 2023.
Source: Metrostudy, A Hanley Wood Company, with adjustments by the analyst Source: Estimates by the analyst
Comprehensive Housing Market Analysis Atlanta Metropolitan Area Series Focus On: Southern Atlanta Suburbs
U.S. Department of Housing and Urban Development, Office of Policy Development and ResearchAtlanta Metropolitan Area Series Focus On: Southern Atlanta Suburbs Comprehensive Housing Market Analysis as of January 1, 2020 Rental Market 19
Rental Market Table 10. Rental and Apartment Market Quick Facts
in the Southern Atlanta Suburbs HMA
Market Conditions: Balanced 2010 Current
Rental Vacancy Rate 13.2 6.0
Despite rising levels of rental construction and a significant number
Occupied Rental Units by Structure
of single-family homes being converted to rental units, strong renter Rental Market
Single-Family Attached & Detached 42.4 51.2
household growth has contributed to declining vacancy rates and Quick Facts
Multifamily (2–4 Units) 12.3 10.4
rent growth in the HMA since the mid-2010s.
Multifamily (5+ Units) 39.3 33.2
Rental Market Conditions and Recent Trends Other (Including Mobile Homes) 5.9 5.3
The overall rental market in the Southern Atlanta Suburbs HMA is currently balanced. Current YoY Change
As of January 1, 2020, the overall rental vacancy rate is estimated at 6.0 percent, Apartment Vacancy Rate 5.5% -0.1
down from 13.2 percent in April 2010 (Table 10). Single-family homes, which accounted Carroll County 7.6% 3.4
for only 42.4 percent of occupied rental units in the HMA in 2010, are currently Clayton County 5.4% -0.5
estimated to account for approximately 51.2 percent of all occupied rental units. Coweta County 5.5% -0.7
Apartment Market Conditions Apartment
Douglas County
Fayette County
6.6%
4.2%
-0.3
-0.6
The apartment market in the HMA is also balanced. During December 2019, the Market Henry County 4.7% 0.3
apartment vacancy rate was 5.5 percent, down from 5.6 percent a year ago Quick Facts Newton County 3.5% 0.7
and well below the 11.4-percent rate during December 2010 (RealPage, Inc.,
Rockdale County 5.7% 0.5
with adjustments by the analyst). Apartment vacancy rates declined in four of
Average Rent $1,050 6%
the eight counties in the HMA during the past year. The largest decline, from
6.2 to 5.5 percent, was in Coweta County, where many new apartment units Carroll County $1,025 7%
that entered the market in 2017 have since been absorbed. Newton County, Clayton County $910 5%
where apartment development activity has been relatively scarce since the late Coweta County $1,125 4%
2000s, had the lowest vacancy rate in the HMA during December 2019, at 3.5 Douglas County $1,050 3%
percent; the highest rate, 7.6 percent, was in Carroll County. Fayette County $1,350 16%
Henry County $1,125 6%
Consistent with declining apartment vacancy rates, rent growth in the HMA
Newton County $1,000 7%
has been strong since the mid-2010s. The average apartment rent in the HMA
Rockdale County $1,025 4%
increased an average of 6 percent, annually, from $737 during the fourth
YoY= year-over-year.
quarter of 2013 to $994 during the fourth quarter of 2018. Average apartment Notes: The current date is January 1, 2020. Percentages may not add to 100 due to rounding.
rent increased another 6 percent to $1,050 during the fourth quarter of 2019 Sources: Rental vacancy rates: 2010 Census and estimates by the analyst; units in structure: 2014-2018
American Community Survey, 5-year data; apartment vacancy rates and average rents: December 2019;
(Figure 15). By comparison, the average rent for the nation rose an average of RealPage, Inc., with adjustments by the analyst
Comprehensive Housing Market Analysis Atlanta Metropolitan Area Series Focus On: Southern Atlanta Suburbs
U.S. Department of Housing and Urban Development, Office of Policy Development and ResearchAtlanta Metropolitan Area Series Focus On: Southern Atlanta Suburbs Comprehensive Housing Market Analysis as of January 1, 2020 Rental Market 20
Figure 15. Apartment Rents and Vacancy Rates Figure 16. Average Annual Rental Permitting Activity
in the Southern Atlanta Suburbs HMA in the Southern Atlanta Suburbs HMA
Average Monthly Rent Vacancy Rate 3,500
$1,200 12.0%
3,000
$1,000 10.0%
Average Monthly Rent ($)
2,500
Vacancy Rate (%)
$800 8.0%
2,000
$600 6.0%
1,500
$400 4.0%
1,000
$200 2.0%
500
$0 0.0%
0
0
5
6
8
9
12
14
13
17
11
1
1
1
1
1
20
20
20
20
20
20
20
20
20
20
00
06
05
08
04
09
02
03
07
01
10
15
16
18
19
12
13
14
17
11
4Q
4Q
4Q
4Q
4Q
4Q
4Q
4Q
4Q
4Q
20
20
20
20
20
20
20
20
20
20
20
20
20
20
20
20
20
20
20
20
4Q = fourth quarter. Note: Includes apartments and units intended for rental occupancy.
Source: RealPage, Inc., with adjustments by the analyst Sources: U.S. Census Bureau, Building Permits Survey; 2000–2018 final data and estimates by the analyst;
2019 preliminary data and estimates by the analyst
5 percent a year from the fourth quarter of 2013 to the fourth quarter of 2018 of only 100 units permitted each year from 2009 through 2012, but well below
and increased 4 percent to $1,424 during the fourth quarter of 2019. Average the average of 1,025 units permitted each year from 2003 through 2008.
rents increased throughout the HMA during the past year, with rent growth Developers responded to declining apartment vacancy rates with a significant
exceeding the national rate in five of eight counties. Rents in the HMA are increase in rental construction during the past year. Approximately 2,000 rental
generally correlated with incomes and the ease of access to jobs. During units were permitted in the HMA during 2019, more than triple the 620 units
December 2019, both the highest rent, $1,350, and the fastest rent growth, 16 during 2018 (preliminary data and estimates by the analyst), and the highest
percent, were in Fayette County. The lowest average rent, $910, was in Clayton total for a single year since 3,250 units were permitted in 2002.
County, and the lowest rate of rent growth, 3 percent, was in Douglas County.
Recent rental construction has become increasingly concentrated along the
Rental Construction Activity I-85 corridor to the southwest of downtown Atlanta. Coweta and Fayette
Recent rental construction activity in the HMA, as measured by the number of Counties have accounted for approximately 67 percent of the rental units
rental units permitted, has been at notably higher levels than during the late permitted in the HMA since 2013, up from 11 percent from 2000 through 2008
2000s and early 2010s (Figure 16). An average of 380 units was permitted and only 3 percent from 2009 through 2012 (Figure 17). By comparison, Clayton
each year from 2013 through 2018. That figure is more than triple the average and Henry Counties accounted for approximately 54 percent of all rental units
Comprehensive Housing Market Analysis Atlanta Metropolitan Area Series Focus On: Southern Atlanta Suburbs
U.S. Department of Housing and Urban Development, Office of Policy Development and ResearchYou can also read