Tauranga City Population and Dwelling Projection Review 2020 (Growth Allocations 2018-2118) - City and Infrastructure Planning Tauranga City Council
←
→
Page content transcription
If your browser does not render page correctly, please read the page content below
Tauranga City Population and Dwelling
       Projection Review 2020
   (Growth Allocations 2018-2118)

        City and Infrastructure Planning
            Tauranga City Council
                      July 2020
                                           Objective ID: A11654252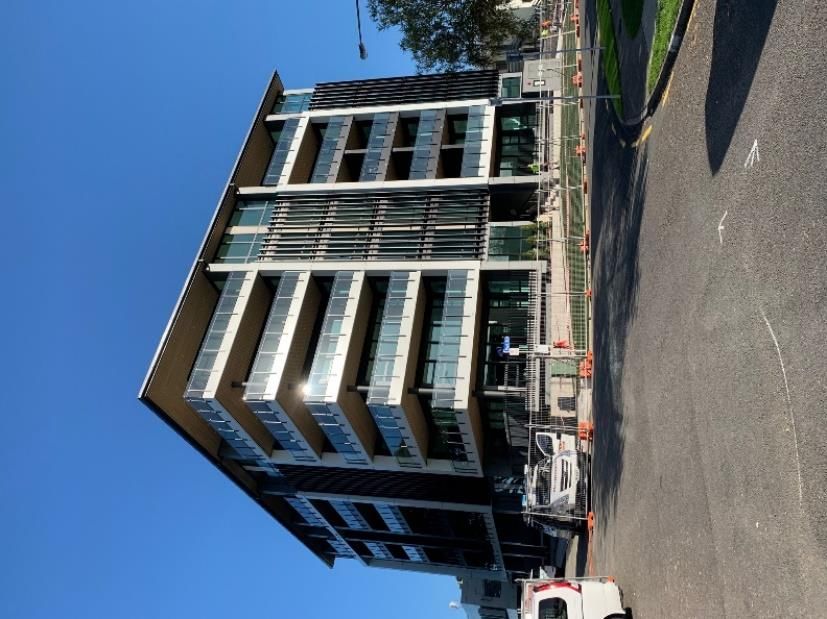
1   Introduction .......................................................................................................... 2

2   Background .......................................................................................................... 2

3   Methodology and Allocation Assumptions ........................................................ 2
            Population and Dwellings Projections ................................................ 2
            Allocation Considerations................................................................... 3
            Allocation Levels ................................................................................ 4
            Projection Periods .............................................................................. 4
            Urban Form Transport Initiative(UFTI) ............................................... 4
            Area Growth Type .............................................................................. 5
            Housing Typology............................................................................... 6
            Indicative Meshblocks ........................................................................ 6
            Population Divisors............................................................................. 7
            NPS on Urban Development Capacity............................................... 7
            Special Housing Areas (SHA’s) ......................................................... 7

4   Revised Projection Allocations ........................................................................... 8
            General Overview............................................................................... 8
            Sub-unit Allocation ........................................................................... 10

5   Monitoring .......................................................................................................... 12

6   Conclusions ....................................................................................................... 13

7   Appendices ........................................................................................................ 13

                                                          Page 1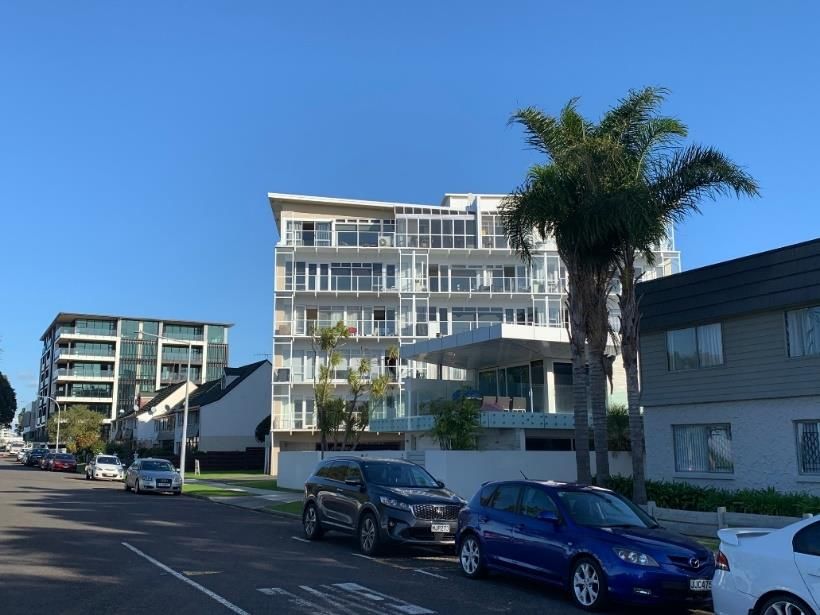
1            Introduction
This Review (the 2020 Review), supersedes the “Tauranga City Population and Household Projection Review 2018”
(The 2018 Review). The 2020 Review provides an overview of the methodology and key assumptions that underlie
the allocation of revised population and dwelling projections across Tauranga City. The allocation will be used as
base assumptions for a range of infrastructure modelling and planning projects including traffic and waters
modelling, development contributions and the Long Term Plan 2021-2031 (the LTP).

2            Background
Population and household projections were produced by the National Institute of Demographic and Economic
Analysis (NIDEA) for SmartGrowth and the Bay of Plenty Regional Council in 2014. The NIDEA population and
dwelling projections for the Western BOP subregion were reviewed in late 2019 following the release of 2018
Census results1. The growth projections were adjusted to align with 2018 population and dwelling counts and higher
people per dwelling and a lower proportion of unoccupied dwellings than previously assumed.

With the onset of COVID 19, Tauranga City revisited and revised the projections downward to acknowledge
significant expected impacts particularly on migration, a key component of Tauranga City’s population growth, and
construction. Recent consenting levels and those experienced through the GFC were also assessed to inform the
review of the growth projections, alongside other demographic and economic indicators.

The COVID-19 projections (the revised projections) assume two years of low population and dwelling growth
followed by three years of more moderate (but below projected) growth. This results in a reduction over a five-year
period (1 July 2020 to 30 June 2025) of 2,100 dwellings and 4,700 people from projected. It is assumed that this
reduction will be offset by higher than projected growth over the 2026-2031 period to be back at projected levels by
2031.

The revised projections are considered a pragmatic response to ensure the growth projections remain fit for
purpose. It is acknowledged that COVID 19 is a developing situation and the revised projections can be further
refined if necessary, prior to adopting the LTP as more information comes to hand. The growth projections will
continue to be monitored and adjusted through future annual plans and LTP processes as appropriate.

3            Methodology and Allocation Assumptions

             Population and Dwellings Projections
As outlined in in section 2 above, revised projections have been prepared for the City and wider Subregion. The 5-
yearly projection to 2063 is provided at City level (Table 1) and annually to 2031 for LTP purposes (Table 2).
Population projections for the Western BOP Subregion, including the longer term UFTI population projection is also
provided (Table 3).

For the revised population projections the 2018 Census based Statistics NZ 30 June 2018 Estimated Resident
Population (ERP) of 140,800 was adopted. Statistics New Zealand consider the June 2018 estimate to be more
accurate than the March 2018 Census count as it makes adjustments for net census undercount and residents
temporarily overseas.

For dwellings, the 30 June 2018 dwelling projection base was calculated by reviewing dwelling consent and code
of compliance issue over the March to 30 June period and making appropriate adjustments to increase the Census
“occupied dwelling” and “total dwelling” base. (see Table 2).

1
    Note; Western BOP District projection allocations are attached (see Appendix 8)

                                                             Page 2
Table 1: Five Yearly Population and Household Projections, 2018 – 2063, Tauranga City.

                                Year                 Resident            Occupied
                                                                                             Total Dwellings
                            (at 30 June)            Population           Dwellings2

                                2018                 140,800                51,144                 56,072
                                2023                 150,627                55,306                 60,608
                                2028                 165,131                60,751                 66,544
                                2033                 179,364                67,144                 73,512
                                2038                 189,229                71,542                 78,305
                                2043                 196,573                74,739                 81,790
                                2048                 201,973                77,095                 84,358
                                2053                 205,903                78,910                 86,336
                                2058                 210,049                80,901                 88,507
                                2063                 213,653                82,701                 90,469

            Table 2: Annual Population Increase for Long Term Plan 2021-2031, Tauranga City (as at 30 June).

                                                                Resident
                                             Year                                    % Increase
                                                               Population
                                             2018               140,800
                                             2019               143,625                 2.01%
                                             2020               146,103                 1.73%
                                             2021               147,434                 0.91%
                                             2022               148,764                 0.90%
                                             2023               150,627                 1.25%
                                             2024               152,568                 1.29%
                                             2025               154,926                 1.55%
                                             2026               157,700                 1.79%
                                             2027               161,415                 2.36%
                                             2028               165,131                 2.30%
                                             2029               168,354                 1.95%
                                             2030               171,577                 1.91%
                                             2031               174,800                 1.88%

                      Table 3: Western Bay of Plenty Sub-Region Projected Population Allocation (as at 30 June).

                                                                          Resident Population
                   Year                                 TCC                               WBOPDC                    Sub-Region
                                           Projection         Subregion %       Projection      Subregion %
                   2018                     140,800              73%             52,900            27%                193,700
                   2048                    201,973                75%             66,750            25%               268,723
                   2063                    213,653                76%             67,400            24%               281,053
                   2118                    283,000                71%            117,000            29%               400,000

            Allocation Considerations
To inform the allocation of the revised projections a range of information was considered including:

    ▪   March 2018 Census population and dwelling counts, and change over time from previous censuses;
    ▪   Significant consented and proposed developments (e.g.: The Farmers redevelopment) to June 2020.
    ▪   Reports of relevance including SmartGrowth Development Trends (2019), Housing and Business Capacity
        Assessment 2018 (NPS-UDC), and the draft Future Development Strategy (FDS) – both completed as part of

2
 This is consistent with NIDEA who state that “the number of households in private dwellings maybe taken as equivalent to the number of
occupied dwellings” in footnote 7, page 58 of its report

                                                                 Page 3
the WBOP subregion requirements under the National Policy Statement on Urban Development Capacity
        (NPS-UDC)
    ▪   Urban Form and Transport Initiative (UFTI) programme planning and reporting.
    ▪   Special Housing Areas approved under the former HASHA legislation.
    ▪   Dwelling consent issue from March 2018 Census to June 2020.
    ▪   Remaining capacity based on current zoning provisions.
    ▪   Latest Statistics NZ population estimates.
    ▪   Residential intensification work, including Te Papa programme planning, and wider changes to the City Plan
        provisions currently being progressed.

            Allocation Levels
In this Review (as with the 2018 Review), Tauranga City projected growth was allocated to Growth Management
Areas (GMA’s), GMA Sub-units, Census Area Units and at Meshblock level (see Table 1).

            Table 1: Allocation Levels for Revised Projections
               Growth Management Area               Subunits            Census Area Units            Meshblocks
             Mount Maunganui                           6                       5                        185
             Papamoa                                   7                       7                        199
             Tauranga Central                         16                       9                        268
             Tauranga South                           17                       7                        132
             Tauranga West                            13                       9                        271
                                                      44                       35                      1,042

While it was intended that 2018 Census geographies would be used in this review, 2018 meshblock data is not yet
available; currently scheduled for release in August 2020. When the 2018 meshblock dataset is released the
projections will be rebased to 2018 Statistical areas (2018 meshblocks, Statistical Area 1 (SA1), and Statistical Area
2 (SA2)) while GMA and subunits areas will be retained. This may result in changes to 2018 base numbers in some
areas though the bottom-line population of 140,800 people will not change.

            Projection Periods
The allocation is provided in 5 yearly increments aligned to Census from 2018 to 2063. In addition, a 2021 and
2031 year horizon for LTP planning purposes, and a longer term projection, up to 100 years, is provided

LTP Allocation: As the 2021-2031 LTP does not align with Census years a separate 2021 and 2031 allocation is
provided in separate columns in the CAU table (Appendix 6) and at meshblock level in the “Final July 2020 Pop
Dwell Review Output Tables” excel workbook (the excel workbook) 3. to enable this growth to be split out. Annual
population and dwelling change at City level over the LTP period is also provided (see Table 2).

100 Year Allocation: A long term, up to “100 year allocation”, is provided as one “2118” horizon. This approach
was adopted by UFTI to enable longer term planning out to 100 years. Given the long term nature of this allocation
there is a high level of uncertainty with its reliability and accuracy. It can be considered an ultimate allocation, with
allocation to identified potential greenfield areas, along with higher intensification as specified by UFTI. This
allocation is provided as a single indicative “2118” year horizon though it is noted that uptake of this potential yield
across the city, and in specific areas, could occur before 2118. The benefit of this approach is that it allows areas
to be modelled that may be required sooner than currently allocated, and it recognises the long-term nature of
infrastructure planning and provision.

            Urban Form Transport Initiative (UFTI)
The Urban Form and Transport Initiative (UFTI) is a collaborative project led by SmartGrowth and the NZ Transport
Agency and involves Western Bay of Plenty District Council, Tauranga City Council, the Bay of Plenty Regional
Council, iwi, and community leaders. The key aim of the project was to develop a refreshed, coordinated and
aligned approach to key issues across the sub-region – such as housing, transport and urban development. UFTI
is focussed on supporting liveable community outcomes – finding answers for housing capacity, intensification,
multi-modal transport (such as public transport and cycleways) and network capacity.

3
  A separate Excel Workbook is available that provides allocations down to meshblock level from 2018 to 2063 in 5 yearly
increments, at 2118 and at 2021 and 2031 horizon years - “Final July 2020 Pop Dwell Review Output Tables” Obj Ref:
A11636408. The review appendices only allocate projected growth to 2048 in recognition of the higher level of uncertainty
with both the growth projection and its allocation beyond 2048.

                                                          Page 4
This review allocates growth to the UFTI 30 year and longer-term preferred option, the Connected Centres
programme4. While the 2020 review aligns the allocation of Tauranga City projected dwelling and population growth
with the UFTI growth allocation it is acknowledged that there are a range of other areas, both Greenfield and
intensification, that need further consideration for future long-term planning. These areas include Pukemapu,
Neewood and Kaitemako South areas identified as part of work completed for the urban limits line in 20055, along
with other areas identified more recently in Welcome Bay and Ohauiti rural land study. This need to consider other
areas is also acknowledged by UFTI with several areas identified in the UFTI report in its table of “potential additional
development opportunities” (Appendix 9). Residential growth has not been allocated to these areas in this Review.
Area Growth Type
At Sub-unit and MB level, areas were defined by growth type (see Appendices 2 & 4). This classification allows the
different growth area types to be identified and monitored. Each meshblock was classified as either:
▪ High Density Area
▪ Intensification Area
▪ Infill/ Intensification
▪ Rural Infill
▪ Greenfield Urban Growth Area
▪ Future Greenfield Urban Growth Area
▪ Potential Future Greenfield Urban Growth Area
High Density Areas: Areas which have City Plan zoning that enables intensification to occur. Three high density
areas are identified; Mount Maunganui North, City Living Zone and City Centre Zone.
Intensification Areas: Areas which have been spatially defined as established parts of the City potentially most
likely to be suitable for residential intensification. Three intensification areas are identified in this Review; Mount
Maunganui, Te Papa and Tauranga West intensification areas. These three areas are defined on the maps (see
Appendices 2 & 4). Potential for up zoning to enable and encourage residential intensification in these areas is
currently being evaluated to be progressed through City Plan changes where appropriate.
Infill/ Intensification areas Established parts of the City outside the three identified intensification areas. These
areas include the non Greenfield UGA parts of Welcome Bay and Hairini, Te Maunga, Poike and Maungatapu.
Rural Infill: Areas of the City with Rural zoning outside the Greenfield UGA’s. Matapihi and Kairua and parts of
Kaitemako and Welcome Bay East subunits are identified as Rural Infill. As large portions of these areas are in
Multiple Maori ownership it is expected that papakainga housing may locate there.
Greenfield Urban Growth Areas: These are the operative Greenfield UGA’s currently under development. They
include Bethlehem, Pyes Pa East, Ohauiti, Welcome Bay and Papamoa Greenfield UGA’s released for development
in the 1990’s, and Wairakei, Bethlehem West and Pyes Pa West released post 2000.
Future Urban Growth Areas: These are potential Greenfield UGA’s that have been endorsed by SmartGrowth
for future residential development. These areas are Tauriko West and Keenan Road to the west of the City, and
Te Tumu in Papamoa East.
Potential Future Urban Growth Areas: These areas are those confirmed through UFTI as within its preferred
programme. It includes Merrick Road, Upper Joyce and Upper Belk areas in the western corridor, and Domain
Road South in Papamoa/ Kairua area. As these potential future UGA’s have not yet been endorsed by SmartGrowth
to be progressed they remain indicative. Residential growth has been allocated to these areas post 2063 in this
Review.
Also included in this category is “Ohauiti South”, a smaller potential Greenfield UGA within the current Tauranga
City boundary. It is anticipated that this area will be developed pre 2048.
4
UFTI Connected Centres Programme, Dwelling Allocations and Potential Additional Development Opportunities for the
Western BOP Sub Region are provided (see Appendix 9). For more detailed information see the Urban Form and Transport
Initiative (UFTI) Final Report, UFTI, July 2020 (www.ufti.org.nz).
While the allocation of projected growth in this review is generally consistent with UFTI, the expected dwelling yield at Te
Tumu has been reduced by 1,700 dwellings as a result of more refined structure planning. The 1,700 dwelling reduction has
been reallocated to Ohauiti South Potential Future Greenfield Area (+700 dwellings) pre 2048, and to Western Corridor
Potential Future Greenfield areas (+1,000 dwellings) post 2063.
5
See “SmartGrowth Implementation, Possible Urban Areas Assessment to Establish Urban Limits Line, February 2005”
Page 5Housing Typology
While spatial areas have been classified based on general growth type in section 3.4 above, it is noted that this
does not define housing typology.
3.7.1 Intensification
Residential intensification relates to the comprehensive redevelopment of a property that invariably involves the
demolition or removal of the existing dwellings. Intensification is characterised by higher densities than residential infill
and housing typologies such as duplexes, townhouses, terraced housing and apartments. Dwelling units are typically
attached to each other in a single, often multi-level building. Residential intensification may often require the
amalgamation of neighbouring properties into one development block to provide sufficient site area to accommodate
this form of comprehensive development.
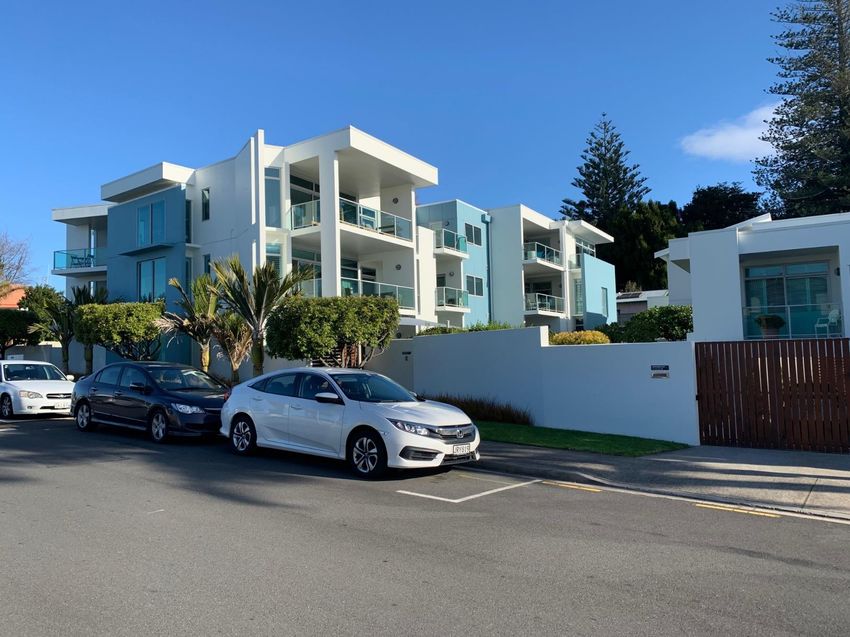
It is noted that housing typologies associated with intensification are not limited to high density and
infill/intensification areas. Attached dwellings and apartment developments are already occurring in Greenfield
areas and these types of developments are expected to increase. Apartments and attached dwellings are planned
for Wairakei, particularly within and around the town centre, along with medium to higher density developments
assumed in Tauriko West and Te Tumu future Greenfield UGA’s. Duplexes have been constructed, and more have
been consented, within Wairakei and Pyes Pa West UGA’s.
Multi-unit developments are already enabled within the City’s commercial business zone and this opportunity has
been taken up in a number of areas outside the defined high density areas including Owens Place, Parton Road
and Judea. In addition, multi-unit developments have been approved in Suburban Residential zoned areas such
as Bureta, Greerton, Gate Pa, Te Reti and Bethlehem and this uptake is expected to increase as City Plan changes
to enable and encourage greater levels of residential intensification are progressed. Retirement villages across the
city are comprised of a range of housing typologies and associated densities.
3.7.2 Infill
Residential infill in Tauranga City refers to a situation where an existing property is subdivided into two (or more)
lots to a minimum density in accordance with the provisions of the Operative Tauranga City Plan. Generally, the
existing house on the property is retained and a new house built on the new lot that is created. This form of
development is characterised by small allotments (often less than 400m2) with detached houses.
Infill development is expected to continue to a limited extent in the older established parts of the City, including
along the coastal strip to Papamoa in the east. In greenfield areas covenants generally preclude further subdivision
of lots within residential subdivisions.
3.7.3 Greenfield Development
Greenfield development generally refers to development of the existing and future UGA’s on the periphery of the
City. This type of development has generally been characterised by residential subdivision for standalone dwellings.
Within these areas retirement villages in particular have increased density through more intense multi unit housing
typologies. As discussed above future greenfield development is expected to provide for much greater residential
density to make more efficient use of land resource.
Greenfield type development has also accommodated housing growth within the established parts of the City; Urban
Ridge and Cheese Factory Lane developments in Brookfield and Sereno Vista in Bellevue are recent examples of
this type of development. While additional opportunity remains in the City for this type of development it is
anticipated that changes to the City Plan being progressed will lead to this opportunity being more densely
developed. Terraced housing recently consented on Westmorland Drive in Bethlehem, and within the Cheese
Factory Lane development indicate that the market is responding to this demand.
Indicative Meshblocks
As Statistics NZ does not generally split large meshblocks until a population threshold is reached, finer grain
modelling based on meshblock boundaries is restricted in Greenfield UGA’s, and accurately splitting out structure
plan areas (SP areas) is sometimes difficult. To overcome this a number of indicative meshblocks have been
created in this Review in Greenfield UGA’s by splitting large ‘parent’ meshblocks to form a number of smaller
Page 6meshblocks6. The ‘parent’ meshblock number has been retained with an alpha (“A”, “B”, “C” etc) added to allow
the smaller indicative meshblocks to be combined to form the ‘parent’ meshblock if required.
Indicative meshblocks enable the Bethlehem West, Bethlehem South, Carmichael (West) Bethlehem, Bethlehem
North West, Domain Road South, Welcome Bay/ Kaitemako, and Wairakei/ Marjorie Lane/ Parton Road SP areas
to be defined. Several Western Bay of Plenty District meshblocks have also been included to the south of Tauranga
City, and split to define potential future urban growth areas to the south of the City.
Population Divisors
Generally, the number of people per household is assumed to decline over the projection period, as population
ages, and correspondingly the proportion of single occupancy and couple households increases. Currently the
average number of people per occupied dwelling is projected to decrease from 2.72 at 2018 to 2.58 by 2063 (for
resident population/ total dwellings from 2.48 to 2.36 respectively).
There are several options when generating population from dwelling projections, each with their own strengths and
weaknesses. These include:
• Apply “total city population”/ “total city occupied dwellings” divisor to cumulative growth in each area. The
weakness of applying the city wide total divisor across the city results in significant, immediate and unrealistic
change in population in different parts of the city.
• Apply city wide “projected additional population”/ “projected additional dwellings” divisor to projected additional
dwellings. This provides for more gradual change however the weakness with this approach is that the
projected divisor is lower than the total city population/ occupied dwelling divisor which results in population
assigned to new and future areas being lower than would be expected.
• Manually apply different divisors across the City while ensuring the “bottom line” dwelling and population
projection is maintained. While this approach may allow greater population to be assigned to new areas and
future growth areas, resulting in a more realistic and expected outcome, it is labour intensive to produce and
maintain particularly where any necessary interim change(s) to dwelling yield of an area, may cause
populations across the city to change as divisors are adjusted.
In this Review the “projected additional population”/ “projected additional dwellings” divisor has been applied. A
calculation has been prepared to show the difference between applying the “total” and “additional” divisor at subunit
level (see Appendix 5). Where population is important the results can be used to provide a “range” of population
for a specific area. A separate calculation at meshblock level using the projected total population/ total dwellings
divisor has been provided in the Excel workbook7.
NPS on Urban Development Capacity
The National Policy Statement on Urban Development Capacity (the NPS-UDC) came into effect on 1 December
2016. It will be superseded by the NPS on Urban Development (NPS-UD) on 20 August 2020. The NPS-UDC
(and NPS-UD) direct local authorities to provide sufficient capacity in their resource management plans for housing
and business growth to meet demand.
Under the NPS Tauranga City is classified as a High-Growth Urban Area and is required to produce a “housing and
business development capacity assessment” and a “future development strategy” on a three yearly cycle. The first
Housing and Business Capacity Assessment (HBCA) has been completed8 and a draft Future Development
Strategy (FDS) was produced. The 2020 Review and subsequent reviews will inform the development of these
NPS requirements including the next HBCA due for completion in mid 2021.
Special Housing Areas (SHA’s)
Special housing areas were established in Tauranga between 2013 and 2019, to increase the supply of land for
housing through an accelerated resource consenting process. These special housing areas (SHA’s) were set up
under the Tauranga Housing Accord, an agreement between Council and the government to address housing
issues in the city. The Tauranga Housing Accord expired in September 2019, when the Government repealed the
legislation that enabled the establishment of SHAs.
6
Where indicative meshblocks have been created the meshblock “number” is coloured red in Appendix 3 Meshblock map.
7
see “Total Pop Dwell Divisor Results” tab “Final July 2020 Pop Dwell Review Output Tables” Obj Ref: A11636408
8
SmartGrowth NPS-UDC Housing and Business Capacity Assessment 2017, SmartGrowth and Proposed Future
Development Strategy 2018 – both available on SmartGrowth website www.smartgrowthbop.org.nz
Page 7The current status of each SHA and expected yield is as follows:
• Girven Road SHA, Arataki – under construction – 66 dwellings
• Smiths Farm SHA, Bethlehem – consented – 216 dwellings
• Adler Drive SHA, Ohauiti – under construction – 180 dwellings
• Waihi Road SHA, Judea. – completed – 31 dwellings
• Domain Road SHA, Papamoa. – consented – 36 dwellings
• Papamoa East SHA’s –Zariba, Nga Potiki, Hawridge Developments, Palm Springs and Golden Sands –
under development – 2341 dwellings
• Papamoa East SHA’s – Papamoa Junction – Did not proceed
• Chadwick Road SHA – Did not proceed
• Golden Sands (southern extension (Wairakei)) SHA, Papamoa. – under construction – 273 dwellings
• Emerald Shores Drive, Papamoa – consented – 77 dwellings
Together the approved SHA’s provided capacity for an additional 3,200 dwellings. Projected growth allocated to
these SHA’s has been reviewed and adjusted where necessary.
4 Revised Projection Allocations
A general overview of allocated growth, followed by an explanation of allocation consideration at sub unit level, is
provided below. It is noted that the general overview and allocations at sub unit, CAU and meshblock level
appended to the report are for the 2018 to 2048 period. This is in recognition of the higher level of uncertainty with
both projected and allocated growth beyond 2048. Longer term allocations are provided in the excel workbook if
required.
General Overview
Figures 1 and 2 outline the additional dwelling allocation by area growth type, in the 2018 to 2048 planning period,
and change over time. Figure 2 in particular shows the assumed increase in the intensification over the 30 year
planning period. While capacity is neared in the current Greenfield areas by 2033, release and uptake in Te Tumu,
Tauriko West, Ohauiti South and Keenan road provides additional Greenfield yield over the projection period.
Figure 3 compares total dwellings by area at 2018 with 2048. While intensification accommodates significant growth
over the 30 year period, the percentage of growth accommodated within the established infill/ intensification areas
of the City falls, from 61 percent in 2018 to 53 percent by 2048. Future Greenfield areas are expected to
accommodate 11 percent of projected dwelling growth over this period.
Figure 1: Additional Dwelling Growth by Area, Tauranga City, 2018 to 2048
Page 8Figure 2: Additional Dwellings, Area Type Change over 2018-2048 planning period, Tauranga City.
Figure 3: Comparison of Total dwellings by Area Type at 2018 and 2048, Tauranga City.
Page 9Sub-unit Allocation
An explanation of the key considerations behind the allocation of projected growth across the City at sub unit level
is provided in the following tables. The growth allocation table to 2048 and map is attached (Appendices 1 and 2).
4.2.1 Papamoa
Growth Type Key Assumptions
High Density No High Density Areas assumed.
Intensification Area (IA) Not within defined Intensification Area
Limited infill and redevelopment of sites assumed, mainly in older established areas near the coast,
increasing over the 50 year projection period as housing stock ages, land value increases, and
Infill/ Intensification
planning provisions encourage greater intensification. Apartments on corner of Papamoa Beach Road
outside IA
and Domain Road (Domain Road SHA), and apartments in the Parton Road Commercial area
assumed.
Rural Infill Continued limited rural subdivision/ partitions and papakainga housing expected in Kairua.
• Maranui Street Greenfield Structure Plan Area (SP area) - Significant uptake of Coast
development, Oceania Sands, Pacific Park, Mangatawa block retirement village, and James
Block. Release of remaining Mangatawa land in the medium to longer term. Development of
remaining vacant sites in established parts of subunit also expected, including large vacant site
on Grenada Street.
• Domain Road SP Area - Continued uptake of Sandspit Way subdivision adjacent shopping
centre. Uptake of remaining large vacant sites such as at end of Percy Road and off Bermuda
Drive.
• Parton Road SP Area - uptake of remaining Johnston land off eastern end of Doncaster Drive,
and redevelopment of larger sites adjacent Papamoa College and on corner of Tara and Parton
Greenfield
roads. Development of existing and recently zoned Rural Residential zoned land off Tara Road.
Development of Office of Treaty Settlement land near Enterprise Drive. Uptake of remaining
capacity of Vision Retirement Village. Uptake of apartments and other residential developments
consented in commercial zoned areas.
• Marjori Lane SP area - Uptake of large blocks of remaining vacant land such as adjacent Emerald
Shores Drive (including Emerald Drive SHA) and Excelsa Place. Uptake of remaining vacant
sections such as along Spinifex Street and Pebble Beach Way. Uptake of Nga Potiki SHA and
balance land north of Wairakei Stream.
• Wairakei SP area - Significant uptake expected. Assumed construction of Te Okura Drive as per
works programme. A number of SHA’s approved and under development in this area.
Page 10Future Greenfield • Te Tumu future greenfield area in Papamoa East assumed to be released in 2023-2028 period.
Potential Future • Domain Road South potential future greenfield area assumed to be released post 2063, and
Greenfield included in “2118” allocation.
4.2.2 Mount Maunganui
Growth Type Key Assumptions
Redevelopment of a number of key sites in High Density zone. Some mixed use development expected
High Density
in the commercial zoned areas. Within wider Mount Maunganui intensification area.
Mount Maunganui Intensification Area - Redevelopment of sites expected to maximise site potential,
Intensification Area increasing over the projection period as housing stock ages, land value increases, and planning
(IA) provisions enable and encourage greater intensification though wide areas constrained by identified
hazards. Completion of Girven Road SHA in short term.
Infill/ Intensification Limited infill development in part of Te Maunga outside Mount Maunganui Intensification area.
outside IA
Rural Infill Limited rural subdivisions/ partitions in Matapihi, particularly through papakainga housing.
No Greenfield SP areas assumed in Mount Maunganui GMA. Te Maunga CAU Greenfield meshblocks
Greenfield
included in Papamoa GMA (ie: Maranui Street SP area).
4.2.3 Tauranga Central
Growth Type Key Assumptions
Residential intensification development anticipated in the City Living Zone and City Centre Zone high
High Density density areas. Within wider Te Papa intensification area. Completion of Farmers redevelopment and
Latitude apartments in short term and a number of other apartment proposals in medium term.
Te Papa Intensification area - Redevelopment of sites expected to maximise site potential, increasing
over the projection period as housing stock ages, land value increases, and planning provisions enable
Intensification Area and encourage greater intensification. A number of proposed developments assumed to be realised.
(IA) Further development of vacant blocks off Tom Muir Drive adjacent Sunvale Place, and at the end of
Bongard Street. Development of large vacant site adjacent Greenpark school expected, and several
other opportunities including a significant opportunity for redevelopment at Tauranga Racecourse.
Infill/ Intensification Further uptake in Poike area expected including the Sanctuary Point development in short to medium
outside IA term.
Rural Infill No Rural subdivision/ partitions identified.
• Pyes Pa SP area - Continued uptake of vacant land blocks throughout period including at
Waterside Drive, Annandale and Condor Drive subdivisions. A few remaining larger sites
assumed to be released in medium term. Higher density realised than assumed in the design
Greenfield capacity due mainly to retirement home development, with estimated remaining capacity yield
increased as a result.
• Pyes Pa West SP area - Continued uptake of staged development and vacant land blocks
assumed. Less yield to be realised than originally estimated through structure planning.
Future Greenfield • Tauriko West, and Keenan Road future greenfield areas in western corridor assumed.
Potential Future • Merrick Road, Upper Joyce and Upper Belk potential future greenfield areas assumed to be
Greenfield released post 2063 and included in “2118” allocation.
4.2.4 Tauranga South
Growth Type Key Assumptions
High Density No High Density Areas assumed.
Intensification Area (IA) Not within defined Intensification Area.
Limited redevelopment of some sites expected to maximise site potential increasing over the projection
Infill/ Intensification period as housing stock ages, land value increases, and planning provisions encourage greater
outside IA intensification. Continued infill development, particularly of multiply owned Maori land on western side
of Kaitemako Road in longer term.
Limited Rural subdivision/ partitions anticipated in parts of Welcome Bay East subunit. Rural land study
Rural Infill
may confirm additional suitable areas but not allocated in this Review.
Page 11• Ohauiti SP area - Continued uptake of vacant land blocks including land off McFetridge Lane, and
block on corner of Poike Road and Hollister Lane. Significant uptake of vacant sections in
Rowesdale subdivision and Adler Drive SHA.
Greenfield • Welcome Bay SP area - Continued uptake of vacant land blocks including land at end of Kestrel
Avenue assumed. Yield remaining at Ballintoy Park, Oteki Park Drive and Utopia Park subdivisions,
while some yield remains at Riverstone Park subdivision. Development assumed to continue in
these subdivisions.
Future Greenfield • Potential future greenfield areas assumed – Ohauiti South
4.2.5 Tauranga West
Growth Type Key Assumptions
High Density No High Density Areas Assumed.
Tauranga West Intensification Area - Redevelopment of sites expected to maximise site potential,
increasing over the projection period as housing stock ages, land value increases, and planning
Intensification Area
provisions enable and encourage greater intensification though uptake constrained in areas subject to
(IA)
hazard, particularly low-lying areas. A number of large vacant sites to be developed including land
adjacent to Bureta Countdown, and 189 Ngatai Road site.
Infill/ Intensification All established infill areas within Tauranga West Intensification area.
outside IA
Rural Infill No Rural subdivision/ partitions identified
• Bethlehem Triangle SP area – Limited development of remaining sections north of Pembroke
Drive, and sections off St Andrews Drive, Moffat Road, and Castlewold Drive. Development of
large blocks off Beaumaris Boulevard and Cambridge Road.
• Bethlehem South SP area - Continued uptake of remaining capacity. Smiths Farm SHA released
in medium term.
• Bethlehem West SP area - Continued uptake of remaining capacity. Uptake of Vines retirement
village continues in short term.
• Carmichael (Bethlehem) West SP area - Further limited development of retirement village on
corner of Carmichael Road and Te Paeroa Road, and apartment development on Te Paeroa
Road. Development of large block accessed from Te Kumeroa Road assumed. Limited uptake of
Greenfield
large Land House block south of State Highway 2 in medium to long term. Limited development
of multiply owned Maori land within Marae Zones assumed in longer term.
• Bethlehem North East SP area - Further development of Bethlehem Country Club and Rymans
retirement villages. Development of remaining sections in St Michaels and Mayfield. Large blocks
north of State Highway 2 south including consented terraced housing via new road off
Westmorland, and orchard between Mayfield Lane/ Hawkridge Heights, released for
development. Limited development of multiply owned Maori land assumed in longer term.
• North West Bethlehem SP area - Development of Bethlehem Shores Retirement Village key
contributor, including expansion onto adjoining land. Infill and redevelopment of established
residential areas expected.
5 Monitoring
The SmartGrowth Strategy and the NPS-UDC provides for regular and timely monitoring and review of growth
projections.
The NPS-UDC, includes a raft of monitoring measures in respect to both residential and business land development
capacity and availability.
▪ NPS-UDC Quarterly monitoring report,
▪ Housing and Business Capacity Assessment (HBCA) – 3 yearly
▪ Future Development Strategy (FDS) – 3 yearly
The SmartGrowth Development Trends Report has been produced jointly with Western Bay of Plenty District
Council on an annual basis since 2000. It includes monitoring of actual against projected dwelling consents.
These information reports inform the LTP and Regional Policy Statement monitoring work and enable the
SmartGrowth strategy and implementation plan to be monitored. It also enables the timing of infrastructure
provision and funding to be refined to reflect growth needs.
Page 12The nature of the dwelling allocation is that ultimately it is a landowner’s decision as to if and when a development
opportunity may be taken up. Assumed uptake may occur faster or slower than anticipated (or not happen at all
within the projection period), and/or the number of dwellings delivered may be lower or higher than expected. The
reliability and accuracy of the growth allocations reduce over time, and require regular monitoring, review and
adjustment.
6 Conclusions
The projected population and dwelling increases for Tauranga City are significant. The importance of ongoing and
accurate growth monitoring is essential to ensure decisions are founded on the best information.
This Review endeavours to provide an indication of how much, where and when development is likely to occur in
the city over the projection periods. Ongoing monitoring will provide a measure of the accuracy of these allocations,
in the absence of actual counts which will be available at the end of each Census cycle. Census results will signal
where any further realignment is required to address the “unders and overs” inherent in this type of work.
This is also important for Tauranga City Council as it endeavours to balance growth management with financial
management through its LTP and strategic planning.
The population and dwelling projection allocations are regularly reviewed to ensure they are as accurate as possible
and fit for purpose.
7 Appendices
Appendix 1: Growth Management Area (GMA) and Sub-Unit Allocation of Revised Projections,
2018-2048.
Appendix 2: GMA and Sub-Unit Map.
Appendix 3: Meshblock Allocation of Revised Projections 2018-2048.
Appendix 4: GMA, Sub-Unit and Meshblock Map Series.
Appendix 5: Comparison of Applying Additional Population/ Additional Dwelling Divisor and Total
Population/ Total Dwelling Divisor to Dwelling Projections at Sub Unit Level.
Appendix 6: Census Area Unit (CAU) Allocation of Revised Projections – 2018-2048.
Appendix 7: Tauranga City Census Area Unit (CAU) Map, 2013
Appendix 8: Western BOP District Population and Dwelling projections and Statistical Area 2
allocations and SA2 Map, 2018.
Appendix 9: UFTI Connected Centres Programme, Dwelling Allocations and Potential Additional
Development Opportunities, Western BOP Sub Region.
Note: Longer term allocation at MB level is available in a separate Excel Workbook from Council that provides
allocations (including Total dwelling) down to meshblock level from 2018 to 2063 in 5 yearly increments, at 2118
and at 2021 and 2031 horizon years - “Final July 2020 Pop Dwell Review Output Tables” Obj Ref: A11636408.
Shapefiles of geographic areas that growth is allocated is available from Tauranga City Council GIS where required.
Page 13You can also read