First-Half 2018 Results Presentation - "A World of Niche Market Leaders" - Chargeurs
←
→
Page content transcription
If your browser does not render page correctly, please read the page content below

First-Half 2018 Results
Presentation
"A World of Niche Market Leaders"

Chargeurs re-affirms the effectiveness of its
structural growth strategy

Michaël Fribourg
Chairman and Chief Executive Officer
Olivier Buquen
Chief Financial Officer

September 6, 2018

CONTENTS
                                             1. Summary: another excellent performance in
                                                first-half 2018
                                             2. Game Changer plan: daily discipline to create
                                                long-term value
                                             3. A successful acquisition program:
                                                €75m in additional revenue from
                                                value-generating acquisitions, purchased at
                                                reasonable prices
                                             4. Business review:
                                                significant and measurable progress
                                             5. Financial review: continued excellence
                                             6. Outlook

 Chargeurs – First-Half 2018 Results – September 6, 2018                                        ―2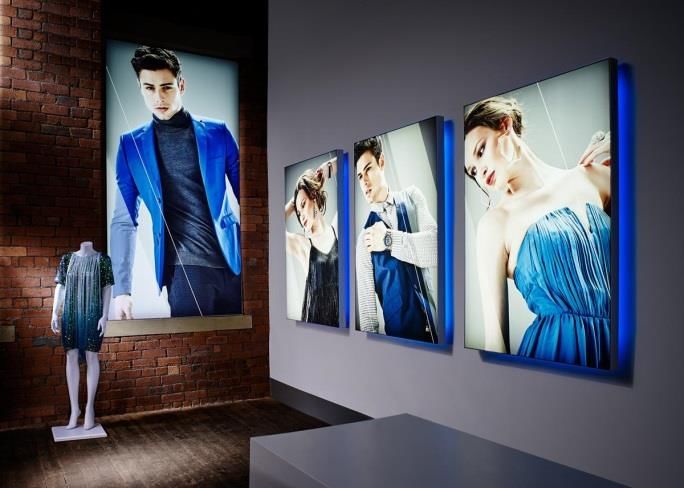
Summary:
                      1                                   another excellent performance in
                                                          first-half 2018

Chargeurs – First-Half 2018 Results – September 6, 2018                                  ―3
Another excellent per formance in first -half 2018: revenue
growth and higher margins and cash flow from operations
Chargeurs continues to enhance its growth profile, profitability and resilience:
• Further increase in operating performance despite an adverse geopolitical and currency environment and an
unfavorable basis of comparison
• Intensified investment drive, with:
• higher opex and capex to speed up organic growth
• targeted acquisitions with an accretive operating margin for the Group
• Steady revenue growth
• EBITDA and recurring operating profit
(ROP) driven by operating
performance
• Strong performance achieved despite
an unfavorable currency effect
and higher wool prices
Immediate results combined with a long-term vision to create innovative global champions
Chargeurs – First-Half 2018 Results – September 6, 2018 ―4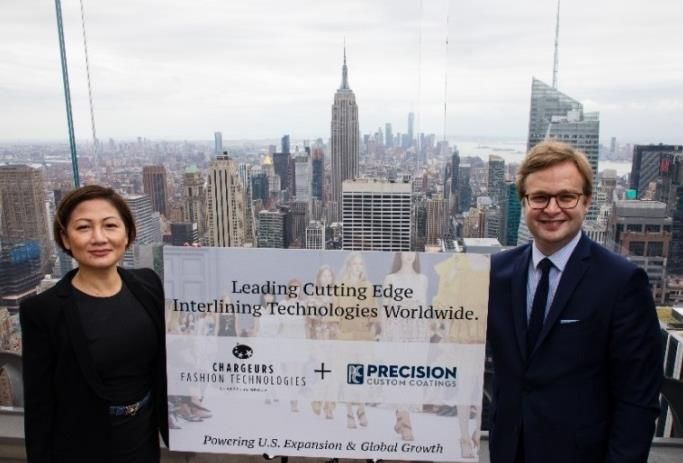
Another excellent per formance in first -half 2018: revenue
growth and higher margins and cash flow from operations
Chargeurs is methodically rolling out its roadmap: excellent financial performances, continued
capex and opex, and accretive acquisitions
Excellent financial performance: ROP up 12.3% like for like
Revenue up 3.1% like for like to €287.1m
EBITDA up 5.2% to €30.6m, and ROP up 12.3% like for like to €24.8m, fueled by higher volumes and price/mix
improvements
Net profit up 10.1% to €15.3m
Game Changer plan: investment in operations and new capacity to drive quality in our divisions
Growth opex: €1.3m
Growth capex: €2.2m
Cost-cutting programs pursued
Excluding growth opex, and on a like-for-like basis, operating margin would have widened by 120 basis points
in H1 2018 compared with H1 2017.
Targeted acquisition and expansion strategy that is paying off
Significant use of our financial resources: €70m invested in the acquisitions of Leach and PCC
~ €75m in additional revenue with an accretive margin for Chargeurs
Chargeurs – First-Half 2018 Results – September 6, 2018 ―5
A methodical growth strategy deployed since 2015
aimed at achieving €1bn in revenue by 2022
A clear vision & Well on the way to achieving
solid strategy A success model
€1bn in revenue by 2022
Acting as a “designer” of our niche Managerial transformation to drive Upscaling and multiplying sources of
markets to create integrated value internal and external growth growth
chains
Strong technical expertise A winning mindset and Simplifying the customer universe
Global supply chain management a performance culture Proposing multiple solutions to customers
Consumer-centric and service-oriented Ongoing optimization of in order to meet their challenges
organizational structure the business model Seizing highly profitable opportunities
Globally-recognized B2B brands A solid financial model that pave the way for game-changing
6 acquisitions generating developments
€100m in revenue
Growth track for €1 bn revenue target Our ambition
1 000
Revenue (€m) Full-year
basis
730
Acquisitions:
> 600 - Innovation
- Game-changing
506 533 - Innovation - New markets & "bolt-on"
October 2015: 499 - New markets - High value-added - Expanding the
change in
478 governance
€72m raised from 5- - High value-added solutions value chain
year and 7-year solutions
Euro PPs - Additional
"Performance, operational
Discipline, €50m raised from 5- €20m invested in a
Strengthening of segments
Ambitions" year and 7-year new coating line
management
program Euro PPs
committees
2014 2015 2016 2017 Organic External After 1st Organic External By
growth growth acquisitions growth growth 2022
(full-year)
"Performance, Discipline, Ambitions" Game Changer
Chargeurs Business Standards: operational excellence in the creation of global innovation champions
Chargeurs – First-Half 2018 Results – September 6, 2018 ―6
A clear and distinctive vision
                                 of industrial markets

Chargeurs: A designer of leaders recognized in their niche markets
 Drawing on our operational excellence as an industrial leader,
 we are shaping our future operations based on four main principles:

                                                          Optimized global     A consumer centric and      Globally-recognized
         Cutting-edge
                                                           supply chain            service oriented            B2B brands
      technical expertise
                                                           management                 approach

              Industry 4.0                                 A global presence      Integrated solutions      Moving up the value chain
           Product innovation                             Customer proximity        Service provider     Direct links with decision-makers
          Technical know-how                                                        Technical advice      Creation of recognized brands

Chargeurs – First-Half 2018 Results – September 6, 2018                                                                                 ―7
Game Changer plan:
                     2                                    daily discipline to create
                                                          long-term value

Chargeurs – First-Half 2018 Results – September 6, 2018                                ―8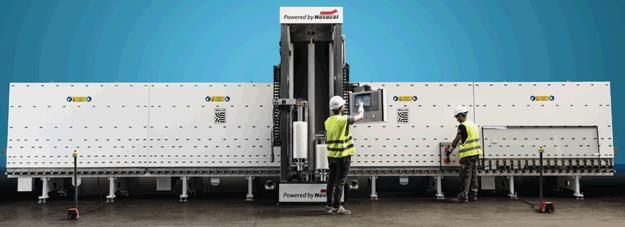
Successful deployment
                                 of the Game Changer performance acceleration plan

                                                                               SMART AND
                                                                                ADVANCED
→ Plan aimed at accelerating the                                             MANUFACTURING
Group's growth and profitability:                                       Improving the performance of
                                                                           our production assets
  • launched in September 2017                                          Reducing our production costs
                                                                           Reducing our non-quality   TALENT
  • covering 24 months                                                              costs           MANAGEMENT

  • designed in collaboration with                               SALES &
                                                                                                     Implementing the
                                                                                                Excellence Training Program
    all of Chargeurs' teams                                     MARKETING
                                                                                             Enhancing & expanding our “Young
    worldwide and focused on                              Developing the “soft skills”         Talents & Seasoned Managers”
                                                             of our sales teams                           program
    four key areas                                         Improving our customer                       Optimizing our
                                                                  intimacy                              organizational
                                                                                                           structure
                                                               Developing new            INNOVATION
                                                               marketing tools
                                                                                  Reviewing our addressable
→ Objective:                                                                          adjacent markets
double profitable revenue by                                                     Accelerating the development
                                                                                 of break-through innovations
2022                                                                               Upscaling our innovation
                                                                                    capabilities, footprint
                                                                                        and network

Chargeurs – First-Half 2018 Results – September 6, 2018                                                                         ―9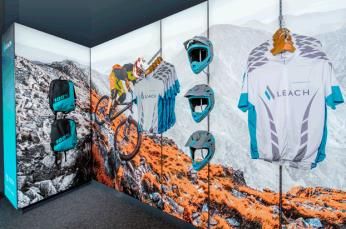
Successful upscaling since 2015, achieved thanks
to a strict model of operational excellence
Chargeurs is reaping the rewards of a committed and long-term strategy of excellence
A clear vision, Ongoing and tightly-controlled Quantitative and
with new management systems implementation qualitative value creation
Ensure the
Sell more
management
Group’s lasting In-depth
• A new management team Targeted and
segmentation of & better
• strength accretive
Talent
Hands-on management acquisitions and markets served
• More international teams diversification and expansion to
• Promoting talent and encouraging strategy new niche
Focus on
sectors
mobility Low net debt high-potential
and LT resources major and
emerging clients Strong like-for-like
Systematic excellence growth
Vision methods +
Benchmark and stable
Ongoing Improving margins
• Effective • “Performance, shareholder structure optimization Product referrals by our
clients and new market
+
segmentation Discipline, Ambitions” committed over the very
of the share Healthy cash flow
based on niche program – a new long term
+
markets momentum with very
Unique culture of
Chargeurs
Global expansion of our Acquisitions
tight operational
• Leadership
discipline
Innovation for a new Business commercial, industrial and
goals in each generation of logistics reach -------------------------
products and services Standards
of these niche • Game Changer plan – = Increase in the
markets pushing our own pace of value
boundaries Ongoing Reengineering
creation
deployment of and ramp-up of
Chargeurs production and
resources
Financial
• New ownership structure Business Systematic
logistics sites
• Stronger balance sheet Standards Unique strategy
programs
for lasting
• Launch of acquisition strategy for productivity
Innovate and competitiveness
• Higher visibility for shares and cost savings
make a difference Improve production
in all of the Group’s & customer
businesses service
Chargeurs – First-Half 2018 Results – September 6, 2018 ― 10Game Changer plan: daily discipline to create
long-term value
Reinvesting qualitatively our excellent financial performance in growth opex and capex
11.5% of EBITDA margin Sales & Marketing
EBITDA LFL and excl. growth opex
- Bundled “products & services” offerings
11.1% of EBITDA margin
•- Development of iconic B2B brands
+5.2%
29.1
30.6 LFL •- New sales and services sites
+15.0%
10.7%
25.3 10.3%
10.0%
Talent Management
- Moves to modernize and globalize organizational
structures
€m •- High-level training for Executive Talents
H1 2016 H1 2017 H1 2018 •- Cross-business projects led by Young Talents
Recurring operating profit 9.5% of operating margin Smart & Advanced Manufacturing
LFL and excl. growth opex
•- Optimization of supplier and customer logistics
+5.5% 9.1% of operating margin •- Investment in the industry of the future
24.8 LFL
+15.8%
23.5
20.3 8.6%
8.3%
8.0%
Distinctive Innovation
- New product ranges to capture market share
€m •- Break-through innovations
H1 2016 H1 2017 H1 2018
Excluding growth opex, and on a like-for-like basis,
operating margin would have widened by 120 basis points in first-half 2018 compared with H1 2017
Chargeurs – First-Half 2018 Results – September 6, 2018 ― 11Game Changer plan: daily discipline to create
long-term value
Game Changer – our major achievements
Sales and Marketing
• Development of bundled “products & services” offerings
“Films + Machines” at CPF thanks to the acquisitions of Somerra, Omma and Walco
“Textiles + Lightboxes” at CTS following the acquisition of Leach
• Development of iconic B2B brands
Low Noise at CPF
Sublimis at CTS
Organica at CLM
• Opening of new sales sites and services centers that are closer to customers
Mexico – CPF
Algeria and Central America – CFT
United States – CTS
Talent Management
• Moves to modernize and globalize organizational structures
New organizational structure by continent for CPF
New global Managing Director for CFT, based in the United States
• High-level, tailor-made training programs at Harvard and with the Hidden Champions Institute in Berlin
for a first group of Chargeurs Executive Talents
• Launch of innovative cross-business projects led by Young Talents identified within the Group
Chargeurs – First-Half 2018 Results – September 6, 2018 ― 12Game Changer plan: daily discipline to create
long-term value
Game Changer – our major achievements
Smart & Advanced Manufacturing
• Optimization of supplier and customer logistics across all businesses
Re-engineering raw materials and logistics flows
Automating new production phases
• Investing in the industry of the future and game-changing technologies
“Techno Smart” 4.0 production line and
vertical laminators for applying protective films to glass at CPF
New high-tech 40 gauge machine at CFT
Mastering new materials at CTS
Sublimation printing line at Leach
Distinctive Innovation
• New product ranges to capture additional market share at CPF:
Product ranges dedicated to protecting structured surfaces
and PVC-like products for stamping
Introducing Low Noise technologies to new market sub-segments:
stainless steel, stratified and profiled
• Break-through innovations
Anti-moire effect for interlining at CFT
Sublimis at CTS, voted “product of the year” by SGIA
Anti-counterfeit protection for premium textile products at CTS, using RFID chips
Chargeurs – First-Half 2018 Results – September 6, 2018 ― 13A successful acquisition program:
€75m in additional revenue from
3 value-generating acquisitions,
purchased at reasonable prices
Chargeurs – First-Half 2018 Results – September 6, 2018 ― 14A targeted and long-term acquisition strategy
An acquisition strategy based on a strict and targeted model
Distinctive Create global champions in high value-added niche markets
vision Focus on accretive businesses
Disruption Game-changing bolt-on Vertical acquisitions to move up Acquisitions in new businesses
& Growth acquisitions closely in line with our the value chain and offer with high growth potential
strategy end-to-end solutions
Market analysis Target analysis Evaluation Integration
Structural growth Strong competitive Priority given to return Extensive work
Opportunities in positioning on capital employed upstream of acquisitions
Strict fragmented markets Successful and Sustainable revenues Strong focus on the
Strong technical features recognized brands Accretive value integration of teams
methodology and synergies
Opportunities for Recurrent revenues High growth in EBITDA
synergies and a solid client base and cash flow Strict supervision of
Accretive margins measures in place
Strong cultural fit
Chargeurs – First-Half 2018 Results – September 6, 2018 ― 15A successful strategy for value creation
Since 2015, Chargeurs has carried out targeted acquisitions, creating champions in
high value-added niche markets
An ongoing and
value-creating
acquisition strategy
Still to come:
> Game-changing “bolt-
on” acquisitions
$80m in revenue
> Acquisitions to move up
- Creation of an the value chain
innovative global
£10m in revenue champion > Acquisition of a new
> Disruptive vertical operating segment
> Strengthening service
integration capacities
€8m in revenue
> Offering end-to-end
> Moving up the value solutions
chain
$27m in revenue
> Offering integrated
> Strengthening solutions
leadership in the
United States
> Adding production
capacity in the USD zone
> €100m in extra revenue and > €10m in additional recurring operating profit
Chargeurs – First-Half 2018 Results – September 6, 2018 ― 16Business review:
4 significant and measurable progress
Chargeurs – First-Half 2018 Results – September 6, 2018 ― 17First-half 2018 key figures
Another strong increase in results
Group Protective Films Fashion Technologies Technical Substrates Luxury Materials
Like-for-like growth Like-for-like growth Like-for-like growth Like-for-like growth Like-for-like growth
xxxx
H1 2018: +3.1% xxxx
H1 2018: +3.6% xxxx
H1 2018: +7.2% xxxx
H1 2018: +6.4% H1 2018:xxxx
-3.3%
281.8 287.1
253.5
143.3 150.0
120.5
Revenue 68.9 67.8 68.8
52.5 58.2 53.5
14.8
€m 11.6 12.5
H1 2016 H1 2017 H1 2018 H1 2016 H1 2017 H1 2018 H1 2016 H1 2017 H1 2018 H1 2016 H1 2017 H1 2018 H1 2016 H1 2017 H1 2018
29.1 30.6
25.3 10.3%
10.7%
21.4 21.6
EBITDA 10.0% 16.5
14.9% 14.4% 7.7
6.5
€m 13.7% 5.8 11.2%
2.6 1.8 1.7
9.4% 8.6% 2.3 2.3 1.0
(% revenue) 19.8% 17.6% 3.4% 2.9%
18.4%
1.9%
H1 2016 H1 2017 H1 2018 H1 2016 H1 2017 H1 2018 H1 2016 H1 2017 H1 2018 H1 2016 H1 2017 H1 2018 H1 2016 H1 2017 H1 2018
23.5 24.8
Recurring 20.3
8.6% 18.2 18.2
8.3%
14.0 6.0
operating 8.0% 12.7% 12.1% 4.5
11.6% 4.0 8.7%
profit 1.8 1.8 1.9 1.8 1.7
6.5% 5.9% 1.0
15.5% 14.4% 12.8% 3.4% 2.9%
€m 1.9%
H1 2016 H1 2017 H1 2018 H1 2016 H1 2017 H1 2018 H1 2016 H1 2017 H1 2018 H1 2016 H1 2017 H1 2018 H1 2016 H1 2017 H1 2018
Chargeurs – First-Half 2018 Results – September 6, 2018 ― 18Chargeurs Protective Films
CPF "The leading innovative coating solutions"
First-Half 2018 Highlights
Volatile economic context marked by geopolitical uncertainty, an
adverse USD effect and a highly unfavorable basis of comparison
Outstanding performance: further organic growth and operating
margin topping 12%
Development of CPF & CPSM’s global offering:
initial commercial success & excellent performance by CPSM
New services center in Mexico
Chargeurs – First-Half 2018 Results – September 6, 2018 ― 19Chargeurs
Protective
Films Key figures
A robust performance despite an unfavorable basis of comparison and an adverse USD currency effect
3.6% like-for-like revenue growth in first-half 2018: price/mix improvements and higher volumes thanks to
the steady launch of game-changing innovations, the success of Low Noise products and best-in-class
customer relations
Operating margin topping 12% despite a highly adverse USD currency effect and an unfavorable basis of
comparison with H1 2017 when operating margin widened by 110 basis points versus H1 2016
Positive impact of changes in scope of consolidation: significant contribution from Chargeurs Protective
Specialty Machines (CPSM)
New 4.0 production unit representing an investment of over €20m: provisional timeline respected and
objective still to start up production and sales by the summer of 2019
Chargeurs – First-Half 2018 Results – September 6, 2018 ― 20Chargeurs Fashion Technologies
CFT “Creating the new worldwide leader”
First-Half 2018 Highlights
Angela Chan succeeds Bernard Vossart as Managing Director of
Chargeurs Fashion Technologies
Acquisition of Precision Custom Coatings Interlining:
announced on June 28 and completed on August 24:
+ An additional $80m in full-year revenue
+ Accretive margins and profitability EBITDA 11% and ROP 11%
+ Attractive valuation conditions EV/EBITDA = 7.5
Chargeurs – First-Half 2018 Results – September 6, 2018 ― 21Chargeurs
Fashion
Technologies Key figures
An excellent performance:
like-for-like growth of more than 7% and operating margin topping 8%
Brisk sales momentum in a competitive market: further commercial success thanks to investments in
40 gauge machines and the opening of new showrooms and sales offices
Sharp increase in operating margin, demonstrating the success of the upscaling strategy
Acquisition of PCC: a driver of growth and continuous improvement in performance for CFT
Creation of an innovative global champion,
with
€200m in revenue, €20m in EBITDA and over €15m in recurring operating profit on a full-year basis
Chargeurs – First-Half 2018 Results – September 6, 2018 ― 22Chargeurs Technical Substrates
CTS An industrial champion
First-Half 2018 Highlights
Leach: a game-changing acquisition
Leader in graphic display solutions for retailers, museums and
institutions
A change driver for CTS, opening up new market and geographic
opportunities thanks to a bundled offering
€11m in additional revenue
Strong sales momentum: successful launch of Sublimis and new
commercial partnerships
Chargeurs – First-Half 2018 Results – September 6, 2018 ― 23Chargeurs
Technical
Substrates Key figures
Another acceleration for like-for-like growth, to 6.4%, and successful integration of Leach
Strong sales momentum:
Successful launch of Sublimis
Capture of new geographic markets, such as Japan, demonstrating the quality of CTS’s solutions
New commercial partnerships signed with key accounts
EBITDA and ROP driven by like-for-like growth
Impact on margins of growth opex and capex incurred to increase CTS’s growth and sharpen its competitive edge
Leach: swift and effective integration:
first high-potential joint sales offerings proposed by Leach and Senfa
Chargeurs – First-Half 2018 Results – September 6, 2018 ― 24Chargeurs Luxury Materials
CLM "From the sheep to the shop"
First-Half 2018 Highlights
37% increase in wool prices versus 2017
Launch of Organica and creation of strategic partnerships
with recognized brands
Positive contribution from CLM’s equity-accounted investees,
proving the success of the restructurings carried out in 2016
and 2015
Chargeurs – First-Half 2018 Results – September 6, 2018 ― 25Chargeurs
Luxury
Materials Key figures
Opex to gradually ramp up the new business model
Wool prices increasingly high mainly due to an explosion in demand from the fashion industry in Europe,
China and the United States
Higher wool prices only have a limited impact on ROP, thanks to CLM’s business model:
it is a trading business and therefore an intermediary
Growth opex related to the development of Organica:
launch of the label and creation of capsule collections
Chargeurs – First-Half 2018 Results – September 6, 2018 ― 26Financial review:
5 continued excellence
Olivier Buquen, Chief Financial Officer
Chargeurs – First-Half 2018 Results – September 6, 2018 ― 27Consolidated Income Statement
Another sharp rise in results
€m H1 2018 H1 2017 Change Comments
Revenue 287.1 281.8 +5.3 +1.9% Up 3.1% like for like: further price/mix improvement
Gross profit 75.8 71.8 +4.0 +5.6%
Increase in profit thanks to a positive price/mix effect to offset the negative currency effect
as a % of revenue 26.4% 25.5%
EBITDA 30.6 29.1 +1.5 +5.2%
Operational lever in annual productivity plan
as a % of revenue 10.7% 10.3%
Depreciation and amortization (5.8) (5.6) -0.2 +3.6% Ambitious and tightly-controlled strategy for capacity and technology spending
Recurring operating profit 24.8 23.5 +1.3 +5.5%
Up 12.3% like for like: improved mix, cost discipline and efficiency
as a % of revenue 8.6% 8.3%
Non-recurring items (0.1) (3.0) +2.9 H1 2018: acquisition projects €(1.7)m; Badwill on Lantor Lanka €1.7m
Operating profit 24.7 20.5 +4.2 +20.5%
Finance costs, net (4.5) (3.2) -1.3 Euro PP of €50m in June 2017: strengthening of financial resources and extended maturity of borrowings
Other financial income and expense (0.9) (0.6) -0.3
Net financial expense (5.4) (3.8) -1.6
Income tax expense (4.1) (2.3) -1.8 H1 2017: €1.4m in deferred tax assets recognized for tax loss carryforwards
Investments in equity-accounted investees 0.1 (0.5) +0.6 Profit generated by CLM manufacturing partnerships
Profit for the period 15.3 13.9 +1.4 +10.1% New year-on-year increase
EBITDA up 5.2% (9.1% excluding wool): further price/mix improvement and effects of the annual productivity plan
ROP margin up to 8.6% of revenue (from 8.3% in H1 2017) reflecting another period of robust operating performance which
meant that opex could be absorbed
Net financial expense: unfavorable basis of comparison due to the €50m Euro PP carried out in June 2017
Income tax expense: no favorable impact from the recognition of deferred tax assets for tax loss carryforwards in H1 2018
(versus €1.4 million in H1 2017)
Equity-accounted investments: positive contribution in H1 2018 thanks to the restructurings carried out
Net profit up 10.1%
Chargeurs – First-Half 2018 Results – September 6, 2018 ― 28ROP growth once again higher
than the year-on-year increase in revenue
Revenue and recurring operating profit bridges
Revenue bridge (€m) Recurring operating profit bridge (€m)
281.8 9.7 10.1 287.1
-13.2 -1.3
3.1% organic 12.3% organic
5.1
23.5 1.4 2.1 24.8
-4.3
-3.0
H1 2017 Scope Currency Volume Price/mix H1 2018 H1 2017 Scope Currency Volume Price/mix Other costs H1 2018
Revenue Recurring operating profit
Scope : CPSM, Leach and Lantor Lanka Scope : CPSM and Lantor Lanka
Currency : USD, NZD and ARS Currency : USD
Volume : negative effect for CLM Volume : positive effect for CFT
Price/mix : positive effects for all divisions
Price/mix : positive effects for all divisions
Other costs : opex to drive growth
Chargeurs – First-Half 2018 Results – September 6, 2018 ― 29Success of the annual productivity plan
2018 target: €4.6m in cost savings for the full year
Cost savings generated by the Productivity plan
annual productivity plan
5.6 Target
4.6 4.6
2.1
€2.1m in
€m EBITDA gains
2016 2017 2018
achieved in
H1 2018
€2.1m in savings achieved in the six
months ended June 30, 2018, i.e.
46% of the €4.6m target set for 2018
€12.3m in total savings achieved
since end-2015
Chargeurs – First-Half 2018 Results – September 6, 2018 ― 30Statement of Cash Flows Solid cash flow from operations, further quality-focused investments, and acquisition of Leach €m H1 2018 H1 2017 Comments EBITDA 30.6 29.1 Up 5.2%: improved mix, higher volumes and reinforcement of productivity plan Non-recurring – cash (2.0) (2.4) H1 2018: acquisition-related expenses of €1.7m Finance costs - cash (4.5) (3.2) Euro PP of €50m in June 2017: strengthening of financial resources and extended maturity of borrowings Income tax – cash (2.4) (2.4) Optimized use of tax credits Other 0.0 0.4 Cash flow from operations 21.7 21.5 Up 0.9%: robust cash flow from operations Dividends from equity-accounted investees 0.0 0.8 Exceptional dividend related to a real estate sale in H1 2017 Change in working capital (at constant exchange rates) (16.4) (4.9) Increase in WCR linked to like-for-like growth and a spike in activity in June 2018 Net cash from operating activities 5.3 17.4 Cash: increase in WCR absorbed by cash flow from operations Purchases of PPE and intangible assets (9.1) (5.0) Deployment of the new 4.0 production line at Chargeurs Protective Films Acquisitions (14.2) (3.0) Acquisition of Leach on May 4, 2018 (net of cash acquired) Dividends paid (8.1) (3.6) Payment of the final dividend of €0.35 per share for 2017: €4.4m in cash & €3.7m in shares Capital increase 3.7 0.0 Payment of dividends in shares: 170,507 shares created with a par value of €21.7 Currency effect (0.1) 0.2 Other (0.1) 0.1 Total (22.6) 6.1 Negative impact over the period: acquisition of Leach and sustained investment policy Debt (-)/cash (+) at opening (12/31/y-1) 8.9 3.2 Debt (-)/cash (+) at closing (06/30/y) (13.7) 9.3 Solid cash flow from operations, at €21.7m The H1 figure for net cash from operating activities reflects the increase in working capital due to the Group’s organic growth and a strong month of June 2018 Ambitious investment policy pursued, with: Growth opex Targeted acquisitions: Leach, a growth accelerator for CTS Chargeurs – First-Half 2018 Results – September 6, 2018 ― 31
Balance Sheet Analysis
A very robust balance sheet structure
€m 06/30/18 12/31/17 Comments
Intangible assets 102.6 88.3 Leach: goodwill (+€8m) & trademark (+€4.6m); €1.5m positive currency effect (USD)
Property, plant and equipment 69.5 63.2 Increase in capex including CPF's "techno-smart" production line; €2.5m outlay for Leach
Investments in equity-accounted investees 11.8 11.7 Stable investments in equity-accounted investees
Non-current assets 15.0 13.2
WCR 55.5 44.6 Increase in WCR linked to like-for-like growth and a spike in activity in June 2018
Total capital employed 254.4 221.0
Equity 240.7 229.9 Profit: €15.3m; Dividends: €(8.1)m;
(Net debt)/net cash (13.7) 8.9 Net cash from op. activities: €5.3m; Capex: €(9.1)m; Acq.: €(14.2)m; Div.: €(8.1)m
Number of shares at June 30, 2018: 23,501,104
Solid equity which rose during the period following the payment of the €8.1m dividend for 2017 (€3.7m in shares
and €4.4m in cash)
Solid financing structure:
€286m in financing facilities at Group level before the acquisition of PCC
Average debt maturity of 5 years
Factoring: off-balance sheet programs renegotiated, with a simplified contractual structure and better financial conditions
Chargeurs – First-Half 2018 Results – September 6, 2018 ― 326 Outlook
Michaël Fribourg,
Chairman and Chief Executive Officer
Chargeurs – First-Half 2018 Results – September 6, 2018 ― 33Chargeurs re-affirms its structural growth profile
in a volatile environment
Chargeurs will continue to concentrate on its effective, ambitious and quality-focused structural
growth strategy, despite the volatile economic and geopolitical environment
A strategy built for resilience
Further acceleration and upscaling of our performance and growth, while capitalizing on market opportunities
Diversification of our sales and production models to offer customers better product availability and a more
personalized service
Faster pace for innovation and technology to differentiate our offerings over the long term
In an increasingly unsettled economic and geopolitical context
Uncertain political environments in many countries
High tension between the world’s major trade regions, requiring remodeling of international and regional supply
chains
Economic and political models in emerging countries less predictable than before, necessitating particular
prudence for international deployments
Abundant money creation, continuing to boost financial markets
Significant monetary events: Turkey, Argentina, etc.
Chargeurs – First-Half 2018 Results – September 6, 2018 ― 34Chargeurs is continuing to accelerate its per formance,
with solid operational excellence standards
A methodical excellence and long term implementation strategy
• A committed reference shareholder
• Experienced Top Management with an international profile
A clear • A clear vision: constantly strengthening our leadership in niche markets
strategy
• Continuous implementation and systematic deployment of excellence methods
• A long-term capital structure, a solid balance sheet and robust cash generation to
support organic growth and the acquisition strategy
An operational Continuous
Strict
Operational Highly committed excellence improvement
financial
excellence teams plan: of production &
discipline
Game Changer customer service
Creation of Development of the High conversion
Targeted
quantitative Game-changing value chain rates
and accretive
& qualitative innovation & designing for sales to profit
acquisitions
value our markets & profit to cash
Chargeurs – First-Half 2018 Results – September 6, 2018 ― 35Chargeurs is rolling out its roadmap
to achieve €1bn in revenue by 2022
Confirmation of the 2018 guidance
Revenue growth
Higher operating margin
Solid cash generation
One year after announcing its €1bn revenue target,
Chargeurs confirms and fully achieves its roadmap Our ambition
1 000
Revenue (€m) Full-year
basis
730
Acquisitions:
> 600 - Innovation
- Game-changing
506 533 - Innovation - New markets & "bolt-on"
October 2015: 499 - New markets - High value-added - Expanding the
change in
478 governance
€72m raised from - High value-added solutions value chain
5-year and 7-year solutions
Euro PPs - Additional
"Performance,
€50m raised from €20m invested in a operational
Discipline, Strengthening of
5-year and 7-year new coating line segments
Ambitions" management
program Euro PPs
committees
2014 2015 2016 2017 Organic External After 1st Organic External By
growth growth acquisitions growth growth 2022
(full-year)
"Performance, Discipline, Ambitions" Game Changer
Chargeurs Business Standards: operational excellence in the creation of global innovation champions
Chargeurs – First-Half 2018 Results – September 6, 2018 ― 36Strong shareholder value creation
Strong value creation for shareholders thanks to enhanced profitability
Payment of an interim dividend of €0.30 per Dividend per share
share, with a dividend reinvestment option
+9% €0.60
€0.55
Ex-dividend date for the interim dividend and +83%
September 12, 2018 €0.30 +20%
start of reinvestment option period
End of reinvestment option period September 20, 2018 €0.30
€0.25 €0.25
Announcement of no. of options
September 26, 2018
exercised 2015 2016 2017 2018
Delivery date of shares and payment of cash Interim dividend
September 28, 2018
interim dividend
Share performance since January 1, 2017
(CAC 40 and SBF 120 indices adjusted in line with Chargeurs' share price)
1-year renewal of the program to buy back €30
+57%
up to €12 million worth of Chargeurs shares €25
A growth value and return strategy €20
€15
€10
€5
01/01/17
12/31/16 06/30/17 12/31/17 06/30/18
Chargeurs CAC 40 adjusted SBF 120 adjusted
Chargeurs – First-Half 2018 Results – September 6, 2018 ― 37Glossary Like-for-like growth (based on a comparable scope of consolidation and at constant exchange rates) for year Y compared with year Y-1 is calculated by: applying the average exchange rates for year Y-1 to the period concerned (year, half-year, quarter); and using the scope of consolidation for year Y-1. Operating margin: recurring operating profit / revenue Return on capital employed: recurring operating profit / capital employed Chargeurs – First-Half 2018 Results – September 6, 2018 ― 38
2018 Investor Calendar
Wednesday, November 14, 2018 (after the close of trading):
Third-quarter 2018 financial information

Chargeurs
1 1 2 , av e n u e K l é b e r
7 5 1 1 6 Pa r i s
+33 1 47 04 13 40
co mf i n @ c h a rg eu rs .f r
w w w. ch a rg e u rs .f r
You can also read


