IDEXX Laboratories, Inc - Raymond James 41st Annual Institutional Investors Conference

Page created by Katie Quinn
 
CONTINUE READING
IDEXX Laboratories, Inc - Raymond James 41st Annual Institutional Investors Conference
IDEXX Laboratories, Inc.
Raymond James 41st Annual
Institutional Investors Conference
Jay Mazelsky
Chief Executive Officer
March 2, 2020
IDEXX Laboratories, Inc - Raymond James 41st Annual Institutional Investors Conference
Safe Harbor Disclaimer
     The following information contains forward-looking statements within the meaning of the Private Securities Litigation Reform Act of 1995. These forward-looking
     statements are based on management’s current expectations and beliefs, as well as a number of assumptions concerning future events. These statements are
     subject to risks, uncertainties, assumptions and other important factors. You are cautioned not to put undue reliance on such forward-looking statements because
     actual results may vary materially from those expressed or implied. The reports filed by the Company pursuant to United States securities laws contain discussions
     of some of these risks and uncertainties. The Company assumes no obligation to, and expressly disclaims any obligation to, update or revise any forward-looking
     statements, whether as a result of new information, future events or otherwise. You are advised to review the Company’s filings with the United States Securities
     and Exchange Commission (which are available from the SEC’s EDGAR database at www.sec.gov and via the Company’s website at www.idexx.com).

     We refer in this presentation to projections communicated at our Investor Day on August 14, 2019 and our 2020 outlook communicated on January 31, 2020; these
     references speak only as of the respective dates on which they were communicated and shall not be deemed to be a reiteration or affirmation of the guidance or an
     indication that our expectations have not changed since that time.

     Non-GAAP Financial Measures
     In this presentation, we refer to some non-GAAP financial measures. For a reconciliation to the most comparable GAAP financial measures, we refer you to our
     footnotes and the Appendix to this presentation, which also refer to the Company's Annual Report on Form 10-K for the year ended December 31, 2019, both
     available at www.idexx.com/investors.

     Please refer to additional footnotes in the Appendix.

2   © 2020 IDEXX Laboratories, Inc. All rights reserved.
IDEXX Laboratories, Inc - Raymond James 41st Annual Institutional Investors Conference
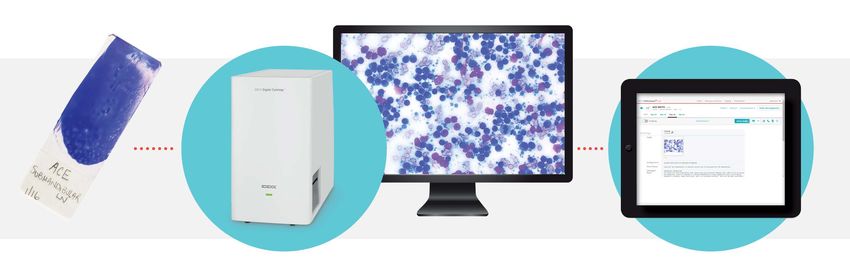
We Focus on Pet Healthcare Diagnostics and Software

                                                                            Livestock, Poultry,
                                                                            and Dairy

                                                                                    Water
            Highly attractive long-term growth
                                                                         6%             Other
             opportunity
                                                           Companion       6%
            Global leadership position                    Animal
                                                           Group
            Innovation driven
            Durable recurring revenue model
            Consistent double-digit organic revenue
             growth history
                                                                  88 %

3   © 2020 IDEXX Laboratories, Inc. All rights reserved.
IDEXX Laboratories, Inc - Raymond James 41st Annual Institutional Investors Conference
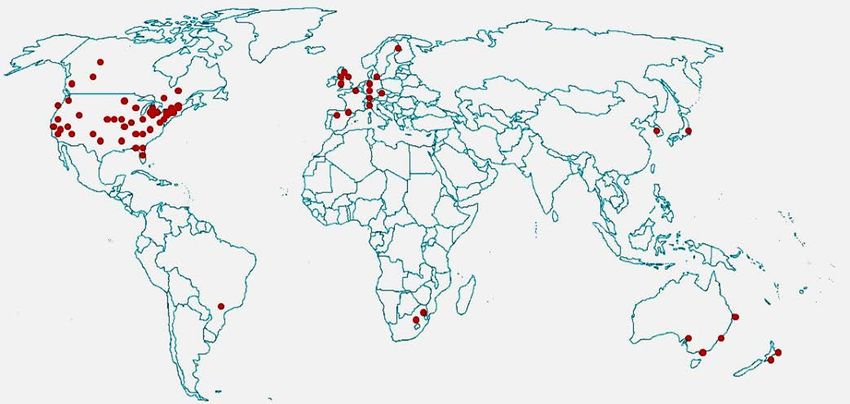
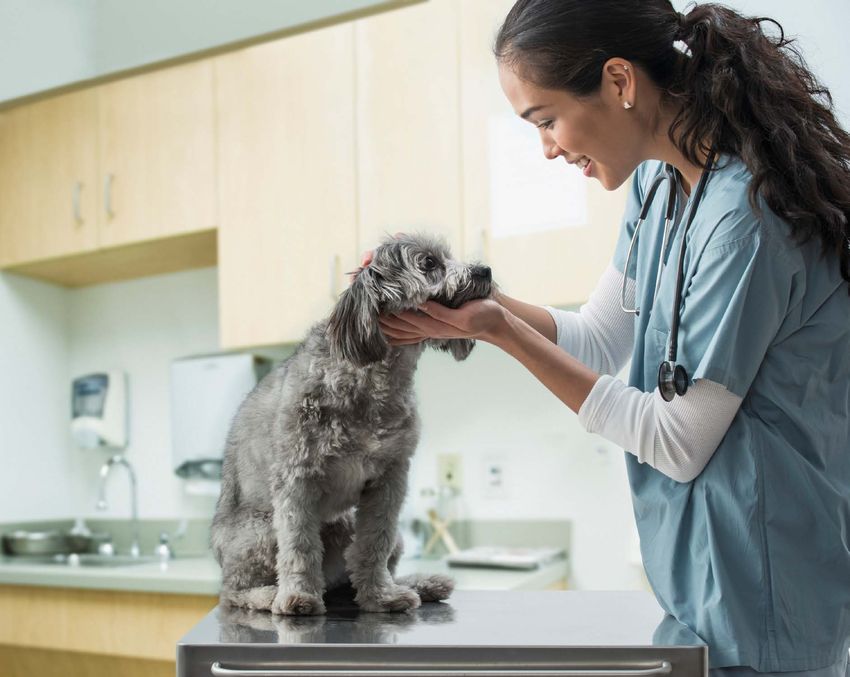
People are Willing to Spend on Pet Family Members – like Scout

          “I feel that my pet is
          an important part of                                              98%
          my family.”

          “I couldn’t imagine
          giving up my pet for
          any reason.”
                                                                           95%
                                                                                                                                                                                                                       *

     Percentages represent those responding “Strongly Agree” or “Agree”.
     Source: Pet Owner Survey conducted in 2016 by The Human Animal Bond Research Institute (HABRI) Foundation in partnership with Cohen Research Group (n = 1,995 pet owners), which had a margin of error of plus or minus 2.2%.
     * https://www.nbcnews.com/news/animal-news/his-dog-was-saved-deadly-cancer-he-bought-6m-super-n1125331

4   © 2020 IDEXX Laboratories, Inc. All rights reserved.
IDEXX Laboratories, Inc - Raymond James 41st Annual Institutional Investors Conference
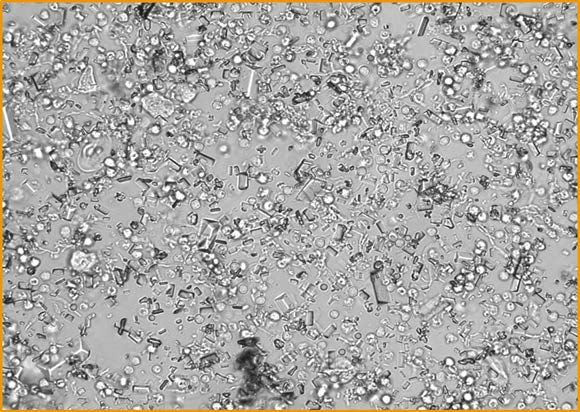
…And the Younger Generations are Demonstrating a Higher Willingness
    to Spend on Their Beloved Pets
                                                                              Is Willing to Make Financial                                        Spent $50 or More on                                        Spent $75 or More on
                                                                              Tradeoffs to Pay for Pet’s                                          Pet in Past 30 days**                                       Pet in Past 30 days**
                                                                              Products & Services*

                                                 Millennials
                                                 (24 yrs to 39 yrs)
                                                                                                           41%                                                                         54%                                   27%

                                                 Gen X
                                                 (40 yrs to 55 yrs)
                                                                                                     36%                                                                39%                                           20%

                                                 Baby
                                                 Boomers                                    21%                                                             26%                                                11%
                                                 (56 yrs to 74 yrs)

      *   Based on analysis of data from survey of U.S. pet owners fielded in May, 2016 (n = 1,208 dog owners and 303 cat owners), weighting dog owner responses and cat owner responses in proportion to their contribution to U.S. veterinary practice
         revenue. Respondents were asked to rate his/ her agreement with a series of statements on a 6-point scale. Percentages represent total responding ‘Strongly Agree’ or ‘Agree’.
      ** Based on: Gen Z and Millennials as Pet Market Consumers: Dogs, Cats and Other Pets, Packaged Facts, February, 2018.

5   © 2020 IDEXX Laboratories, Inc. All rights reserved.
IDEXX Laboratories, Inc - Raymond James 41st Annual Institutional Investors Conference
IDEXX is Led by Companion Animal Diagnostics Recurring Revenue
               Total IDEXX Revenue ($Billion)1,2
                 $
                                                                            $2.4B
                                                                                    Non-Recurring

                                                                             13%    Other Recurring

                                                                                    Companion Animal
                                                                    $1.1B    76%    Dx Recurring

                                                                    14%

                                                                    67%

    Recurring as a % of Total
    IDEXX Revenues
                                                                    81%      89%
    1,2   Please refer to the Appendix for descriptive footnotes.

6   © 2020 IDEXX Laboratories, Inc. All rights reserved.
IDEXX Laboratories, Inc - Raymond James 41st Annual Institutional Investors Conference
Consistent, High CAG Diagnostics Recurring Revenue Gains

     Annual CAG Diagnostics Recurring Revenue and Normalized Organic Revenue Growth1,2,3,4,5
     ($Billion)
      $
                                                                                                                                                                    11.9%
                                                                                                                                                                4
                                                                                                                                                      11.9%
                                                                                                             12.8%
                                                                     12.0%

     1,2   Please refer to the Appendix for descriptive footnotes.    3,4,5   Non-GAAP financial measure, please refer to Appendix for descriptive footnotes.

7   © 2020 IDEXX Laboratories, Inc. All rights reserved.
IDEXX Laboratories, Inc - Raymond James 41st Annual Institutional Investors Conference
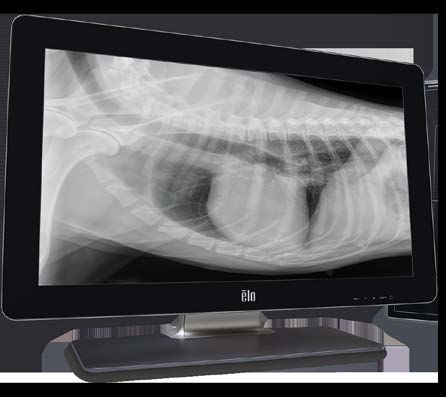
IDEXX’s Revenues are Highly Durable – Driven by our Expanding
    Recurring CAG Diagnostics Annuity

           Year-over-year Growth1,2,3,4

                                                                                                                                                             IDEXX WW CAG Diagnostics Normalized
                                                                                                      IDEXX WW CAG Normalized                                Organic Recurring Revenue
                                                                                                      Organic Revenue

                                                                                                                                                               Total Personal
                                                                                                                                                               Consumption Expenditure

     1,2   Please refer to the Appendix for descriptive footnotes.   3,4   Non-GAAP financial measure, please refer to Appendix for descriptive footnotes.

8   © 2020 IDEXX Laboratories, Inc. All rights reserved.
IDEXX Laboratories, Inc - Raymond James 41st Annual Institutional Investors Conference
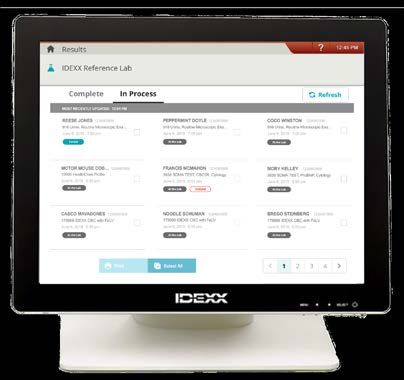
IDEXX’s Innovation has been Built on Decades of Capability Development

                                                                                                              Instrument Platform
                                                                                                              Development

                                                                                                              Unique, Differentiated
                                                                                                              Assay Development

                                                                                                              Customer-facing
                                                                                                              Software

                                                                                                              Connectivity Systems

                                                                     IDEXX Annual R&D Investment
                                                                              ($M, calendar years shown)      AI / Machine Learning

    1998                    2001                       2004   2007    2010    2013         2016        2019

9   © 2020 IDEXX Laboratories, Inc. All rights reserved.
IDEXX Laboratories, Inc - Raymond James 41st Annual Institutional Investors Conference
The IDEXX In-Clinic Diagnostic Suite
 A Long History of Profound Innovations and End-to-End Connectivity

                    Practice
                  Management
                    System

IDEXX
Web PACSTM

10   © 2020 IDEXX Laboratories, Inc. All rights reserved.
Catalyst Menu Breadth and Depth Exceeds Customer Expectations

                  2012                                 2013   2015         2017           2018           2018           2019          2020

         Phenobarbital                         Fructosamine   Total T4        CRP       IDEXX SDMA     T4/SDMA        Progesterone   Bile Acids
           Seizures                              Diabetes     Thyroid    Inflammation      Kidney    Thyroid/Kidney   Reproduction      Liver

                                                                 8 New Tests in 8 Years

11   © 2020 IDEXX Laboratories, Inc. All rights reserved.
We Estimate ~72.5k Additional Worldwide Catalyst Placement Opportunities

     Worldwide Catalyst Placement Opportunities by Type
     (as of end 2019)*

                                                                                                                 Greenfield               20,500
                                                                                                              (no analyzer)
                                                                                                                                                                   ~72.5k
                                                                                                                  Competitor
                                                                                                                                                        Catalyst Placement Opportunities
                                               IDEXX VetTest                                                       Analyzer               40,000          • 14.5k North America
                                               customers that                                                                                             • 58k International
                                               could upgrade
                                                                                       12,000

                                41,000

                             IDEXX                                                 IDEXX                                              Potential IDEXX
                             Catalyst                                              VetTest                                              Chemistry
                            Customers                                             Customers                                             Customers

     * All figures are rounded. Excludes practices too small to be likely candidates for chemistry analyzer placement at this time.

12   © 2020 IDEXX Laboratories, Inc. All rights reserved.
SediVue Dx® Capabilities Continue to Advance
 Neural Network 5.0 with Advanced Bacteria Detection Leveraging 5 Million Patient Samples

                                                                                             First run: 'Suspect Presence’ of Bacteria
                     NEURAL
                    NETWORK                             1.0    2.0    3.0    4.0     5.0
                                                                                    350M
                                                                                    images

                                                                                                                        Same sample

                                                                             175M
                                                                                             Confirmation run: Bacteria are “Present”

                                                                      70M
                                      IMAGES

                                                        0.5M   14M

                                                      2016     2017   2018   2019    2020
13   © 2020 IDEXX Laboratories, Inc. All rights reserved.
Highly Advanced Reference Lab Capabilities Developed Over Decades

           80 Labs Globally                                                                         Up to
                                                                                                    2x Daily

                                                                                               Unparalleled Integration

                   Highest Customer
                   Satisfaction
     U.S. NPS

                                                                IDEXX        Fecal Dx®                   Global Network
                                                                SDMA® Test   Antigen Profile             of Pathologists
                IDEXX Reference               Competitor
                  Laboratories                                 Most Advanced Menu
14      © 2020 IDEXX Laboratories, Inc. All rights reserved.
Transforming Cytology: IDEXX Point-of-Care Digital Cytology Service
     < 2 Hours Expert Interpretation
     24 hours a day, 7 days a week, 365 days a year

                      2 Hours                                Powered by VetConnect PLUS with Rapid Access to 100+ Clinical Pathologists

                        Days                                                     Traditional methods
15    © 2020 IDEXX Laboratories, Inc. All rights reserved.
IDEXX PIMS and Software Apps Together Form a Complete Solution

                                                                                    ®

                                                Superior integration with leading apps, services, and products
16   © 2019 IDEXX Laboratories, Inc. All rights reserved.
Significant Range of Diagnostic Use Points to Long-Term Growth Opportunity

                                                                                                            % of Wellness Clinical Visits                                                     % of Non-wellness Clinical Visits
       % of Clinical Visits including Bloodwork                                                                including Bloodwork                                                                  including Bloodwork
                                                                                                                                                              43%
                                                                                                                                                                                                                                                41%
                                                                 37%

                                                                                                                                                                                                                                                       Mean:
                                                                        Mean:                                                                                                                                                                           22%
                                                                         17%
                                                                                                                                                                       Mean:
                                                                                                                                                                        8%

            Bottom                                           Top Top                                       Bottom                                    Top Top                                 Bottom                                    Top Top
            Decile                                          Decile 2%                                      Decile                                   Decile 2%                                Decile                                   Decile 2%
                         Deciles of Practices                                                                         Deciles of Practices                                                              Deciles of Practices

      Source: Based on analysis of IDEXX Practice Intelligence data (n = 7,003 practices). ‘Clinical visits’ are those where the reason for visit involves an interaction between a veterinary clinician and a pet, including wellness and non-wellness visit
             types. ‘Bloodwork’ represents chemistry and/ or hematology.

17   © 2020 IDEXX Laboratories, Inc. All rights reserved.
Expansion of Diagnostic Testing Points to $30 Billion Long-Term Market Opportunity
                                                      Estimated Total Worldwide Companion Animal Diagnostic Spending ($M)*
                                                                                                                                                                                                                                                  Implied CAGR
                                                                                                                                                                                                                                                      2018 - 2043
     Base Case Scenario:                                                                                              ~ 8%+
                                                                                                                        CAGR
     Continuation of past 5-year                                                                                                                                                                   $29B
     diagnostic utilization increase**

                                                                                                                                                                                                                          International 10 - 11%
                                                                                                                25-year
                                                                                               Generational Macro Cycle
                                                                                                                                                                                                                          U.S.                           7 - 8%
                                                                     $3.8B

                                                                       2018                                                                                                                        2043

% of Clinical Visits U.S.                                              17%                                                                                                                          30%
with Bloodwork
                     International                                      6%                                                                                                                          17%

     •   Revenue estimated at the manufacturer level. Includes reference lab, telemedicine, in-house instruments and consumables, rapid assay, manual microscopy and ‘similar’ types of diagnostics through 2043. Excludes veterinary software, digital and ultrasound. Figures
         stated in USD, based on 2018 average exchange rates. ** Modeled based on projecting continuation of the estimated 2013 – 2018 average annual increase in percentage of clinical visits including bloodwork, market clinical visit growth and net price realization

18   © 2020 IDEXX Laboratories, Inc. All rights reserved.
IDEXX Preventive Care is a Turnkey Solution

                                                            We have inspired over 3,800 veterinarians
                                                            to implement preventive care diagnostics

                   Custom profiles that                                              Staff training,
                                                                                                        Client-facing
                     uncover more                                                 implementation and
                                                                                                         materials
                   underlying disease                                                  rewards

19   © 2020 IDEXX Laboratories, Inc. All rights reserved.
IDEXX Preventive Care Testing is Clinically Relevant to all Adult Dogs
     According to an analysis of samples from approximately 30,000 dogs

                                                                                                                                                                                                                                                     65%

                                                                                      At least        1 in 4
                                                                                                           IDEXX Preventive Care blood                                                                                                         56%

                                                                                      and fecal profiles indicate the need for follow-up*                                                                                        47%
                                                                                                 in adult and senior dogs                                                                                           43%
                                                                                                                                                                                                       37%
                                                                                                                                                                                         31%
                                                                               29%
                                                                                                          27%                                                               27%
                                                                                             25%                       25%          25%           24%          25%

                                                                                                      ADULT                                                     SENIOR                                                  GERIATRIC

                                                                                  2            3            4             5            6            7            8             9           10           11           12            13          14    15+

                                                                                                                                                           Dog age (years)
     * Due to “clinically significant findings,” which would indicate the need for follow-up, further consideration, or a change in action by the clinician. Clinical significance based on rules determined by an IDEXX veterinarian panel.
     Source: Data based on analyses of 29,795 canine wellness profiles (Chem 22 including IDEXX SDMA® Test, IDEXX CBC testing with reticulocyte parameters, the Lab 4Dx® Plus Test, and Fecal Dx® antigen testing) associated with wellness visits;
     testing performed at IDEXX Reference Laboratories on July 13, 2016–February 28, 2019. Represented U.S. regions by proportion of included profiles: Northeast (32.0%), South (41.3%), Midwest (17.4%), West (7.6%), and region not reported (1.7%).
     Data on file at IDEXX Laboratories, Inc. Westbrook, Maine USA.

20    © 2020 IDEXX Laboratories, Inc. All rights reserved.
IDEXX Fecal Dx Antigen Profile: Improved Detection of Intestinal Parasites

               • Double the detection and lower cost
               • Detects actual parasite presence – not
                 influenced by egg counts
               • Permits earlier detection
               • Endorsed by industry experts

     * Analysis based on a sample of 442,884 canines, presenting for preventive care visits with fecal exams sent to IDEXX Reference Labs between December, 2015 and June, 2018.

21   © 2020 IDEXX Laboratories, Inc. All rights reserved.
Only ~17% of U.S. Dogs Receive a Full Vector-Borne Disease Screen at the
     Veterinary Practice Annually
                             2019 U.S. Canine Vector-borne Disease Screening at the Veterinary Practice*

                                                                                                            100%           U.S. Family Dogs

                                                                                                            ~ 80 million

                                                                                                               70%         Clinical Visit
                                                                                                                           (at least 1 in 2019)
                                                                                                            ~ 60 million
                                                            Lyme disease
                                                            Heartworm
                                                            Anaplasmosis                                       50%         Preventive Care Visit
                                                                                                                           (at least 1 in 2019)
                                                            Ehrlichiosis
                                                                                                            ~ 40 million

                                                                                               21%             17%         Vector-Borne Test

                                                                                              17 million     14 million
                                                                                        Heartworm only     Full screen
      * Based on analyses of IDEXX Practice Intelligence data and other data sources.

22   © 2020 IDEXX Laboratories, Inc. All rights reserved.
Our Expanding Worldwide CAG Commercial Presence has Supported
     Accelerated CAG Dx Recurring Revenue Growth

                                                                           Rate of Organic Growth of                                                               + 12%
                                                                           Worldwide CAG Diagnostics
                                                                             Recurring Revenue1,2,3                                                         910     950

                                                                                                                                                     775                   Total Worldwide
                             + 8%
                                                                                                                                 674                                       CAG Field-Based
                                                                                                            603
                                                                                                                                                                             Professional
                                                                   437                 465                                                                                   Headcount*
                              390                      398

                             2011                     2012        2013                 2014                 2015                2016                 2017   2018    2019

     • Includes all field-based sales and technical services headcount, excluding management. Figures as of December 31 of each calendar year.
     1,2 Please refer to the Appendix for descriptive footnotes. 3 Non-GAAP financial measure, please refer to Appendix for descriptive footnotes.

23   © 2020 IDEXX Laboratories, Inc. All rights reserved.
Five-Year Potential for Continued 10%+ Annual Revenue Growth
     Driven by Expansion of CAG Diagnostics Recurring Revenue
      IDEXX Total Company Annual Revenue Growth Potential 2024 vs. 2019,
      Constant Currency5                                                                                                                                                                                                 ~2024
                                                                                                                                                               High Single                Mid-to-High
                                                                                                                                                                                          Single Digit
                                                                                                                                                                                                                        Revenue
                                                                                                                                                                  Digit
                                                                                                        10%+
                                                                      12% - 16%                                                                                                                                                10%+
                                                                                                                                                                                                                            Compound Annual
                                                                                                                                                                                                                              Growth Rate

                                                   9% - 13%

               2019
              Revenue
                  $2.4B

                                                    U.S.            International                 Veterinary                    CAG Capital                        Water                        LPD
                                                   CAG Dx             CAG Dx                  Software & Digital

                                                                    CAG Recurring1
     Five-Year potential revenue growth projections were communicated at Investor Day on August 14, 2019. Please refer to our Safe Harbor Disclaimer.   1,5   Please refer to the Appendix for descriptive footnotes.

24    © 2020 IDEXX Laboratories, Inc. All rights reserved.
We are Delivering Against our Long-Term Financial Goals

                                                                                                                                                                                                  Multi-Year
                                                                                2016                        2017                         2018                        2019
                                                                                                                                                                                                   Goals

        Organic Revenue
                                                                               11.4%                       10.4%                       11.6%                       10.3%                                10%+
        Growth3

        Operating Margin Gain                                               170 bps                      140 bps                     130 bps                     120 bps                       50 - 100 bps
        (Comparable Constant Currency)5,6

        EPS Growth                                                               25%                       21%**                         36%                          21%                         15% - 20%
        (Comparable Constant Currency)5,7

                                                                                  ROIC8 of 46% in 2019
     ** 2017 reflects normalized year-over-year share count reduction which adjusts for impact of adopting ASU 2016-09, Compensation-Stock Compensation (Topic 718). Reported share count reduction was 1.4%.
      3, 5, 6, 7, 8 Non-GAAP financial measure, please refer to Appendix for descriptive footnotes.

25   © 2020 IDEXX Laboratories, Inc. All rights reserved.
IDEXX – Long-Term Durable Growth and Returns

                                                            A Durable Recurring Revenue
                                                            Business Model with …
                                                            … Tremendous runway and
                                                              supportive demographic
                                                              trends
                                                            ... Expertly served by IDEXX’s
                                                                differentiated innovation
                                                                and commercial model...
                                                            ... Generating exceptional
                                                                 financial returns.

26   © 2020 IDEXX Laboratories, Inc. All rights reserved.
Footnotes
     1 Recurring Revenue: Companion Animal Diagnostics recurring revenue for Rapid Assay and IDEXX VetLab includes and excludes the following as applicable: Rapid Assay excludes SNAP Pro instrument
     revenues, and IDEXX VetLab includes consumables, service and accessories revenues. Other recurring revenue includes recurring revenue for Veterinary Software Services and Diagnostic Imaging Systems,
     Livestock, Poultry and Dairy (“LPD”), and Water, which include and exclude the following as applicable: Veterinary Software Services and Diagnostic Imaging Systems excludes client server based placements and
     radiography instrument revenues, LPD excludes government-sponsored eradication programs and herd health screening revenues, and Water excludes sealer and filtration instrument revenues.

     2 IDEXX  Reportable Segment Revisions and Divested Revenues: Prior to January 1, 2015, our Companion Animal Group (“CAG”) segment included herd testing diagnostic services processed within and
     managed by our CAG reference laboratories. We have transitioned the responsibility for these diagnostic services to our LPD segment to more effectively align our business with the nature and customers of these
     livestock services. Revenue and revenue growth calculations have been retrospectively revised to reflect this change in the composition of our reportable segments. The impact on CAG Diagnostics recurring
     revenue growth was not material.

     3 Organic    Revenue Growth: Organic revenue growth is a non-GAAP financial measure and represents the percentage change in revenue for a measurement period, as compared to the prior year period(s),
     excluding the impact of changes in foreign currency exchange rates and revenue from business acquisitions. Management believes that reporting organic revenue growth provides useful information to investors
     by facilitating easier comparisons of our revenue performance with prior and future periods and to the performance of our peers. Organic revenue growth should be considered in addition to, and not as a
     replacement of or superior measure to, revenue growth reported in accordance with GAAP. The percentage change in revenue resulting from acquisitions represents incremental revenues attributable to business
     acquisitions that have occurred since the beginning of the prior year period. Effective January 1, 2018, we exclude only acquisitions that are considered to be a business (consistent with ASU 2017‐01, “Business
     Combinations: (Topic 850) Clarifying the Definition of a Business”) from organic revenue growth. For more detail on what acquisitions we consider to be a business in computing organic growth, please see
     Management’s Discussion and Analysis of Financial Conditions and Results of Operations – Results of Operations and Trends – Non‐GAAP Financial Measures, contained in the Company’s Annual Report on
     Form 10‐K for the year ended December 31, 2019 available at www.idexx.com/investors. Currency changes increased total company revenue growth by 0.3% in 2017, 0.7% in 2018, and decreased total company
     revenue by 1.8% in 2019. Revenue from acquisitions increased total company revenue growth by 0.2% in 2017, 0.1% in 2018, and 0.2% in 2019. See tables included in Footnote 4, Normalized Organic Revenue
     Growth for reconciliation of CAG and CAG Diagnostics recurring organic revenue growth to reported growth.

     4 Normalized   Organic Revenue Growth: Normalized organic revenue growth is a non-GAAP financial measure that represents organic revenue growth, normalized for the effects of: (a) our transition to an all-
     direct sales strategy in the U.S., which was effected fully by January 1, 2015, on revenue growth for the relevant period(s) in 2014 and 2015;and (b) the adoption of ASU 2014-09, Revenue from Contracts with
     Customers (the "New Revenue Standard"), primarily related to the modified retrospective restatement in 2018. Management believes that normalized organic revenue growth is a more useful way to measure
     business performance because it enables better period-over-period comparisons of the fundamental financial results by excluding one-time transitional growth rate impacts. Normalized organic revenue growth
     should be considered in addition to, and not as a replacement of or superior measure to, revenue growth reported in accordance with GAAP. During our transition to an all-direct sales strategy, we incurred one-
     time transitional impacts related to the drawdown of distributor inventory in the fourth quarter of 2014, and reported revenues for 2014 have been adjusted to exclude this $25 million impact. Further, during the
     three months ended December 31, 2014, we began recognizing revenue on rapid assay kits and instrument consumables upon delivery to end users in the U.S., instead of at distribution. We also began to
     capture additional revenue that was previously earned by our distribution partners, net of other changes related to this all-direct strategy, such as free next-day shipping and a new returns policy for expired
     product. We refer to this net additional revenue as distributor margin capture, and 2015 revenue has been adjusted ~$40 million to exclude this impact. Effective January 1, 2018, we adopted the New Revenue
     Standard using the modified retrospective method for all contracts not completed as of the date of adoption. We recognized the cumulative effect of initially applying the New Revenue Standard as an adjustment
     to the opening balance of retained earnings.

28     © 2020 IDEXX Laboratories, Inc. All rights reserved.
Footnotes
     4 Normalized      Organic Revenue Growth, continued: See tables below for a reconciliation of normalized and organic CAG and CAG Diagnostics recurring revenue growth to reported growth for the relevant
     periods.
                                  1,2
     CAG Diagnostics Recurring                                2010    2011    2012   2013   2014   2015   2016     2017     2018      2019
     Reported Growth                                           6%     11%     8%      9%    8%     10%    11.7%   13.3%     14.0%     10.5%
                        5
      Currency Impact                                          1%     3%      -2%    -1%    -1%    -6%    -0.7%    0.2%     0.8%      -1.6%
      Acquisition Impact                                       1%     0%      2%      0%    0%     1%     0.3%     0.3%     0.0%      0.2%
     Organic Revenue Growth                                    5%     8%      8%      9%    8%     16%    12.0%   12.8%     13.2%     11.9%
      Distrib utor Inventory Adjustment                                                     0.0%   0.0%
      Margin Capture Adjustment                                                             0.0%   0.0%
      New Revenue Standard Adjustment                                                                                       -1.3%
     Normalized Organic Revenue Growth                         5%     8%      8%      9%    8%     16%    12.0%   12.8%     11.9%     11.9%

              2
     Total CAG                                                2002   2003    2004    2005   2006   2007    2008      2009      2010           2011   2012   2013   2014    2015     2016     2017    2018     2019
     Reported Growth                                          6%     18%     17%     16%    16%     24%     11%      1%         7%            10%    7%     7%     7%      11%      12%      12%      14%        9%
                        5
      Currency Impact                                         1%     4%      3%      0%     0%      3%      1%       -2%        0%            2%     -1%    -1%    -1%     -6%      -1%      0%       1%       -2%
      Acquisition Impact                                                     1%      7%     2%      6%      1%       -2%        1%            0%     1%     0%     0%      1%       0%       0%       0%         0%
     Organic Growth                                           5%     14%     13%     10%    14%     16%     9%       5%         6%            8%     8%     8%     8%      16%      13%      11%      13%     11%
      Distrib utor Inventory Adjustment                                                                                                                            0%      0%
      Margin Capture Adjustment                                                                                                                                    0%      0%
      New Revenue Standard Adjustment                                                                                                                                                                 -3%
     Normalized Organic Revenue Growth                        5%     14%     13%     10%    14%     16%     9%       5%         6%            8%     8%     8%     8%      16%      13%      11%      9%      11%

     5 Constant   Currency: Constant currency references are non-GAAP financial measures and exclude the impact of changes in foreign currency exchange rates. Management believes that constant currency
     information provides valuable supplemental information regarding our revenue and revenue CAGR, operating margin and EPS results because it is consistent with how management evaluates our performance
     and facilitates comparisons with prior and future periods. We estimated the net impacts of currency on our revenue, operating margin, and EPS results by restating results to the average exchange rates or
     exchange rate assumptions for the comparative period, which includes adjusting for the estimated impacts of foreign currency hedging transactions and certain impacts on our effective tax rates. Prior periods
     were restated to current rates and may vary from previously reported constant currency figures. See Footnote 3, Organic Revenue Growth, and Footnote 4, Normalized Organic Revenue Growth for further
     details of currency impacts on revenue growth. See Footnote 7, Comparable Constant Currency Operating Profit Margin and Gain, and Footnote 8, Comparable Constant Currency EPS Growth, for further details
     of currency impacts on operating profit margin and gain and EPS growth, respectively.

29     © 2020 IDEXX Laboratories, Inc. All rights reserved.
Footnotes
     6 ComparableConstant Currency Operating Profits Margin and Gain: Comparable constant currency operating profit margin and gain (or growth) are non-GAAP financial measures and exclude non-
 recurring items, changes in foreign currency exchange rates, and CEO transition charges. Management believes comparable constant currency operating profit margin and gain are more useful ways to
 measure the Company’s business performance than operating profit margin and gain because they enable better period-over-period comparisons of the fundamental financial results by excluding items that
 vary independent of performance and provides greater transparency to investors regarding key metrics used by management. Comparable constant currency operating margin and gain should be considered in
 addition to, and not as replacements of or superior measures to, operating margin and gain reported in accordance with GAAP. Comparable constant currency operating profit margin and gain exclude the effect
 of an $8.2 million non-cash software impairment charge in the third quarter of 2015. The reconciliation of these non-GAAP financial measures is as follows:
                                                                                      For the Year Ended December 31,
     Dollar amounts in thousands                                         2015           2016         2017      2018                2019
     Income from operations                                               $299,912      $350,239     $413,028  $491,335            $552,846
     Operating margin                                                       18.7%          19.7%       21.0%      22.2%              23.0%
     Impairment charge                                                      8,212              -           -          -
     CEO transition charges                                                                                                          13,400
     Comparable income from operations                                    308,124       350,239       413,028        491,335        566,246
     Comparable operating margin                                            19.2%         19.7%         21.0%          22.2%          23.5%
     Change from currency                                                  21,228        24,180          1,051        (1,331)         5,343
     Comparable constant currency income from operations                  329,352       $374,419      $414,079       $490,004       571,589
     Constant currency operating margin                                     19.5%
     Comparable constant currency operating margin gains                  -10 bps       170 bps       140 bps        130 bps        120 bps

     7 Comparable    Constant Currency EPS Growth: Comparable constant currency EPS growth is a non-GAAP financial measure that excludes the tax effects of share-based compensation activity under ASU
     2016-09, CEO transition charges, changes in foreign currency exchange rates, and non-recurring items. Management believes comparable constant currency EPS growth is a more useful way to measure the
     Company’s business performance than EPS growth because it enables better period-over-period comparisons of the fundamental financial results by excluding items that vary independent of performance
     and provides greater transparency to investors regarding a key metric used by management. Comparable constant currency EPS growth excludes: the effect of an $8.2 million non-cash software impairment
     charge in the third quarter of 2015; the impact of the Company’s adoption of share-based compensation accounting change (ASU 2016-09) for the periods after its adoption on January 1, 2017; a one-time
     negative impact related to the 2017 Tax Cuts and Jobs Act (“U.S. Tax Reform”); and a discrete tax benefit related to the utilization of foreign tax credits in 2017. The reconciliation of this non-GAAP financial
     measure is as follows:
                                                                         For the Year Ended December 31,
                                                              2015        2016          2017       2018                  2019
     Earnings per share (diluted)                                $2.05        $2.44          $2.94          $4.26               $4.89
     Impairment charge                                           $0.06           -                -              -              -
     CEO transition charges                                                                                                   0.14
     Impact of adoption of ASU 2016-09                                           -          (0.30)         (0.24)           (0.22)
     Impact of U.S. Tax Reform                                                   -            0.34             -                -
     Impact of foreign tax credit utilization                                    -          (0.04)             -                -
     Comparable EPS                                              $2.11        $2.44          $2.94          $4.02            $4.81
     Change from currency                                           -         0.20            0.02         (0.01)             0.05
     Comparable constant currency EPS                            $2.11        $2.64          $2.96          $4.01            $4.86
     Comparable constant currency EPS Growth                                   25%            21%            36%                21%

30     © 2020 IDEXX Laboratories, Inc. All rights reserved.
Footnotes
     8 After-Tax Return on Invested Capital, Excluding Cash and Investments (“ROIC”): After-tax return on invested capital, excluding cash and investments, is a non-GAAP financial measure, that
     represents our after-tax income from operations, divided by our average invested capital, excluding cash and investments, using beginning and ending balance sheet values. After-tax return on
     invested capital, excluding cash and investments, after-tax income from operations and average invested capital, excluding cash and investments, are not measures of financial performance under
     GAAP and should be considered in addition to, and not as replacements of or superior measures to, return on assets, net income, total assets or other financial measures reported in accordance with
     GAAP. Management believes that reporting after-tax return on invested capital, excluding cash and investments, provides useful information to investors for evaluating the efficiency and effectiveness
     of our use of capital. The reconciliation of this non-GAAP financial measure is as follows:
                                                                                          For the Year Ended December 31,
     Numerator (amounts in millions)                                                                                2019
     Income from operations (as reported)                                                       $       491       $    553
                                            *
     After-tax income from operations                                                           $       405       $        453

                                                                                                 As of December 31,
     Denominator (dollar amounts in millions)                                                       2018              2019
     Total shareholders’ equity (deficit)                                                       $       (10)      $        177
         Noncontrolling interest                                                                $       -         $        -
         Line of credit                                                                         $       399       $        289
         Long-term deb t                                                                        $       601       $        699
         Deferred income tax assets                                                             $           (8)   $            (8)
         Deferred income tax liab ilities                                                       $          29     $          33
     Total invested capital                                                                     $     1,011       $     1,190
         Less cash & marketab le securities                                                     $       124       $          90
     Total invested capital, excluding cash and investments                                     $       887       $     1,100
                                                                **
     Average invested capital, excluding cash and investments                                   $       820       $        994
     After-tax return on invested capital, excluding cash and investments                              49%                 46%

     * After-tax income from operations represents income from operations reduced b y our reported effective tax rate of
     18.1%.
     ** Average invested capital, excluding cash and investments, represents the average of the amount of total invested
     capital, excluding cash and investments.

31       © 2020 IDEXX Laboratories, Inc. All rights reserved.
You can also read