Performance and Thermal Perceptions of Runners Competing in the London Marathon: Impact of Environmental Conditions - MDPI
←
→
Page content transcription
If your browser does not render page correctly, please read the page content below
International Journal of
               Environmental Research
               and Public Health

Article
Performance and Thermal Perceptions of Runners Competing
in the London Marathon: Impact of Environmental Conditions
Tim Vernon * , Alan Ruddock                       and Maxine Gregory

                                            Sport and Physical Activity Research Centre, Department of Sport and Physical Activity, Sheffield Hallam
                                            University, Sheffield S10 2BP, UK; a.ruddock@shu.ac.uk (A.R.); m.gregory@shu.ac.uk (M.G.)
                                            * Correspondence: t.vernon@shu.ac.uk; Tel.: +44-(0)-114-225-5761

                                            Abstract: The 2018 Virgin Money London Marathon (2018 VMLM) was the hottest in the race’s
                                            37-year history. The aims of this research were to (1) survey novice mass participation marathoners
                                            to examine the perceptual thermal demands of this extreme weather event and (2) investigate the
                                            effect of the air temperature on finish times. A mixed-methods design involving the collection
                                            of survey data (n = 364; male = 63, female = 294) and secondary analysis of environmental and
                                            marathon performance (676,456 finishers) between 2001 and 2019 was used. The 2018 VMLM
                                            mean finishing time was slower than the mean of all other London marathons; there were positive
                                            correlations between maximum race day temperature and finish time for mass-start participants,
                                            and the difference in maximum race day temperature and mean maximum daily temperature for the
                                            60 days before the London Marathon (p < 0.05). Of the surveyed participants, 23% classified their
                                            thermal sensation as ‘warm’, ‘hot’ or ‘very hot’ and 68% ‘thermally comfortable’ during training,
                                  compared with a peak of 95% feeling ‘warm’, ‘hot’ or ‘very hot’ and 77% ‘uncomfortable’ or ‘very

                                            uncomfortable’ during the 2018VMLM. Organisers should use temperature forecasting and plan
Citation: Vernon, T.; Ruddock, A.;          countermeasures such as adjusting the start time of the event to avoid high temperatures, help runners
Gregory, M. Performance and
                                            predict finish time and adjust pacing strategies accordingly and provide safety recommendations for
Thermal Perceptions of Runners
                                            participants at high-risk time points as well as cooling strategies.
Competing in the London Marathon:
Impact of Environmental Conditions.
                                            Keywords: running; endurance; heat; thermoregulation; weather; cooling
Int. J. Environ. Res. Public Health 2021,
18, 8424. https://doi.org/10.3390/
ijerph18168424

Academic Editor: Paul B. Tchounwou          1. Introduction
                                                 Over one million runners participate in marathons annually [1], with the Virgin
Received: 14 June 2021                      Money London Marathon (VMLM) attracting around 40,000 participants. The demands of
Accepted: 7 August 2021                     marathon running are considerable irrespective of performance standard; the energy expen-
Published: 10 August 2021                   diture of female and male runners finishing between 2 and 4 h is within the region of 2000
                                            to 2800 kcal, placing extensive strain on metabolic, cardiorespiratory, thermophysiological,
Publisher’s Note: MDPI stays neutral        mechanical and perceptual regulatory systems [2,3]. Such demands are intensified in hot
with regard to jurisdictional claims in     and humid conditions where finishing times are impaired [4–6], and in-race withdrawals
published maps and institutional affil-     increase, particularly when air temperature exceeds 20 ◦ C [6].
iations.
                                                 Substantial evidence supports the increased likelihood of extreme global weather
                                            events in the forthcoming decades, including periods of unseasonably cold and hot weather.
                                            In February and March 2018, the UK experienced two severe winter weather events with
                                            unseasonably low temperatures and significant snowfall [7]. For runners preparing for
Copyright: © 2021 by the authors.           the VMLM, these low temperatures posed logistical training demands (icy roads) and
Licensee MDPI, Basel, Switzerland.          altered perceptual and physiological responses, potentially impairing preparation for a
This article is an open access article      spring marathon. These weather events were followed by unseasonably high temperatures
distributed under the terms and             between the 18th and 22nd of April, including the UK’s warmest April day since 1949 at
conditions of the Creative Commons
                                            29.1 ◦ C. This coincided with the hottest London Marathon on record of 24.1 ◦ C that took
Attribution (CC BY) license (https://
                                            place on Sunday 22nd April 2018 (10 am start), with many mass participation runners still
creativecommons.org/licenses/by/
                                            on course when this temperature was recorded. These data, however, do not capture the
4.0/).

Int. J. Environ. Res. Public Health 2021, 18, 8424. https://doi.org/10.3390/ijerph18168424                       https://www.mdpi.com/journal/ijerph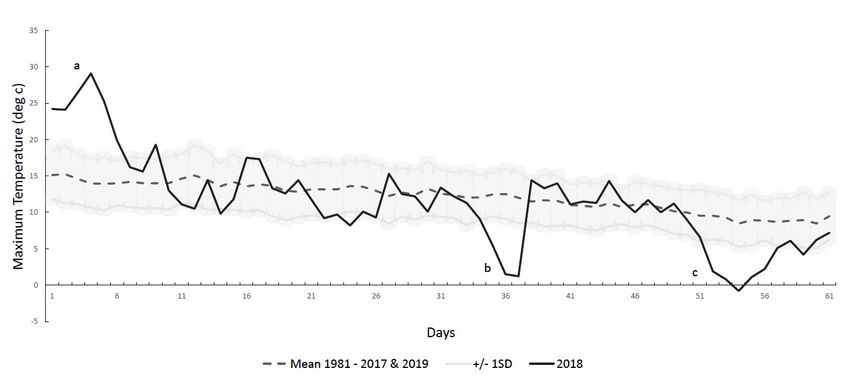
Int. J. Environ. Res. Public Health 2021, 18, 8424                                                                                  2 of 9

                                        potential environmental demands within the microclimate on course, whereby runners
                                        grouped nearby can experience increases in mean radiant temperature of 2 ◦ C and humidity,
                                        coupled with decreases in radiative and convective heat transfer, increasing autonomic
                                        thermoregulatory challenges [8]. It is unclear how thermal sensation and comfort, which
                                        are integral to behavioural thermoregulation and dominant factors that dictate perceived
                                        exertion in hot conditions [9], are influenced in these specific environments. Furthermore, in
                                        the final weeks and days of marathon preparation, runners were faced with two conflicting
                                        extreme weather events. In the future, extreme weather events are likely to increase in
                                        either frequency and/or severity, posing risks to the short- and long-term health and
                                        wellbeing of marathon runners.
                                              As such, the aims of this research were to (1) identify historical temperature data for all
                                        London Marathons to place the extreme weather events of 2018 in context and (2) survey a
                                        sample of novice mass participation marathoners who started the 2018 VMLM to examine
                                        the thermal demands of the extreme weather event on race day. This investigation is the
                                        first in the context of the London marathon and warranted on the basis of (1) the addition
                                        to our knowledge and understanding of perceptual demands of mass participation runners
                                        in the Virgin Money London Marathon and (2) identification of potential areas whereby
                                        participants and race organisers might seek to change their practice in preparation for, or
                                        on the day of, the event when high temperatures are forecast.

                                        2. Materials and Methods
                                        2.1. Research Design
                                             A mixed-methods design involving the collection of survey data and the analysis of
                                        environmental and marathon performance data was used to examine the experiences of
                                        and the effects of air temperature on participants running a marathon in the heat. The
                                        local ethics committee approved the study (ER6896994). All participants provided digital
                                        informed consent, and the investigation was conducted in accordance with the Declaration
                                        of Helsinki (7th revision).

                                        2.2. Participants
                                             The finish times of 676,456 finishers (male, 450,071; female, 226,385) of the London
                                        Marathon from 2001 to 2019 were extracted from the official website of the VMLM [10] and
                                        the marathon archives website [11]. This included the 40,179 participants who completed
                                        the 2018 VMLM (male, 23,701; female, 16,478).
                                             A random sample of participants (n = 364; male = 63, female = 294; age = 41.4 ± 8.3 years;
                                        mass = 72.2 ± 19.9 kg; stature = 168.6 ± 9.5 cm) from the 2018 VMLM (subsequently
                                        referred to as survey participants) completed an online survey relating to their expectations
                                        and experiences of the event, including expected and actual finish time, perception of
                                        temperature and thermal comfort during the marathon and during training over the winter
                                        months. The survey was distributed 7 days post-event via social media platforms and
                                        hosted on the Key Survey platform (www.keysurvey.co.uk—accessed 1 April 2018). The
                                        group was mostly inexperienced, with the 2018 VMLM being the first marathon for 63% of
                                        runners; 33% of runners had participated in between two and five marathons and only 4%
                                        had run more than six marathons.
                                             Participants were not invited to comment on the study design; however, they were
                                        consulted during the writing of a plain language summary for dissemination to their peers
                                        and distribution to participant groups.

                                        2.3. Data Analysis
                                             Hourly temperature data (◦ C) were acquired from the UK’s National Meteorological
                                        Service (the Met Office) for the date of the London Marathon and the preceding 60 days
                                        for the years 1981 to 2019. These data were recorded as per the Met Office standards at a
                                        meteorological station located in St James’s Park London, chosen for its central location
                                        on the London Marathon route. Data were processed, plotted and analysed alongside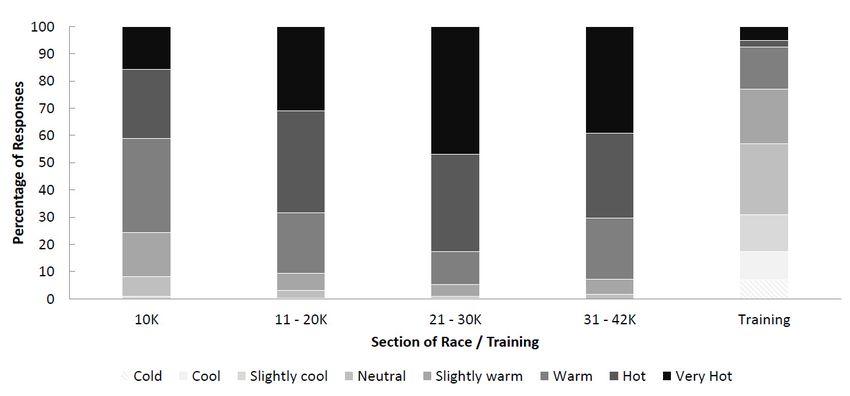
meteorological station located in St James’s Park London, chosen for its central location
                                      on18,the
Int. J. Environ. Res. Public Health 2021,    8424London Marathon route. Data were processed, plotted and analysed alongside                    3 of 9
                                      marathon performance data using customised Microsoft Excel Software (Microsoft Corp,
                                      2013) and SPSS (Version 24.0. Armonk, NY: IBM Corp) and assumptions for parametric
                                      statistical analyses were performed. Pearson product-moment correlation was used to in-
                                         marathon performance data using customised Microsoft Excel Software (Microsoft Corp,
                                      vestigate    relationships between maximum race day air temperature and the differential
                                         2013) and SPSS (Version 24.0. IBM Corp, Armonk, NY, USA) and assumptions for paramet-
                                      temperature between race day temperature and average maximum temperature for the
                                         ric statistical analyses were performed. Pearson product-moment correlation was used to
                                      previous 60 days (race day temp–average max temp over previous 60 days) on the average
                                         investigate relationships between maximum race day air temperature and the differential
                                      London      Marathon
                                         temperature     betweenfinish  time
                                                                     race  daybetween     2001and
                                                                                temperature     andaverage
                                                                                                     2019. Thresholds     of 0.1, 0.3 and
                                                                                                            maximum temperature             for0.5
                                                                                                                                                thefor
                                      small,
                                        previousmoderate
                                                    60 daysand(racelarge  correlations [12]
                                                                     day temp–average      maxand  0.7over
                                                                                                temp    andprevious
                                                                                                            0.9 for very    large
                                                                                                                      60 days)   onand     extremely
                                                                                                                                     the average
                                      large   correlations    [13]  were    used  to interpret  relationships   between    variables.
                                         London Marathon finish time between 2001 and 2019. Thresholds of 0.1, 0.3 and 0.5 for            Independ-
                                      ent   t-tests
                                         small,     were performed
                                                 moderate                  to assess the[12]
                                                              and large correlations       difference  in London
                                                                                              and 0.7 and           Marathon
                                                                                                           0.9 for very  large andfinish    times, air
                                                                                                                                      extremely
                                      temperature      and expected
                                         large correlations     [13] wereversus
                                                                            used toactual  finish
                                                                                      interpret   time from survey
                                                                                                relationships  between  respondents.       Statistical
                                                                                                                          variables. Indepen-
                                      significance
                                         dent t-tests was
                                                       wereset    at p < 0.05.
                                                              performed          Thermal
                                                                            to assess       sensationin
                                                                                       the difference  [14] and comfort
                                                                                                         London   Marathon   data   [15]times,
                                                                                                                               finish      wereair ana-
                                         temperature
                                      lysed              and expected
                                               using a Friedman       test versus  actual finish time
                                                                           and Dunn-Bonferroni         from
                                                                                                     post   survey
                                                                                                          hoc         respondents.
                                                                                                               test, and  statistical Statistical
                                                                                                                                       significance
                                      wassignificance   0.05.set at p < 0.05. Thermal sensation [14] and comfort data [15] were analysed
                                             set at p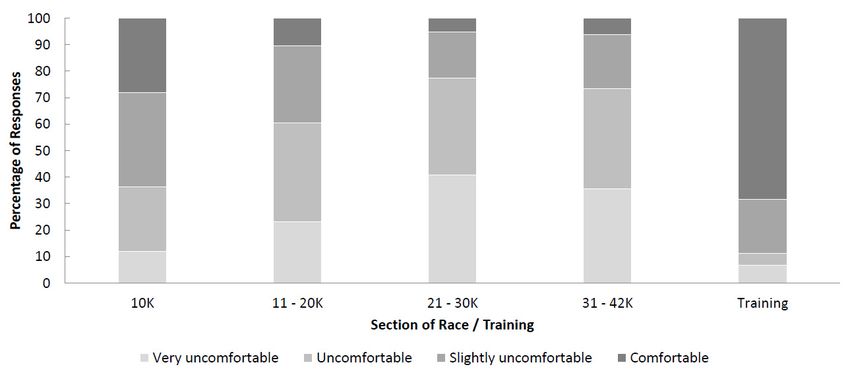
Int. J. Environ. Res. Public
Int. J. Environ. Health
Res. Public 2021,2021,
Health 18, x18, 8424 4 of49 of 9
Int. J. Environ. Res. Public Health 2021, 18, x 4 of 9
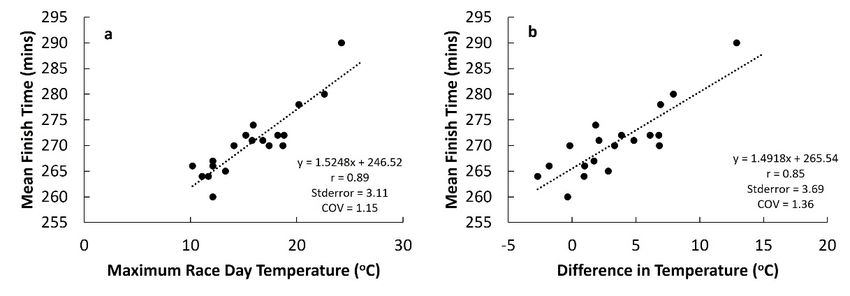
Figure 2. (a) Relationship between maximum race day temperature and mean finish time in the London Marathon 2001 to
Figure 2. (a) Relationship
Figure between
2. (a) Relationship maximum
between maximum racerace
dayday
temperature
temperatureand andmean
meanfinish
finish time in
in the
theLondon
LondonMarathon
2019. (b) Relationship between the difference in maximum race day temperature and maximum daily temperature during
Marathon 2001
2001 to to
2019.
2019. (b) (b) Relationship
Relationship between
between the difference
the difference in maximum
in maximum race
race daytemperature
day temperatureand and maximum
maximum daily
dailytemperature
temperature during
during
the 60 days prior to race day on mass participation and mean finish time in the London Marathon 2001 to 2019; stderror,
the 60 the
days 60prior
days prior
to race to day
race on
daymass
on mass participation
participation andand mean
mean finishtime
finish timeininthe
the London
London Marathon
Marathon20012001toto2019;
2019;stderror,
stderror,
standard
standard error
errorofofthe estimate;
the COV,
estimate; COV, coefficient ofof
coefficient variation.
variation.
standard error of the estimate; COV, coefficient of variation.
The mean finish time of survey participants for the 2018 VMLM (Figure 3) was
The The
meanmean finish time of survey participants for
for the 2018 VMLM (Figure 3)3)
was 337337
± ±
337 ± 51 min,finish
slowertime
than of
thesurvey
overallparticipants
mean finish time the 2018
for the VMLM
2018 VMLM (Figure
of 290 ± was
64 min
51 min, slower than the overall mean finish time for the 2018 VMLM of 290 ± 64 min and
51 min,
and 47slower
± 30 than
min orthe14%
overall mean
slower thanfinish time for
the survey the 2018 VMLM
participants reportedofestimated
290 ± 64 min
timeand
47 ± 30 min or 14% slower than the survey participants reported estimated time (p < 0.05).
47 ±(p30
< 0.05).
min or 14% slower than the survey participants reported estimated time (p < 0.05).
Figure3.3.Estimated
Figure Estimatedversus
versusactual
actualfinish
finishtimes
timesininthe
the2018
2018VMLM
VMLMfor
forsurvey
surveyparticipants.
participants.
For
Forthose
thosewhowhohadhadrunrunmarathons
marathonspreviously,
previously,the
themean
meanfinish
finishtime
timefor
forthe
the2018
2018
VMLM
Figure 3. was 40
Estimated ±
VMLM was 40 ± 27 min slower than their previous best marathon time (317 ± 7171
27 min
versus slower
actual than
finish their
times in previous
the 2018 best
VMLM marathon
for surveytime (317 ±
participants. min
min vs.
vs.
278278
± 60±min;
60 min; p < 0.05).
p < 0.05). Out Out ofrunners
of 101 101 runners whopreviously
who had had previously
run a run a marathon,
marathon, one
one runner
runner ran in
Forfaster
ran thosefaster
2018inVMLM
who 2018run
had VMLM by approximately
by marathons
approximately 1 min.1 min.
previously, the mean finish time for the 2018
VMLM was 40 ± 27 min slower than their previous best marathon time (317 ± 71 min vs.
278 ± 60 min; p < 0.05). Out of 101 runners who had previously run a marathon, one runner
ran faster in 2018 VMLM by approximately 1 min.Int. J. Environ. Res. Public Health 2021, 18, x 5 of 9
Int. J. Environ. Res. Public Health 2021, 18, 8424 5 of 9
3.3. Perception of Heat
3.3. Perception of Heat sensation, an eight-point scale (very cold (1) to very hot (8), ‘very
To assess thermal
hot’ added to the original
To assess thermal ASHRAEan
sensation, 2017 scale) was
eight-point used
scale to ask
(very participants,
cold (1) to very‘How hot‘very
hot (8), did
you
hot’feel
addedduring
to thetheoriginal
marathon, and how
ASHRAE does
2017 thiswas
scale) compare
used towith
askyour training?’‘How
participants, They hot
re-
ported
did youfeeling hotterthe
feel during (pInt. J. Environ. Res. Public
Int. J. Environ. Health
Res. Public 2021,
Health 18, 18,
2021, x 8424 6 of 9 6 of 9
Figure 5. Thermal
Figure comfort
5. Thermal during
comfort during2018
2018VMLM andaatypical
VMLM and typical training
training session
session during
during winter/spring
winter/spring in the
in the UK UK in prepara-
in preparation
tion for
forthis
this event.
event.
4. Discussion
4. Discussion
ToTo ourourknowledge,
knowledge, this this investigation
investigationisisthe thefirst to to
first analyse
analysehistorical
historicalweatherweatherdata ofdata of
the London Marathon in the context of previous weather data, assess thermoperceptual
the London Marathon in the context of previous weather data, assess thermoperceptual
demands and determine the effect of ambient temperature on the finish time of runners.
demands and from
The findings determine the effect are
this investigation of ambient
that: (1) Thetemperature
2018 VMLMon thehotter
was finish time
than theof runners.
mean
Theof findings from this
all other London investigation
Marathons. (2) Theare 2018that:
VMLM (1) mean
The 2018 VMLM
finishing time waswasslowerhotterthan than the
mean
the of
meanall other London
of all other London Marathons.
Marathons. (2) (3)
The In2018 VMLM
accordance mean
with the finishing
aforementioned time was major slower
than the mean
findings, of all other
we found a positiveLondon Marathons.
correlation between (3) maximum
In accordance withtemperature
race day the aforementioned
and
finish
major time forwe
findings, mass participants,
found a positive whereby a hotter
correlation temperature
between maximumwas related
race day to atemperature
slower
andfinish
finishtime.time(4) We
for also
mass found a positive correlation
participants, whereby abetween hotter the difference in
temperature wasmaximum
related to a
race day temperature and the mean maximum daily
slower finish time. (4) We also found a positive correlation between the difference temperature for the 60 days prior
in max-
to the London Marathon, whereby a hotter race day temperature compared with mean
imum race day temperature and the mean maximum daily temperature for the 60 days
training temperature resulted in a slower marathon finish time. (5) Only 23% of surveyed
prior to the London
participants classified Marathon,
their thermal whereby a hotter
sensation as ‘warm’,race ‘hot’
day ortemperature
‘very hot’ during compared their with
mean training
training period temperature
compared with resulted
a peak in a slower
of 95% marathon
of participants finish
feeling time.‘hot’
‘warm’, (5) Only
or ‘very23% of
surveyed
hot’ during the 2018 VMLM. (6) A total of 68% of surveyed participants felt ‘comfortable’ dur-
participants classified their thermal sensation as ‘warm’, ‘hot’ or ‘very hot’
ingwith
theirtheir
training
body period
temperature comparedduringwith a peak
training, of 95%a of
whereas peakparticipants
of 77% felt feeling ‘warm’, ‘hot’
‘uncomfortable’
or ‘very
or ‘very hot’uncomfortable’
during the 2018 during the 2018
VMLM. (6)VMLM.
A total of 68% of surveyed participants felt ‘com-
fortable’ Ourwithfindings
their that
body thetemperature
2018 VMLM during was hotter and thewhereas
training, finish time slowerofthan
a peak 77%previous
felt ‘uncom-
London Marathons are in accordance
fortable’ or ‘very uncomfortable’ during the 2018 VMLM. with previous research indicating that finish times are
slower in hot conditions compared with cooler conditions [4–6]. Predictions of performance
Our findings that the 2018 VMLM was hotter and the finish time slower than previ-
impairment based on ambient temperature suggest a decrease in finish time between 1.5
ousandLondon Marathons are in accordance with previous research indicating that finish
2% for every 5 ◦ C increase in ambient temperature above 10–12 ◦ C [16,17]. Our
times
data,are slower
which relatein specifically
hot conditions to ourcompared
sample from withthe cooler
Londonconditions
Marathon with [4–6].meanPredictions
finish of
performance impairment based on ambient temperature
times between 260 and 290 min, suggest there is approximately a 2.8% decrease in finish suggest a decrease in finish time
between
time for 1.5every
and 52% ◦ Cfor everyin
increase 5 °C increase
ambient in ambient
temperature 12 ◦ C. Anabove
temperature
above 10–12 °C
approximate 2.6%[16,17].
decrease in finish time for every 5 ◦ C increase in temperature differential is also evident
Our data, which relate specifically to our sample from the London Marathon with mean
when
finish considering
times between the difference
260 and 290between maximum
min, suggest there race
is day temperature aand
approximately 2.8%thedecrease
mean in
temperature 60 days before the London Marathon. This
finish time for every 5 °C increase in ambient temperature above 12 C. An approximate knowledge is important
° because
it could be used before any London marathon to adjust pacing strategies by taking into
2.6% decrease in finish time for every 5 °C increase in temperature differential is also evi-
account the St James Park weather forecast. For example, a runner with an expected
dent when considering the difference between maximum race day temperature and the
finish time of 3 h 59 min derived from training data before the London Marathon at a
mean
mean temperature
temperature 60 days
of 12 beforeneed
◦ C would thetoLondon
adjust theirMarathon.
performance Thistime
knowledge is important
by approximately
because it could be used before any London marathon to adjust pacing strategies by taking
into account the St James Park weather forecast. For example, a runner with an expected
finish time of 3 h 59 min derived from training data before the London Marathon at a
mean temperature of 12 °C would need to adjust their performance time by approximately
5.6%, from a mean pace of 5:40 min/km to 5:59 min/km if the expected maximum daily
temperature at St James Park was forecast to be 22 °C.Int. J. Environ. Res. Public Health 2021, 18, 8424 7 of 9
5.6%, from a mean pace of 5:40 min/km to 5:59 min/km if the expected maximum daily
temperature at St James Park was forecast to be 22 ◦ C.
Based on the 2018 VMLM temperature data, the expected performance decrement
was approximately 6.6%; however, our sample of runners experienced a 14% decrement in
finish time compared with their estimated finish time. Although we are not able to confirm
the reasons for this difference, one explanation for this discrepancy might be accounted
for by the pacing strategies employed by respondents who attempted to start the race
at their expected race pace rather than adjust their pace to offset the impact of higher-
than-expected temperatures on thermophysiological, energetic and perceptual demands.
This discrepancy may be further accounted for by increases in microclimate temperature,
in particular an increase in relative humidity caused by evaporative heat loss through
sweating and respiration in our sample of runners, who were likely running together in
tight groups with limited airflow. Indeed, 101 runners in the present sample ran slower
than their previous marathon best, indicating that the environmental conditions in the lead-
up to the marathon and on the day of the event influenced performance to a large extent.
However, it is also likely that the expected finish time of runners would be faster than their
actual completion time even in typical temperatures, given that most runners in this sample
were novices and runners, in general, are optimistic about their performances before a
race. The complex interactions between environmental conditions, pacing strategies and
runners’ previous experience likely account for this 14% discrepancy. This discrepancy
highlights the importance of monitoring training data in the weeks before a marathon to
accurately predict finish time before taking into account the impact of weather on health,
wellbeing and performance.
Only 23% of surveyed participants classified their thermal sensation as ‘warm’, ‘hot’
or ‘very hot’, respectively, during their training period compared with a peak of 95% of
participants feeling ‘warm’, ‘hot’ or ‘very hot’ during the 2018 VMLM. Moreover, 68%
of surveyed participants felt their thermal comfort during training was ‘comfortable’,
whereas a peak of 77% felt ‘uncomfortable’ and ‘very uncomfortable’ during the 2018
VMLM. During exercise in hot environments, the two key inputs directly related to the
rating of perceived exertion (RPE) are the rate of increase in and/or magnitudes of thermal
sensation, thermal comfort and cardiovascular strain [9]. Initial predictions regarding the
intensity of exercise are primarily made based upon skin temperature, which has a large
influence on ratings of thermal comfort and thermal sensation, followed by cardiovascular
strain and ventilatory rate (breathlessness). It is possible that at the start of the marathon,
when ratings of thermal sensation and comfort were more similar to training, RPE and,
thus, pacing were also the same. Ratings of thermal sensation and comfort are important
from both thermoregulatory and homeostatic perspectives as increases in both likely reflect
an increase in whole-body thermophysiological demand, in particular body temperature
and significant cardiovascular challenges to maintain homeostasis. Approximately 70% of
respondents felt ‘hot’ from 11–20 km, peaking at 80% between 21–30 km, compared with
40% in the first 10 km. We do not have medical records accompanying these data; however,
previous research conducted on the 2007 London Marathon, which was also relatively
hot (air temperature = 19.1 ◦ C) compared with previous years (air temperature = 11.6 ◦ C),
reported a mean finish time 17 min slower than previous years. In the 2007 London
Marathon, there were 5032 runners treated by St John’s Ambulance, 73 hospitalisations,
6 cases of severe electrolyte imbalance and 1 death (hyponatraemia) compared with the
2008 London Marathon (air temperature = 9.9 ◦ C) in which the number of runners treated
was 4000. It is not possible to isolate heat-related issues within these figures [18]; however,
there is an association between the percentage of withdrawals from races and increasing
air temperature over 15 ◦ C [6]. Given the several risk factors associated with exercise in
hot environments [19], global recommendations for event cancellation based on Wet Bulb
Globe Temperature (WBGT) should be considered as a guide [20]. The American College
of Sports Medicine [21] and Roberts [18] suggest that non-elite runners should be closely
monitored, and event organisers should also consider the cancellation of the event if theInt. J. Environ. Res. Public Health 2021, 18, 8424 8 of 9
WBGT is within the range of 18.4 ◦ C and 22.2 ◦ C. These recommendations, however, do
not take into account the acclimation state of runners and given the unseasonably low
temperatures preceding the 2018 VMLM, it is reasonable to assume that the majority of
mass participation runners, who trained in the UK, would not have had the opportunity to
prepare in environmental conditions similar to race day. Indeed, our analysis suggests a
strong relationship between the difference in maximum race day temperature and the mean
maximum daily temperature for the 60 days before the London Marathon (Figure 2b).
4.1. General Practical Recommendations
Organisers of marathons, especially those in the United Kingdom and Northern
Europe, should follow existing guidance on exercise in hot environments, particularly
regarding fluid balance and provision of practical cooling strategies [20,22]. Specifically,
organisers should (1) keep detailed logs of environmental temperature in the preparatory
phases leading up to the event, use temperature forecasting and plan countermeasures
such as adjusting the start time of the event to avoid high temperatures; (2) help runners
predict finish time and adjust pacing strategies accordingly using temperature-based data
analysis; and (3) use data regarding thermal perception to provide recommendations for
participants regarding high-risk time points of events to help alleviate discomfort.
4.2. Limitations
The demographics of the survey respondents are not a fully representative sample
of those participating in the marathon, as our sample were predominantly female, of
middle age and slower than the average runner. The survey was released 7 days after the
marathon, increasing the reliance on respondents to accurately recall events from race day.
The weather data measured at St James’s Park, London, was chosen for its central location
but may not be representative of the weather along the entire course. Similarly, while it is
appreciated that not all marathon participants would have prepared for the marathon in or
around London, the use of this meteorological site to quantify the extreme cold events in
Spring 2018 allowed direct comparison with race day temperatures on the marathon course.
The extreme weather events experienced in London and captured in the data from the St
James’s Park London station in the lead-up to the 2018 VMLM are used as a reflection of the
conditions that were experienced across the rest of the UK and large parts of Europe. While
we are able to conclude that a runner’s pace slows with increased race day temperature,
we are unable to identify whether this is a conscious decision or a subconscious response
to the increased physiological demand placed on them by the high temperature.
Future research should aim to capture the responses of a more representative sample
of runners, initiate and capture data earlier and collect primary data during the marathon
using wearable sensors and multiple environmental condition sensors along the course.
5. Conclusions
The 2018 VMLM was hotter than previous marathons; this subsequently slowed
runners finishing time and made runners feel ‘very hot’ and ‘uncomfortable’ for the
majority of the race. Our findings have several practical implications, most notably the
utilisation of a specific analysis on predicted race day temperature and expected finish
time, as well as the identification of time points of the race that coincide with increased
thermal demand. Integrating a range of strategies highlighted as a result of this research
could help make the race safer and more enjoyable for mass participation runners.
Author Contributions: Conceptualization, T.V., M.G. and A.R.; methodology, T.V., M.G. and A.R.;
software, M.G.; validation, T.V., M.G. and A.R.; formal analysis, T.V., M.G. and A.R.; data curation,
T.V., M.G. and A.R.; writing—original draft preparation, T.V., M.G. and A.R.; writing—review and
editing, T.V., M.G. and A.R.; visualization, T.V.; supervision, A.R.; project administration, T.V. All
authors have read and agreed to the published version of the manuscript.
Funding: This research received no external funding.Int. J. Environ. Res. Public Health 2021, 18, 8424 9 of 9
Institutional Review Board Statement: The study was conducted according to the guidelines of
the Declaration of Helsinki and approved by the Ethics Committee of Sheffield Hallam University
(Converis number ER6896994, 22 May 2018).
Informed Consent Statement: Informed consent was obtained from all subjects involved in
the study.
Data Availability Statement: All meteorological and race data are available online at the websites of
the Met Office and the VMLM. Aggregated and anonymised survey data are available on request.
Conflicts of Interest: The authors declare no conflict of interest.
References
1. Available online: https://runrepeat.com/research-marathon-performance-across-nations/ (accessed on 21 February 2020).
2. Loftin, M.; Sothern, M.; Koss, C.; Tuuri, G.; Vanvrancken, C.; Kontos, A.; Bonis, M. Energy expenditure and influence of
physiologic factors during marathon running. J. Strength Cond. Res. 2007, 21, 1188–1191. [PubMed]
3. Billat, V.L.; Demarle, A.; Slawinski, J.; Paiva, M.; Koralsztein, J.P. Physical and training characteristics of top-class marathon
runners. Med. Sci. Sports Exerc. 2001, 33, 2089–2097. [CrossRef]
4. Vihma, T. Effects of weather on the performance of marathon runners. Int. J. Biometeorol. 2009, 54, 297–306. [CrossRef] [PubMed]
5. Montain, S.J.; Ely, M.; Cheuvront, S.N. Marathon Performance in Thermally Stressing Conditions. Sports Med. 2007, 37, 320–323.
[CrossRef] [PubMed]
6. El Helou, N.; Tafflet, M.; Berthelot, G.; Tolaini, J.; Marc, A.; Guillaume, M.; Hausswirth, C.; Toussaint, J.-F. Impact of Environmental
Parameters on Marathon Running Performance. PLoS ONE 2012, 7, e37407. [CrossRef] [PubMed]
7. Christidis, N.; Stott, P.A. The Extremely Cold Start of the Spring of 2018 in the United Kingdom. Bull. Am. Meteorol. Soc. 2020,
101, S23–S28. [CrossRef]
8. De Freitas, C.R.; Dawson, N.J.; Young, A.A.; Mackey, W.J. Microclimate and heat stress of runners in mass participation events. J.
Clim. Appl. Meteorol. 1984, 24, 184–191. [CrossRef]
9. Flouris, A.D.; Schlader, Z.J. Human behavioral thermoregulation during exercise in the heat. Scand. J. Med. Sci. Sports 2015, 25,
52–64. [CrossRef] [PubMed]
10. London Marathon Race Reports. Available online: https://www.virginmoneylondonmarathon.com/en-gb/news-media/media-
resources/race-reports/ (accessed on 21 February 2020).
11. London Marathon—Race Results. Available online: http://www.marathonguide.com/ (accessed on 21 February 2020).
12. Cohen, J. Statistical Power Analysis for the Behavioural Sciences, 2nd ed.; Lawrence Erlbaum: Hillsdale, NJ, USA, 1988.
13. Hopkins, W.; Marshall, S.; Batterham, A.; Hanin, J. Progressive Statistics for Studies in Sports Medicine and Exercise Science. Med.
Sci. Sports Exerc. 2009, 41, 3–13. [CrossRef] [PubMed]
14. ASHRAE. ANSI/ASHRAE Standard 55-2017: Thermal Environment Conditions for Human Occupancy; American National
Standards Institute (ANSI). 2017. Available online: https://www.techstreet.com/ashrae/ashrae_standards.html (accessed on 9
August 2021).
15. Parsons, K. Human Thermal Environments: The Effects of Hot, Moderate, and Cold Environments on Human Health, Comfort, and
Performance, 3rd ed.; CRC Press: Boca Raton, FL, USA, 2014.
16. Frederick, E.C. Hot times. Running 1983, 9, 51–53.
17. Daniels, J. Daniel’s Running Formula; Human Kinetics: Champaign, IL, USA, 1988.
18. Roberts, W.O. Determining a “Do Not Start” Temperature for a Marathon on the Basis of Adverse Outcomes. Med. Sci. Sports
Exerc. 2010, 42, 226–232. [CrossRef] [PubMed]
19. Casa, D.J.; Armstrong, L.E.; Kenny, G.P.; O’Connor, F.G.; Huggins, R.A. Exertional heat stroke: New concepts regarding cause and
care. Curr. Sports Med. Rep. 2012, 11, 115–123. [CrossRef] [PubMed]
20. Racinias, S.; Alonso, J.M.; Coutts, A.J.; Flouris, A.D.; Girard, O.; González-Alonso, J.; Hausswirth, C.; Jay, O.; Lee, J.K.W.; Mitchell,
N. Concensus recommendations on training and competing in the heat. Scand. J. Med. Sci. Sports 2015, 25, 6–19. [CrossRef]
[PubMed]
21. American College of Sports Medicine; Armstrong, L.E.; Casa, D.J.; Millard-Stafford, M.; Moran, D.S.; Pyne, S.W.; Roberts, W.O.
American College of Sports Medicine position stand: Exertional heat illness during training and competitions. Med. Sci. Sports
Exerc. 2007, 39, 556–572. [CrossRef] [PubMed]
22. Ruddock, A.; Robbins, B.; Tew, G.; Bourke, L.; Purvis, A. Practical Cooling Strategies During Continuous Exercise in Hot
Environments: A Systematic Review and Meta-Analysis. Sports Med. 2017, 47, 517–532. [CrossRef] [PubMed]You can also read