Virtual reality, video screen shots and sensor data for a large drop tower ride - IOPscience
←
→
Page content transcription
If your browser does not render page correctly, please read the page content below
Physics Education

PAPER • OPEN ACCESS

Virtual reality, video screen shots and sensor data for a large drop tower
ride
To cite this article: Malcolm Burt and Ann-Marie Pendrill 2020 Phys. Educ. 55 055017

View the article online for updates and enhancements.

                               This content was downloaded from IP address 46.4.80.155 on 07/11/2020 at 05:16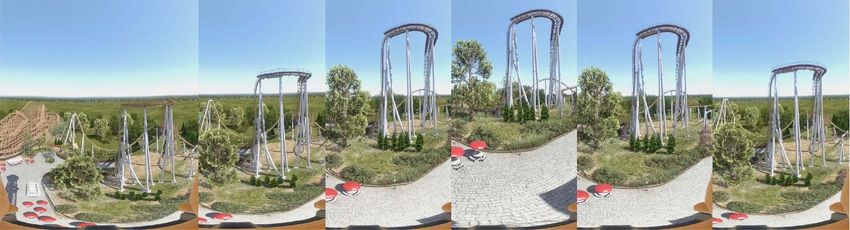
Phys. Educ. 55 (2020) 055017 (8pp) iopscience.org/ped
Virtual reality, video
screen shots and sensor
data for a large drop
tower ride
Malcolm Burt1 and Ann-Marie Pendrill2,3
1
CQUniversity, 160 Ann St, Brisbane City Queensland 4000, Australia
2
National Resource Centre for Physics Education, Lund University, Box 118, SE 221
00 Lund, Sweden
E-mail: Ann-Marie.Pendrill@fysik.lu.se and m.burt@cqu.edu.au
Abstract
Large drop towers let you experience a couple of seconds of nearly free fall
before stopping gracefully in magnetic brakes or bouncing a number of times
on compressed air, as in the Turbo Drop tower considered in this work,
where many complementary representations are used. An accelerometer
taken along on the ride captured the forces experienced by the body, and a
pressure sensor provided a simultaneous proxy measurement of elevation.
These data can be treated numerically: integration of the accelerometer data
gives a velocity graph which can be compared to derivatives of the elevation
data obtained from the pressure sensor. Plotting elevation versus velocity
gives a phase portrait for the damped oscillations of the gondola before it
comes to a stop. These abstract mathematical and graphical representations
are complemented by screen shots from a video as well as from a virtual
reality movie offering the view from the point of a rider. Forces and
acceleration overlaid in a 2D version of the VR movie give a geometric
illustration of Newton’s second law, in addition to the mathematical
treatment. This work thus provides a wide range of representations, aimed to
support student representational fluency and conceptual understanding of
important force and motion concepts.
Keywords: amusement park physics, virtual reality, drop tower, acceleration,
representations, first-person physics
3
Author to whom any correspondence should be addressed.
Original Content from this work may be used
under the terms of the Creative Commons
Attribution 4.0 licence. Any further distribution of this work
must maintain attribution to the author(s) and the title of the
work, journal citation and DOI.
1361-6552/20/055017+8$33.00 1 © 2020 The Author(s). Published by IOP Publishing Ltd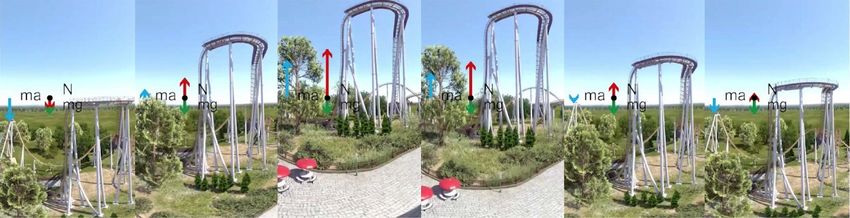
M Burt and A Pendrill
1. Introduction differences of elevation [2]. The results were
Vertical drop towers are found in many amuse- then compared to accelerometer data obtained
ment parks, offering riders spectacular views, on a smartphone [3–5]. The accelerometer data
while requiring only a small footprint in crowded were integrated numerically to obtained the time
parks. They are popular with parks due to their rel- dependence of velocity, which were then integ-
atively low installation costs compared with tra- rated again to obtain elevation. (Integration of
ditional theme park attractions like rollercoasters. numerical accelerometer data to obtain velocity
Due to their often great heights their command- and distance was also applied in earlier work for
ing structures positively enhance the skyline of the horizontal launch of the launch coasters Kan-
theme parks. Drop rides also exist in underground onen at Liseberg and Speedmonster at Tusenfryd
forms, including the Haunted Mine Drop at Glen- [6] as well as during the slowing down in magnetic
wood Caverns Adventure Park and Escape from brakes [7].)
Alcatraz in the United States, and the now-closed Data for the Gyldne Tårn were collec-
Nemesis: Sub-Terra at Alton Towers in the United ted using the Wireless Dynamic Sensor Sys-
Kingdom of Great Britain and Northern Ireland. tem (WDSS) from Vernier (www.vernier.com),
Underground drop rides generally employ a sub- carried on the body in a special data vest,
stantially shorter drop than the above ground ver- as shown in figure 3. Ten data points per
sions. second were collected, using the accelerometer
Rides involving vertical drops are also pop- and pressure sensors. An accelerometer, in spite
ular teacher assignments for secondary students, of its name, does not measure acceleration
in particular rides involving a pure free-fall drop, but instead the vector a − g, often expressed
where kinematic formulæ can be applied. This is as the dimensionless vector (a − g)/g, relat-
evident during science days, from queues as well ing the force from the ride on a body to the
as from discussions with teachers. force of gravity, with components depending
Developments in computers and software on the orientation of the sensor, as discussed
have enabled realistic simulations of exper- e.g. in [8].
iences in amusement rides (e.g. by NoLim- For the purely vertical acceleration in the
itsCoaster.com and vrcoaster.com), including drop tower in figure 1 the acceleration can be
virtual reality experiences [1]. This can give obtained by adding the vector g to the accel-
an additional representation of the motion, erometer reading, or simply subtracting g = |g|
adding a ‘first person’ perspective, discussed in from the vertical component. Figure 2 shows
section 5. the data for acceleration together with velocity
and elevation. The velocity graph was obtained
by integration of the acceleration, whereas the
2. Mathematical description of the elevation data are based on the output from
motion in a drop tower the pressure sensor in the WDSS. The accel-
A sequence of screen shots can be used to get a erometer data is somewhat noisy, as typical
visual representation of the motion, as seen from for amusement rides. Part of the noise can be
outside, with a graph-like combination of photos. attributed to ringing of the sensor following
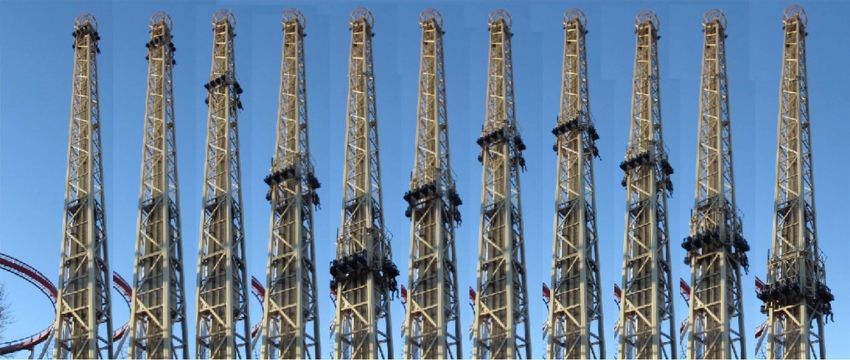
Figure 1 shows a sequence of screen shots changing accelerations –jerk [9]. However, even
for the drop tower Gyldne Tårn at Tivoli Gar- noisy data can be useful for understanding the
dens in Copenhagen, which is a Turbo Drop motion.
tower from S&S (s-s.com) where the riders This paper explores a number of differ-
are shot down from the highest point with ent visual representations of the motion of this
an acceleration larger than the acceleration of drop tower, in addition to mathematical expres-
gravity, g. sions and traditional graphs, thus providing
In earlier work involving a small family teachers with additional tools to support stu-
drop tower a sequence of screen shots was was dents’ conceptual development and representa-
used to illustrate the definitions of velocity and tional fluency. For example, Airey and Linder
acceleration [2] in terms of first and second [10] note that ‘Visual representations are part of
September 2020 2 P hy s . E d u c . 5 5 ( 2 0 2 0 ) 0 5 5 0 1 7
Virtual reality, video screen shots and sensor data for a large drop tower ride

Figure 1. Sequence of screen shots of a Turbo Drop tower, the Gyldne Tårn (Golden Tower), at Tivoli Gardens in
Copenhagen. The interval between the screenshots is 1.0 s and the distance between horizontal beams is approx-
imately 2.4 m.

                                50

                                40
 h (m), v (m/ s), a (m/ s^2)

                                30

                                20

                                10

                                 0

                               –10

                               –20
                                  35   40   45    50     55    60    65
                                                  t(s)
                                                                              Figure 3. Data collection using a WDSS sensor in a
                                                                              data vest. The little plastic mug contains a small amount
Figure 2. Elevation (blue) and accelerometer (green)                          of water, which will leave the mug as the gondola accel-
data for the GyldneTårn ride at Tivoli gardens, collec-                       erates downward faster than the acceleration of gravity
ted using a WDSS sensor from Vernier. The velocity                            (Photo: Anna Hess).
data (red) were obtained by numerical integration of the
acceleration data.                                                                 After a discussion in section 3 about stu-
                                                                              dent recollections and difficulties in applying the
                                                                              laws of motion, the data shown in figure 2 are
discipline discourse in the sense that they are                               used to illustrate derivatives and integrals, to
thinking tools for individuals and groups, com-                               show how the mathematics and physics studied
munication tools, as well as problem-solving                                  in the classroom can apply to more general situ-
tools’. In a comparison between different teach-                              ations than common textbook examples of uni-
ing environments Kohl and Finkelstein [11] found                              form rectilinear motion, vertical free fall, pro-
that ‘Those environments that regularly use mul-                              jectiles and uniform circular motion. Section 4
tiple representations and those that hold stu-                                shows an additional representation of the sensor
dents responsible for using multiple representa-                              data for the drop tower shown in figure 1: the
tions positively impact students’ performance and                             velocity obtained by integration of the accelero-
ability to work across representations’.                                      meter data is plotted against the elevation giving

September 2020                                                            3                              P hy s . E d u c . 5 5 ( 2 0 2 0 ) 0 5 5 0 1 7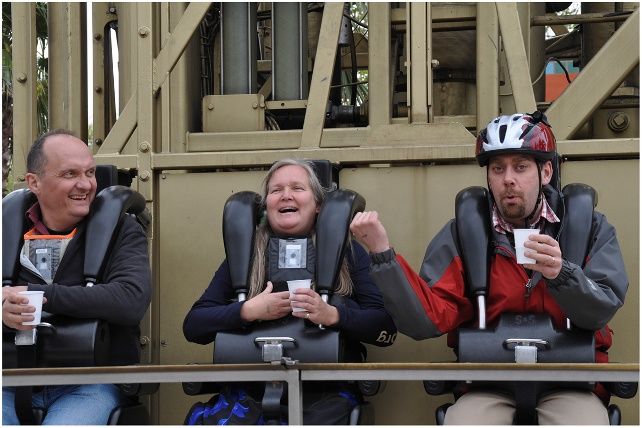
M Burt and A Pendrill

          50                                                                                  a = dv/dt ≈ ∆v/∆t                                  (2)
          45

          40
          35

          30                                                                             a = d2 s/dt2 ≈ ∆(∆s)/(∆t)2 .                            (3)
h (m)

          25
          20                                                                   A few students may also mention jerk, j, as the
          15                                                                   time derivative of acceleration [9].
          10                                                                        The difference expressions in (1)–(3) were
           5                                                                   explored visually in the earlier work involving a
               38   39   40    41   42   43      44   45   46   47    48
          15
                                                                               sequence of screen shots of a small family drop
          10
                                                                               tower [2]. A similar analysis can be applied to
           5
                                                                               the sequence of screen shots in figure 1. During
           0
                                                                               a lecture or recitation session, the screen shots
v (m/s)

          –5
                                                                               could be shown, asking students where the velo-
     –10
                                                                               city (or speed) is largest and where it is smallest.
     –15
                                                                               After establishing the relation between velocity
     –20
                                                                               and the difference in elevation been subsequent
       38           39   40    41   42   43      44   45   46   47    48       screen shots, the students can be asked to discuss
                                         t (s)
                                                                               where the acceleration is largest and if it is zero
                                                                               anywhere.
Figure 4. Illustration of the relation (1) between the
                                                                                    The corresponding integral forms of the rela-
velocity and the change in elevation as v ≈ ∆h/∆t and
∆h ≈ v∆t for a part of the data shown in figure 2 of                           tions are known to be less familiar (see e.g.
the Turbo Drop (figure 1). The numerical elevation data                        [2, 12–15]), but in a large student groups, a
were obtained from the pressure sensor and the velocity                        few students may come      up with integral
                                                                                                    ´                   ´ expres-
by integration of the vertical acceleration data from a                        sions, e.g. s = s0 + v dt and v = v0 + a dt. For
WDSS sensor.
                                                                               numerical data, these expressions are approxim-
                                                                               ated by summation, e.g.
                                                                                                    ˆ         ∑
‘phase portraits’ of the damped oscillations during                                        s − s0 = v dt ≈       vn ∆tn        (4)
the bounces on compressed air. Finally, section                                                                     n
5 discusses how virtual reality experiences may
enhance amusement rides, as well as the learning                                                    ˆ             ∑
of force and motion.                                                                     v − v0 =       a dt ≈           an ∆tn                  (5)
                                                                                                                     n

3. Derivatives and differences, integrals                                      Figure 4 illustrates the relation between deriv-
and summation                                                                  atives and integrals based on numeric data dis-
                                                                               played in figure 2. Class and tutorial sessions
Students have practiced using kinematic for-
                                                                               with many cohorts of introductory physics stu-
mulæ, such as s = s0 + v0 t + at2 /2, and v = v0 +at
                                                                               dents have shown that many of them know derivat-
for uniformly accelerated rectilinear motion in
                                                                               ives and integrals from the formula sheet, but fail
numerous examples, including exams. Inviting
                                                                               to connect with the definitions of derivatives and
students to discuss what assumptions were made
                                                                               integrals as differences or sums with smaller and
to obtain these relations, and what is required for
                                                                               smaller time intervals. One of us recalls a discus-
them to hold can lead students to the more general
                                                                               sion during a lecture, when a few students claimed
expressions
                                                                               never to have seen the summation sign in school.
                                                                               (They certainly had, but had obviously forgotten.)
                                                                               When asked how they did integrals these students
                              v = ds/dt ≈ ∆s/∆t                      (1)       happily exclaimed ‘we just use the expressions

September 2020                                                             4                             P hy s . E d u c . 5 5 ( 2 0 2 0 ) 0 5 5 0 1 7
Virtual reality, video screen shots and sensor data for a large drop tower ride

on the formula sheet’, revealing a lack of con-
nection to an important representation of integrals                   50

and how integrals can be useful. Numerical integ-                     45
ration of authentic data, as illustrated in figure 4,                 40
provides a way to refresh their memory and bring
meaning to the definitions. Working with these                        35

representations may lay a more solid foundation                       30
for their future studies, where these expressions

                                                              h (m)
                                                                      25
for integrals and derivatives are often used to set
up new relations.                                                     20

     Acceleration as second derivative of posi-                       15
tion may seem abstract, but when connected to
                                                                      10
force through Newton’s second law, a = F/m, the
experience of the body can be added to the more                        5

formal representations.                                                0
                                                                       –20   –15   –10   –5      0           5        10         15
     The acceleration graph in figure 2 shows
                                                                                          v (m/s)
that the ride accelerates downward faster than the
acceleration of gravity. For downward accelera-
tions larger than g the force from the ride must             Figure 5. Phase portrait for the bounces of ride in the
                                                             Gyldne Tårn in figure 1, using the elevation and velocity
come from above, pressing the rider downward.
                                                             data shown in figure 2.
This physical memory of a downward acceler-
ation exceeding g may on special occasions be
enhanced by bringing a little soft plastic glass with             Phase portraits are traditionally introduced in
a small amount of water and see the water flying             more advanced courses, but when students have
out at the top, as if the force of gravity were tem-         collected their own data, this is an additional
porarily inverted.                                           representation that may be explored without the
     Data collected from these free-fall rides               full mathematical toolkit, as suggested also in
offer opportunities to apply the more general                [16].
relations (1)–(3) for velocity and acceleration,
as well numeric integration, supporting student
understanding of the concepts of derivatives and             5. Virtual reality in amusement parks
integrals, beyond analytical expressions found in            In an entertainment context, virtual reality (VR)
their formula sheet.                                         is defined as a technology which ‘gives the guests
                                                             a head-mounted display that allows them to see
                                                             a digital world, matching the video image to the
                                                             movement of the guest’s head’ [1, 17].
4. Phase portaits of bounces                                      VR entertainment experiences in theme parks
In the Space shot and Turbo Drop rides the fall of           can be loosely grouped into several categor-
the gondola is stopped by compressed air, giving             ies: VR added to existing physical rides such
the riders a few extra bounces after the first drop,         as rollercoasters, drop rides, waterslides; stand-
as seen in figure 1. Every bounce brings the gon-            alone ‘walkthrough’ experiences designed solely
dola further down until it reaches the loading and           for VR where participants wear apparatuses that
unloading height. The phase portrait in figure 5             depict a different environment whilst they are
shows elevation versus velocity. If the bounces              physically walking through the ’real world’; sim-
had been without energy losses, the phase portrait           ulators where audiences are generally seated and
would simply have been an ellipse. The damping               the seats or vehicles they are on move in time
results in the size of the ellipse getting smaller and       with the VR experience; and entertainment ride
smaller. In addition, the lowering of the gondola            or park-based experiences delivered via apps on
is reflected in the centre of the ellipse being lower        smartphones and higher-end computer-connected
for every bounce.                                            headsets [1].

September 2020                                           5                               P hy s . E d u c . 5 5 ( 2 0 2 0 ) 0 5 5 0 1 7
M Burt and A Pendrill

Figure 6. A series of screen shots from a NoLimits Rollercoaster Simulation video of the ride experience in a
drop tower like the Turbo Drop.

Figure 7. A few screen shots from the first bounce of the 2D version of a drop tower VR movie with force and
acceleration overlay, added by SeeIt.

     In theme parks, simulators enhanced with                 from a 2D version of a VR movie simulating
VR technology create exhilarating and immersive               the ride experience from a first-person perspect-
experiences: The body has limited precision in its            ive. Turbo drop towers generally lift riders on a
discernment of steepness of slopes, and can easily            gondola to the top of the tower where they are
be tricked into believing it is accelerating by tilting       held for a period of time and then either dropped
the seat, as used in simulators. Also, Newton’s first         or launched downwards, followed by a bounce
law tells us that a body cannot distinguish motion            on compressed air, moving partway up the tower
–only motion changes.                                         before falling again for a number of iterations
     With VR Coasters (vrcoaster.com) headsets                before being lowered back to the loading posi-
are placed on riders of active rollercoasters, where          tion. The VR representation offers an opportunity
the VR visuals are coordinated with existing                  to view the ride from inside, giving a first-person
rollercoaster tracks with real forces, real drops             perspective, in contrast to the more typical view
and real airtime, to deliver an entirely new visual           from outside in physics textbooks (and in figure
experience. VR devices can seamlessly trick users             1). The movie shows nearby objects seeming to
into believing they are in a different environment.           move up while you move down and vice versa.
     For example, a free-fall–or nearly free-fall–                 However, while velocity is relative, acceler-
experience can be combined with VR to create                  ation is absolute, it makes a difference if it is
completely different experiences, e.g. flying with            your body or the surroundings that is accelerating.
dragons, as in the VR version of the Dæmonen                  Neither the outside view nor an inside VR repres-
roller coaster in Tivoli gardens in Copenhagen.               entation can expose you to G forces different from
                                                              unity if you are stationary, although if you have
                                                              been on similar rides, you may recall the experi-
5.1. A virtual drop tower experience
                                                              ence of the body.
Figure 6 shows an example of a few screen shots                    To bring the relation between force and
from the first bounce of a Turbo drop tower, taken            the changing velocity to students’ attention, the

September 2020                                            6                           P hy s . E d u c . 5 5 ( 2 0 2 0 ) 0 5 5 0 1 7
Virtual reality, video screen shots and sensor data for a large drop tower ride
virtual ride offers the possibility to add force and created the simulation of the ride and Paul
acceleration overlays as shown in the screen shots McLaughlin and Nina Erdstein at SEEit who
in 7. While many textbooks and teachers resort to added the force overlays.
algebraic solutions when all forces are in the same
direction, the visualization in figure 7 provides a
complementary representation aimed to help stu- ORCID iD
dents appreciate the vector character of of force Ann-Marie Pendrill https://orcid.org/0000-
and acceleration, even for one-dimensional prob- 0002-1405-6561
lems.
Received 6 April 2020, in final form 10 May 2020
Accepted for publication 1 June 2020
https://doi.org/10.1088/1361-6552/ab9872
6. Discussion
This paper has presented a number of differ-
ent representations of the motion in a Drop References
Tower ride, aiming to help students connect the [1] Burt M and Louw C 2019 Virtual reality
enhanced roller coasters and the future of
experience with the mathematical descriptions, by entertainment–audience expectations World
adding visual representations to provide interme- Leisure J. 61 183–99
diate steps. [2] Eriksson U and Pendrill A-M 2019 Up and
Rau has presented a review [18] based on down, light and heavy, fast and
educational psychology, cognitive and multime- slow–but where? Phys. Educ.
54 025017
dia learning theories, as well as sociocultural [3] Software V 2016 Physics Toolbox Sensor Suite
theory, to investigate the effectiveness of using (http://vieyrasoftware.net/)
text + multiple visual representations (T+MV) [4] Vieyra R and Vieyra C 2014 Analyzing forces on
compared to using text and only single visual amusement park rides with mobile devices
representations (T+SV). One of the conclu- Phys. Teacher 52 149
[5] Staacks S, Hütz S, Heinke H and Stampfer C
sions was that each visual representation needs 2018 Advanced tools for smartphone-based
to provide information about the learning con- experiments: physphox Phys. Educ. 53
tent that (1) adds relevant information not 045009
fully covered by the other visual representa- [6] Pendrill A-M 2008 Acceleration in one, two and
tions but (2) overlaps partially with information three dimensions in launched roller coasters
Phys. Educ. 43 483
provided in the other visual representations, and [7] Pendrill A-M, Karlsteen M and Rödjegård H
also that T+MV representations that differ on 2012 Stopping a roller coaster train Phys.
design dimensions (e.g. concrete/abstract, phys- Educ. 47 728
ical/virtual) are more effective. [8] Pendrill A-M 2020 Smartphones and Newton’s
We invite teachers to use the complementary first law in escalators and rollercoasters
Phys. Educ. 55 035016
and partially overlapping representations presen- [9] Eager D, Pendrill A-M and Reistad N 2016
ted in this work, to support students’ development Beyond velocity and acceleration: jerk, snap
of a deeper conceptual understanding. and higher derivatives Eur. J. Phys. 37
065008
[10] Airey J and Linder C 2009 A disciplinary
discourse perspective on university science
Acknowledgment learning: achieving fluency in a critical
We would like to thank Tivoli Gardens in constellation of modes J. Res. Sci. Teaching
46 27–49
Copenhagen for providing access for teacher [11] Kohl P B and Finkelstein N 2017 Understanding
professional development occasions for Swedish and promoting effective use of
teachers, including the time when these data were representations in physics learning Multiple
collected. We would also like to express our Representations in Physics Education.
appreciation to Anna Hess at Zenit Läromedel Models and Modeling in Science Education
vol 10 (Berlin: Springer)
providing the WDSS sensors and vests for data
[12] Pendrill A-M and Ouattara L 2017 Force,
taking, and to Tom Zeliff at No Limits 2 who acceleration and velocity during trampoline
September 2020 7 P hy s . E d u c . 5 5 ( 2 0 2 0 ) 0 5 5 0 1 7M Burt and A Pendrill
jumps–a challenging assignment Phys. Educ. Malcolm Burt produces video and
52 065021 virtual reality media experiences
[13] Nguyen D-H and Rebello S N 2011 Students’ for amusement and education. He
understanding and application of the area recently finished his PhD on what
under the curve concept in physics problems consumers want from a virtual reality
Phys. Rev. ST Phys. Educ. Res. 7 010112 entertainment experience.
[14] Planinic M, Zeljka M-S, Katic H, Susac A and
Ivanjek L 2012 Comparison of university
students’ understanding of graphs Int. J. Sci.
Math. Education 6 1393–414
[15] Planinic M, Ivanjek L, Susac A and Zeljka M-S
2013 Comparison of university students’
understanding of graphs in different contexts
Phys. Rev. ST Phys. Educ. Res. 9 020103 Ann-Marie Pendrill is a senior
[16] Ng C 2016 Understanding the damped SHM professor at Lund university and
without ODEs Phys. Educ. 51 025006 has been the director of the Swedish
[17] Younger D 2016 Theme Park Design & The Art National Resource Centre for Physics
of Themed Entertainment (New York: Education 2009-2019. She has used
Inklingwood Press) p 532 amusement parks for physics teaching
[18] Rau M A 2017 Conditions for the Effectiveness since 1995 and is fascinated by the
of Multiple Visual Representations in way VR can trick your senses.
Enhancing STEM Learning Educ. Psychol.
Rev. 29 717–61
September 2020 8 P hy s . E d u c . 5 5 ( 2 0 2 0 ) 0 5 5 0 1 7You can also read


