Work-in-Progress: Incorporating Computational Thinking Instruction into K-12 Using 3D Weather
←
→
Page content transcription
If your browser does not render page correctly, please read the page content below
Paper ID #33308

Work-in-Progress: Incorporating Computational Thinking Instruction into
K-12 Using 3D Weather
Dr. Pat Ko, Mississippi State University
     Pat Ko is a post-doctoral associate at Mississippi State University. His interests include computer science
     education, computational thinking, K-12 engineering programs, and educational robotics.

Dr. Mahnas Jean Mohammadi-Aragh, Mississippi State University
     Dr. M. Jean Mohammadi-Aragh is an assistant professor in the Department of Electrical and Computer
     Engineering at Mississippi State University. Dr. Mohammadi-Aragh investigates the use of digital sys-
     tems to measure and support engineering education. Current projects include leveraging writing to support
     programming skill development, using 3D weather visualizations to develop computational thinking skills
     for K-12 students, and exploring how instructors impact attention in large, computer-infused lectures. Dr.
     Mohammadi-Aragh also investigates fundamental questions about community, identity, messaging, and
     diversity, which are all critical to improving undergraduate engineering degree pathways.
Mr. Jonathan G. Harris, Northern Gulf Institute

     Jonathan Harris is a marine geophysicist and Director of Education & Outreach for the Northern Gulf In-
     stitute. Harris is a Mississippi licensed STEAM educator who creates and implements marine, earth, atmo-
     spheric, and environmental science-related curriculum for students, educators, and the public throughout
     the Gulf region, using NGI’s high-performance computing capabilities, autonomous aircraft, and surface
     vessels, and other marine resources. Harris also provides marine operations and logistical support for the
     offshore research operations conducted by the NGI for the National Oceanic and Atmospheric Adminis-
     tration (NOAA) as well as for research conducted by and for the Resources and Ecosystems Sustainability,
     Tourist Opportunities, and Revived Economies (RESTORE) Act, and the Mississippi Based RESTORE
     Act Center of Excellence (MBRACE).
Dr. Jamie Lee Dyer, Mississippi State University

     Dr. Jamie Dyer is a Professor of Meteorology and Climatology in the Department of Geosciences at
     Mississippi State University. His research focus areas are in numerical weather prediction, surface-
     atmosphere interactions, hydrometeorology, and data visualization. Dr. Dyer is currently working on
     projects involving 3D visualization and analysis of weather model data, applications of unmanned aircraft
     systems (UAS) in flood visualization and analysis, and the investigation of using coupled atmospheric,
     hydrologic, and land surface models for water prediction across multiple spatial and temporal scales. With
     a research and teaching background in topics ranging from physics to data science to surface hydrology,
     Dr. Dyer’s work has a strong focus on transdisciplinary approaches to scientific problem solving and
     education.
Dr. Yan Sun, Mississippi State University

     Dr. Yan Sun is an Assistant Professor at the Department of Instructional Systems and Workforce Devel-
     opment, Mississippi State University. She received her Ph.D. degree in Learning, Design, & Technology
     from Purdue University and completed her post-doctoral research work at Texas A&M University. Dr.
     Sun’s research revolves around the area where STEM education intersects with technology. She has ex-
     pertise in quantitative and mixed-methods research and has been applying quantitative and mixed-methods
     methodologies in her research on innovative technology-integrated STEM education projects and inter-
     ventions.

                               c American Society for Engineering Education, 2021
Work-in-Progress: Incorporating computational thinking
                Instruction into K-12 using 3D Weather

Abstract

    The 3D Weather Analysis and Visualization project (3D Weather) improves middle school students’
computational thinking skills. 3D Weather focuses on evaluating three-dimensional data using the full
data volume instead of the traditional approach using two-dimensional cross-sectional slices. We use
basic meteorology as a contextual framework to introduce and provide the data for the computational
thinking exercises. However, instead of directly developing lessons for the classroom, we are using a
“teach the teacher” model. We provide a two-week summer professional development for middle
school teachers in the state. During the program, the teachers are taught introductory weather science,
the IDV visualization software basics, and how to obtain free weather data from the National Oceanic
and Atmospheric Administration (NOAA). Restrictions due to the COVID19 pandemic required
modifications to our planned initial year activities, but we were able to pilot and obtain feedback to
improve the program. Our plans for the 2021-2022 school year include offering our full summer
professional development workshop, observing teachers in their classrooms while they implement
meteorology lessons with computational thinking, and collecting data from both teachers and students
measuring attitudes towards meteorology and computational thinking as well as changes in 3D
visualization abilities.

Introduction

   Computational thinking can be described as the required thought processes necessary to
conceptualize data and create algorithmic steps to solve problems with computers. In 2006, Jeannette
Wing loosely defined computational thinking as involving “solving problems, designing systems, and
understanding human behavior, by drawing on the concepts fundamental to computer science” (Wing,
2006, p. 33), and later clarified it as the thought processes used to formulate problems, solve them, and
express the solution as instructions that an information processing agent could carry out (Cuny et al.,
2010).

    However, as computational thinking has matured as a field, numerous other researchers have
assessed what computational thinking should or should not be (Kaleli ̇Oğlu et al., 2016; Selby & Woollard,
2013; Shute et al., 2017). For instance, to Denning and Tiesto, computational thinking is the mental skills
and practices that are used to design systems for automation, and explain and interpret the world as
information processes (Denning & Tedre, 2019). Meanwhile, Naughton described it as “understanding
the difference between human and artificial intelligence, as well as about thinking recursively, being
alert to the need for prevention, detection and protection against risks, using abstraction and
decomposition when tackling large tasks, and deploying heuristic reasoning, iteration and search to
discover solutions to complex problems.” (Naughton, 2012). Taking a different tactic, the International
Society for Technology in Education and the Computer Science Teachers Association polled teachers,
researchers, and practitioners to create an operational definition that lists a set of skills and qualities,
instead of stating an all-encompassing principle (ISTE & CSTA, 2011). Figure 1 shows the results of their
inquiry.
Computational thinking (CT) is a problem-solving process that includes (but is not limited to) the
following characteristics:
• Formulating problems in a way that enables us to use a computer and other tools to help solve
them.
• Logically organizing and analyzing data
• Representing data through abstractions such as models and simulations
• Automating solutions through algorithmic thinking (a series of ordered steps)
• Identifying, analyzing, and implementing possible solutions with the goal of achieving the most
efficient and effective combination of steps and resources
• Generalizing and transferring this problem solving process to a wide variety of problems
These skills are supported and enhanced by a number of dispositions or attitudes that are essential
dimensions of CT. These dispositions or attitudes include:
• Confidence in dealing with complexity
• Persistence in working with difficult problems
• Tolerance for ambiguity
• The ability to deal with open ended problems
• The ability to communicate and work with others to achieve a common goal or solution
Figure 1. Operational Definition of Computational Thinking from the International Society for
Technology in Education and the Computer Science Teachers Association (ISTE & CSTA, 2011)
While named for computer science and involving requisite skills for writing programs, computational
thinking skills are general enough to be useful for many fields beyond computer science. The Next
Generation Science Standards (NGSS) promotes developing computational thinking in K-12 students by
integrating the skills into other science instruction contexts. However, there are barriers to
implementation. Current in-service K-12 science teachers have not been trained in computational
thinking, and there is a lack of tools to help support computational thinking learning. Computational
thinking skills are requisite for success in STEM degree programs, especially engineering and computer
science; therefore, it is critical that we identify ways to support learning computational thinking skills in
K-12 education.
3D Weather Analysis and Visualization (3D Weather) is an NSF-funded project to create a contextual
framework around basic meteorology concepts and the display of real weather data for K-12
computational thinking instruction. The focus of the project is on providing the professional
development, tools, and support that science teachers need to write lessons that motivate science
learning and practice computational thinking. We used weather as our context because, fundamentally,everyone has experienced weather and been presented with weather information in some form (e.g..,
TV weather forecast). The computational thinking skills taught through 3D Weather include:
• Understanding and manipulating complex three-dimensional data through visualization
• Recognizing and explaining patterns (specifically in weather and the atmosphere)
• Systems thinking (in a meterology context)
• Using data to predict outcomes
In particular, we focus on using various isosurface contours and shading to represent three-dimensional
shapes instead of the more traditional 2D techniques used for displaying weather information in print or
on digital media such as TV or websites.
Is 3D visualization a Computational Thinking skill?
We assert that 3D visualization skills should be included as computational thinking skills, as 3D
visualization covers multiple different skills. Some, such as the ability to mentally perform rotations of a
three-dimensional object, have been well studied as it relates to STEM disciplines (Neigel et al., 2017;
Sorby & Baartmans, 2000). Our work concerns the ability to interpret information within a three-
dimensional volume of various types of surfaces with contour and shading. Being able to navigate and
work with a 3D data set using 2D techniques and concepts is useful in a wide variety of different fields,
including medical imaging (Sun et al., 2008), engineering (Coffey et al., 2012), and archeology (Nuzzo et
al., 2002).
There are several reasons why we assert that 3D visualization and the interpretation of surfaces
within the data volume qualify as computational thinking skills. A central feature of many definitions of
computational thinking, including Wing’s (Wing, 2006), is that it relates to solving problems. A critical
first step in problem-solving is identifying and scoping the problem, which involves obtaining and
understanding the input data. In numerous fields, including engineering, the input data concerns values
at points within a physical 3D volume. For this category of problems, the ability to access this
information from the computer and interpret it correctly is a critical mental skill that is required to
create a solution. Furthermore, some definitions of computational thinking explicitly state that it
includes the skills necessary to communicate results to clients (BBC, 2021; K12 Computer Science, n.d.).
For engineering, this may mean creating 3D visualization files to illustrate results.
Program
Our goal is to recruit up to 20 secondary school teachers in the state to attend a two-week summer
professional development program each year. In addition to lessons in basic meteorology, the science
teachers are taught how to download weather data files from National Oceanic and Atmospheric
Administration (NOAA) public data servers and how to use an open-source 3D computer visualization
tool. During the school year, the teachers are asked to create lessons for their students that teach 3D
visualization skills in the context of weather science. As compensation, teachers who participate in the
program are offered a stipend and a laptop computer to keep.
While we could have chosen topics from a multitude of fields in which to contextualize the 3D
visualization exercises, basic meteorology was the most appropriate for our intended middle school
audience. First, unlike some of the fields, the weather is a phenomenon that all target students arefamiliar with; they observe and have concrete, physical experiences daily. Everyone has prior
conceptions (and misconceptions) about the weather, and we can link to that prior knowledge to help
make meaningful learning experiences. Additionally, large amounts of weather visualization data are
available from NOAA for free, as the data are public domain and readily accessible. The data includes
both current and historical weather data for all regions of the United States and the globe. This former
point is essential because it enables our teachers to display local area visualizations to connect to what
the students are currently experiencing weather-wise, and to use visualizations of significant weather
events that the students hear about in the news.
Since our target teachers span multiple grade levels, it is not practical for us to provide them with
lessons and presentations adapted for each possible grade level. Instead, we are using a “teach the
teacher” training model; we present the same information to all teachers, and rely on each teacher to
create lessons and adapt the material to be appropriate for their students.
The primary content themes and subthemes for the summer program are:
1. Energy and Mass
a. Temperature
b. Convection and Vertical Motion
2. Water in the Atmosphere
a. Atmospheric Moisture
b. Clouds and Precipitation
3. Distribution and Movement of Air
a. Pressure and Wind
b. Global Circulation Patterns
4. Atmospheric Disturbances
a. Mid-Latitude Cyclones and Fronts
b. Tropical Cyclones
Every subtopic is split into a series of short lectures, each consisting of 5-6 presentation slides. We
expect that teachers will adapt the content and coverage to what is appropriate for their students.
While we are initially focused on middle school students and the presentations start from basic
concepts, there is enough content depth to be suitable for a high school class. With each unit, we have
sample visualizations of weather data that help illustrate the associated concepts. Each visualization file
is derived from actual US weather data generated by NOAA.
The primary computer tool we use is the Integrated Data Viewer (IDV), a free, open-source Java
software package designed specifically for geoscience visualization. It is available for Windows, MacOS,
and Linux platforms and is well established in the meteorology community. Initially released in 2002, it is
developed by the Unidata Program Center (UPC)(Unidata | IDV FAQs, n.d.), which is a group of
institutions that develops and shares tools and data with the Earth Science research and education
community. Unidata is primarily funded by the National Science Foundation and is part of the University
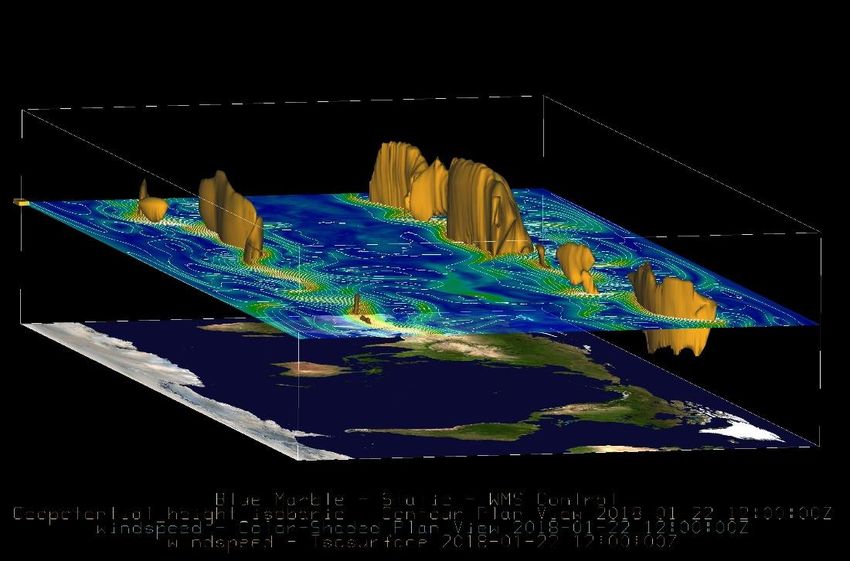
Corporation for Atmospheric Research (UCAR) (Unidata Tour, 2021). Figure 2 is a typical IDV
visualization included with the curriculum.Figure 2. An IDV visualization showing a constant pressure (a.k.a., isobaric) surface colored by wind speed along with surfaces of constant wind (a.k.a., isotach) at a value of 50 m/s. Note the orientation directed from southeast to northwest across the Earth in a geographic projection. Year 1 and COVID-19 modifications The first year of the project implementation occurred during 2020. The plan was to conduct the first 2-week summer institute for teacher training during July 2020 and collect data on the teacher implementation of lessons over the 2020-2021 academic year. Unfortunately, the COVID-19 pandemic started in the spring of 2020 and forced us to modify our plans. Due to safety concerns, we shifted the face-to-face summer teacher training to an online model. Lectures on the meteorology content were recorded and used as the audio track over the presentation slides and made available for the teachers asynchronously. Because IDV is a complicated tool, we also held synchronous online sessions to help the teachers install and navigate the software. Due to the increased workload of converting the sessions from face-to-face to online, only two of the four planned content themes were ready for the July 2020 training. From the teachers, we collected some pre- and post-survey data on their attitudes towards computational thinking. The collection of student data scheduled for the 2020-2021 school year was canceled for two reasons. First, since the teachers were under pressure to convert their lessons to remote learning, we did not wish to further burden them with additional requirements. Secondly, due to the difficulties of adjusting to remote learning on the students, it was unlikely that the data that we collected would have been representative of the typical in-person school experience, and thus would have been excluded from our analysis. While we had to scale back our goals for Year 1 considerably, we were able to make use of the time. We treated this year as a pilot and used the feedback we obtained from the teachers to improve the quality of the materials and prepare for Year 2.
Year 2 plans

   For summer 2021 and the following academic year, our assumption is that all schools will be back to
face-to-face instruction. All four planned content themes are ready for presentation. We will use pre-
and post-tests to assess teachers’ attitudes towards teaching methods for meteorology and
computational thinking. We will also assess whether their 3D visualization abilities improved during the
training program. For our “teach the teacher” approach, in summer 2021, we will also provide the
teachers with example lessons that individual teachers can modify to create and deliver relevant lessons
to their students. The goal for providing example student lessons is to model how one could adapt the
professional development material to promote 3D visualization computational thinking skills within the
context of atmospheric science. Following the summer training session, we will complete classroom
observations of teachers’ lessons and pre- and post-tests of students’ meteorology knowledge, attitudes
towards meteorology and computational thinking, and their 3D visualization ability. If the summer
teacher training cannot be face-to-face, we will follow a similar plan as in Year 1, with remote learning
for the content material. If the 2021-2022 school year is only offered remotely in our participating
school districts, we will either modify or cancel our planned student data collection depending on the
conditions at the time.

Conclusion

   The 3D Weather Analysis and Visualization project focuses on using 3D visualization of weather data
to teach computational thinking with broad applicability and importance for K-12 students. Using basic
meteorology as a contextual framework, we have created a curriculum and materials. We are
conducting a summer professional development program to train middle school science teachers to
write lessons to develop this skill. The software and an extensive repository of visualization data are
available for free. While middle school students are our initial target group, there is enough depth to the
content material for high school students as well. Despite setbacks in our first year due to COVID19
restrictions, we were able to make use of the time to refine our materials. We are in an excellent
position to move forward and are looking towards resuming operations and collecting data on both
teachers and students in 2021.

Acknowledgements

   Support for this work was provided by the National Science Foundation through the STEM+C award
(DRL-1934194). The opinions expressed in this paper are those of the authors and do not necessarily
represent those of the Foundation.

References

BBC. (2021). What is computational thinking? - Introduction to computational thinking - KS3 Computer

        Science Revision. BBC Bitesize. https://www.bbc.co.uk/bitesize/guides/zp92mp3/revision/1
Coffey, D., Malbraaten, N., Le, T. B., Borazjani, I., Sotiropoulos, F., Erdman, A. G., & Keefe, D. F. (2012).
Interactive Slice WIM: Navigating and Interrogating Volume Data Sets Using a Multisurface,
Multitouch VR Interface. IEEE Transactions on Visualization and Computer Graphics, 18(10),
1614–1626. https://doi.org/10.1109/TVCG.2011.283
Cuny, J., Snyder, L., & Wing, J. M. (2010). Demystifying computational thinking for non-computer
scientists.
Denning, P. J., & Tedre, M. (2019). Computational Thinking (Illustrated edition). The MIT Press.
ISTE & CSTA. (2011). Operational definition of Computational Thinking for K–12 education.
https://cdn.iste.org/www-root/ct-documents/computational-thinking-operational-definition-
flyer.pdf?sfvrsn=2
K12 Computer Science. (n.d.). Computational Thinking. K12cs.Org. Retrieved February 19, 2021, from
https://k12cs.org/computational-thinking/
Kaleli ̇Oğlu, F., Gülbahar, Y., & Kukul, V. (2016). A Framework for Computational Thinking Based on a
Systematic Research Review. Baltic Journal of Modern Computing, 4(3), 583–596.
Naughton, J. (2012, March 31). Why all our kids should be taught how to code. The Guardian.
http://www.theguardian.com/education/2012/mar/31/why-kids-should-be-taught-code
Neigel, A. R., Bailey, S. K. T., Szalma, J. L., & Sims, V. K. (2017). Age, Sex, and STEM Education Influence
Spatial Processing Performance. Proceedings of the Human Factors and Ergonomics Society
Annual Meeting, 61(1), 1224–1228. https://doi.org/10.1177/1541931213601788
Nuzzo, L., Leucci, G., Negri, S., Carrozzo, M. T., & Quarta, T. (2002). Application of 3D visualization
techniques in the analysis of GPR data for archaeology. Annals of Geophysics, 45(2), 321–337.
Selby, C. C., & Woollard, J. (2013, July 1). Computational Thinking: The Developing Definition. ITiCSE ’13:
Proceedings of the 18th ACM Conference on Innovation and Technology in Computer ScienceEducation. Innovation and Technology in Computer Science Education (ITiCSE) 2013, Canterbury,
England.
Shute, V. J., Sun, C., & Asbell-Clarke, J. (2017). Demystifying computational thinking. Educational
Research Review, 22, 142–158. https://doi.org/10.1016/j.edurev.2017.09.003
Sorby, S. A., & Baartmans, B. J. (2000). The Development and Assessment of a Course for Enhancing the
3-D Spatial Visualization Skills of First Year Engineering Students. Journal of Engineering
Education, 89(3), 301–307. https://doi.org/10.1002/j.2168-9830.2000.tb00529.x
Sun, Z., Allen, Y. B., Mwipatayi, B. P., Hartley, D. E., & Lawrence-Brown, M. M. D. (2008). Multislice CT
Angiography in the Follow-up of Fenestrated Endovascular Grafts: Effect of Slice Thickness on 2D
and 3D Visualization of the Fenestration Stents. Journal of Endovascular Therapy, 15(4), 417–
426. https://doi.org/10.1583/08-2432.1
Unidata | IDV FAQs. (n.d.). Retrieved February 11, 2021, from
https://www.unidata.ucar.edu/software/idv/docs/userguide/Faq.html
Unidata Tour. (2021). https://www.unidata.ucar.edu/about/tour/
Wing, J. M. (2006). Computational Thinking. Communications of the ACM, 49(3), 33–35.You can also read