The New Web: Characterizing AJAX Traffic
←
→
Page content transcription
If your browser does not render page correctly, please read the page content below
The New Web: Characterizing AJAX Traffic

        Fabian Schneider, Sachin Agarwal, Tansu Alpcan, and Anja Feldmann

               Deutsche Telekom Laboratories / Technische Universität Berlin
                                10587 Berlin, Germany
                      {fabian,anja}@net.t-labs.tu-berlin.de,
                    {sachin.agarwal,tansu.alpcan}@telekom.de,
                        http://www.net.t-labs.tu-berlin.de

       Abstract. The rapid advent of “Web 2.0” applications has unleashed new HTTP
       traffic patterns which differ from the conventional HTTP request-response model.
       In particular, asynchronous pre-fetching of data in order to provide a smooth
       web browsing experience and richer HTTP payloads (e.g., Javascript libraries) of
       Web 2.0 applications induce larger, heavier, and more bursty traffic on the un-
       derlying networks. We present a traffic study of Web 2.0 applications including
       Google Maps, modern Web-email, and social networking Web sites, and compare
       them with all HTTP traffic. We highlight the key differences of Web 2.0 traffic
       from traditional HTTP traffic through statistical analysis. As such our work elu-
       cidates the changing face of one of the most popular application on the Internet:
       The World Wide Web.

       Keywords: Internet Measurement, Trace-based Analysis, Traffic Characteris-
       tics, HTTP, HTML, AJAX.

1 Introduction

The World Wide Web [1] is one of the most popular applications of the Internet that
runs primarily over the HTTP protocol. While HTTP (Hyper Text Transfer Protocol) [2]
constitutes the session layer or messaging protocol of the Web, the HTML (Hyper Text
Markup Language) describes the content and allows authors to connect up web pages
through hypertext links or hyperlinks; an idea made popular by Tim Burners Lee in
the early 1990s and widely used today. In its classical form, users reach other pages or
access new data by clicking on hyperlinks or submitting Web based forms. In this basic
HTTP request-response model each clicked link or submitted form results in loading of
a new web page in response to the respective request.
    The recent popularity of asynchronous communication enabled web sites has caused
a fundamental shift in the classical HTTP request-response model of the Web. Wide-
spread implementation of this approach is usually executed through AJAX (Asynchronous
JavaScript and XML) [3], a compendium of technologies that enable Web browsers to
request data from the server asynchronously, i.e., without requiring human interven-
tion such as clicking on a hyperlink or on a button. Consequently, HTTP requests are
becoming automated rather than being human-generated.
    Contemporary web pages often contain embedded request-response functions com-
prising a JavaScript application engine that automatically executes in the background to
2
asynchronously pre-fetch large quantities of data from the server. This intelligent pre-
fetching can often mask the round trip and transmission latency of Internet connections
to give the user a ‘smoother’ Web application experience. We highlight these character-
istics of these new Web applications in Figure 1. The JavaScript engine builds a local
pre-fetched cache based on the user’s interaction with the Web application and executes
parts of the application logic in the client’s Web browser itself.
The prediction algorithms of any au-
tomated pre-fetching scheme usually re-
sult in significantly larger downloads as (a) Classic User responses
Get requests
over HTTP
Web browsing
compared to the classic user-initiated Browser
Output
Get reply
Web browsing due to inaccurate guesses Screen
(DOM)
data over
Web-
HTTP
on part of the prediction algorithms about User server
Web browser
which data to pre-fetch. Even when
User Get requests
the prediction is accurate, HTTP traffic (b) AJAX enabled
Web browsing
responses
JavaScript
over HTTP
Browser
inter-request times are no longer lower- Output
Engine
(Client side) Get reply
Screen
bounded by human response times (order (DOM) Pre-fetch
data over
HTTP
Web-
server
of seconds) and may instead depend on User Cache
JavaScript-enabled-browser
the JavaScript code logic of the Web ap- (e.g. Firefox, IE, Safari)
plication on the client machine. Fig. 1. Comparing classical Web applica-
Many popular Web applications have tions and AJAX enabled Web applications.
adopted Web 2.0 technologies. One of
the most popular and early adopter of
Web 2.0 is Google Maps. Its success encouraged the use of AJAX for building other
interactive Web applications. For example, many Web-email offerings have transitioned
to use Web 2.0 to rival the look and feel of desktop email clients. Furthermore, some
social networking web sites use AJAX technologies to offer rich and interactive user
experiences. In this paper we explore the traffic characteristics of the most popular rep-
resentatives of these AJAX based applications in our environment and contrast their
characteristics to those of the overall HTTP traffic.
1.1 Related Work
A good overview of the traditional Web is given in the book by Krishnamurthy and
Rexford [1]. One of the early works on characterizing the effect of HTTP traffic and
HTTP pre-fetching is by Crovella [4]. It highlights the beneficial and unwanted effects
of pre-fetching HTTP data, and hence further substantiates the importance of our anal-
ysis of the increasing phenomena of Web 2.0 applications and their global effect on the
Internet. There has been a vast literature on Internet Web caching, e.g., [5–7]. How-
ever, the underlying motivation for caching in all these studies has been on reducing
the overall download latency of the most popular web sites, not facilitating low latency
interactive Web 2.0 applications.
The number of studies focusing on the characteristics of AJAX-based traffic is lim-
ited at best. There exist several discussions, blogs and web sites containing information
about the end-user perceived latency of AJAX based applications (e.g., [8]). These,
however, are limited to client-side measurements. The novel aspect of our work lies in
the fact that we present an analysis of the HTTP traffic of two large user populations.3
1.2 Contributions
In this paper, we highlight the differences between conventional HTTP traffic patterns
and AJAX enabled Web 2.0 applications traffic patterns by studying the several Web 2.0
based applications. We have collected several HTTP traces from networks in Munich,
Germany and Berkeley, USA and then extracted popular Web 2.0 traffic from the HTTP
traffic. We highlight the changing characteristics of Web traffic by comparing the traffic
patterns of ambient HTTP applications and Web 2.0 applications.
From the statistical analysis of Web 2.0 traffic in comparison to all HTTP traffic ex-
tracted from the collected traces we show that the former’s characteristics significantly
differ from the latters. Specifically, Web 2.0 traffic is more bursty due to the underly-
ing human-independent automated data pre-fetching schemes. This work focuses on the
number of transfered bytes, the number of HTTP requests issued and the times between
subsequent request (Inter-request-times).
Our work compliments the efforts of the Web developer community towards a better
understanding of the Web 2.0 application characteristics. Some of our results may mo-
tivate the Web developer community to design Web application logics that are friendlier
to the network.
The rest of the paper is organized as follows. We give a brief overview of the Google
Maps application and our data collection process in Section 2. In Section 3 we present
our statistical analysis comparing AJAX traffic with HTTP traffic. We conclude with a
short summary in Section 4.
2 Methodology
To determine which AJAX based applications to study we first examine the popularity
of different applications, see Section 2.1. As Google Maps is among the popular appli-
cations and a nice example for illustrating the functioning of AJAX-enabled Web 2.0
applications we, in Section 2.2, provide a high level overview of its communication
patterns. Finally, we detail how to extract application characteristics from our data sets,
see Section 2.3.
2.1 Data Sets
We use packet level traces collected from two independent networks: the Münchener
Wissenschaftsnetz (Munich Scientific Network, MWN) [11] in Germany, and the Lawrence
Berkeley National Laboratories (LBNL, [12]) in the USA. Both environments provide
high speed Internet connections to their users. The MWN provides a 10 Gbps link ca-
pacity to roughly 55,000 hosts at two major universities and other research institutes,
transferring 3-6 TB a day. LBNL utilizes a 1 Gbps upstream link, transferring about
1.5 TB a day for roughly 13,000 hosts. We base our analysis on three traces of port 80,
the HTTP port, two, MWN-05 and MWN-07, from MWN and one from LBNL, LBNL-07.
We rely on packet level traces of large user populations as they provide the most
detailed data. From these traces we reconstruct the HTTP request-response stream of
all connections. While one could use a variety of tools [1], we utilize the HTTP ana-
lyzer of Bro [10], a network intrusion detection system. Bro’s policy script http.bro4
Trace Size Duration Start Date #Req #Req
Total GMaps
MWN-07 2.4 TB 32h+ Feb 24th 2007 30,0 M 222 K
LBNL-07 214 GB ∼9h Mar 3rd 2007 2,0 M0.5 82 K
MWN-05 2.5 TB 24h Oct 11th 2005
Table 1. Characteristics of the data sets
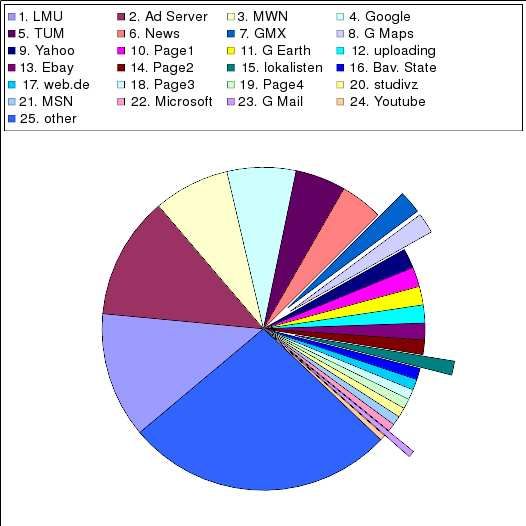
(a) Contribution by #Requests
Fig. 2. Contribution to the top 500 hostnames (100% are the top 500 only, representing 53.04%
of all requests)
together with the policy scripts http-reply.bro and http-header.bro enable TCP
stream re-assembly, basic HTTP analysis, and HTTP request-response analysis. We
augmented the http-header.bro script to log when the HTTP “GET” requests are
issued. This results in an output file with one-line summaries of each HTTP request
containing (TCP)Connection ID, number of request in the connection, session ID, trans-
ferred bytes, three timestamps (request issued, cookie seen, request finished), requested
hostname (servername1), prefix of the requested URL, and the HTTP status code for this
request. Note that the number of transferred bytes does not include the HTTP header
size. We only include requests for which we successfully record start and end times.
See Table 1 for information about the traces including: size, duration and start dates,
total number of HTTP requests, and number of Google Maps requests.
To be able to determine the most popular AJAX enabled Web 2.0 applications we
first identify the 500 most popular Web servers2 in the MWN-07 data set. We then group
these into multiple categories for better visualization. The first set of categories con-
tains the servers that are hosted by the two universities (TUM and LMU) and the other
research institutes (MWN). The next categories contains all request related to advertise-
ments (Ad Server) and news Web sites (News). Manual inspection shows that neither
category contains many AJAX related requests. Some of the services offered by Google,
1 We use server and host interchangeably in this discussion.
2 Web server as specified by the hostname in the HTTP request.5
including Google Maps and Google Mail, use AJAX others, i.e., Google search, Google
images and Google Earth, do not. Accordingly, we separate them into Google Maps
(G Maps), Google Mail (G Mail), Google Earth (G Earth), and all others (Google).
Another popular Web-email service in Germany that is also AJAX supported is pro-
vided by GMX (GMX). Some categories include just a single popular site (page 1, . . .
page 5), others are well known Web sites, e.g., Ebay (Ebay) and MSN (MSN). Figure 2
shows pie chart of the number of requests per category for the MWN-07 data set. We
find that GMX is the most popular AJAX based application with 2.27% of the requests
followed by Google Maps which contributes 2.04%. Another AJAX-enabled social net-
working web site is lokalisten.de with 1.4%. Although Google Mail only accounts
for 0.65% of the requests we include it as our fourth applications since it gives us two
AJAX-enabled Mail applications by different providers. In terms of bytes the contri-
butions are smaller, e.g., Google Maps with 1.41%. But all applications are among the
top 500. We refer to these applications as “Selected-4” in subsequent discussions.
2.2 Google Maps Communication
Google Maps has been one of the first Web applications to popularize AJAX tech-
nology. Consequently, it is widely considered as the canonical example of an AJAX
application. The term AJAX refers to a set of protocols and methods for creating inter-
active Web applications with improved responsiveness. This responsiveness is due to a
background data exchange between the client and the server without user-issued GET
requests. AJAX uses the Document Object Model (DOM) [9] of the Web browser in
such a way that it is no longer necessary to reload the entire web page each time it is
updated. In this manner it can increase interactivity, speed, and usability.
Google Maps maintains multiple connections to different servers in the Internet that
serve as back-ends for the Google Maps application. All connections use HTTP as the
session protocol and take advantage of the advanced features of HTTP 1.1’s [2] such as
persistent HTTP connections for efficiency and pipelining for reducing latency, leading
to multiple HTTP requests per TCP connection. In the context of Google Maps, most
of these connections are used to fetch new image tiles of the map and the rest are used
for control messages and for for the initial transfer of the AJAX application (JavaScript
code), the transfer of other GUI related pictures, and user queries. The connections
carrying tile images can be identified by the servers they connect to.
2.3 Application Characterization Methodology
" / " " /kh "
" /maps " " /mt "
" /mapfiles " " /mld "
" /mapstt " " /intl "
" /favicon.ico "
Table 2. URL prefixes used in Google Maps requests.6
In this section we discuss how to extract application specific data from our data
sets. For brevity reasons we focus on Google Map traffic. The strategies for the other
applications are similar.
One of the challenges of identifying Google Map traffic is that Google offers all its
services on the same back-end server infrastructure (e.g., Google Maps, Google Search,
Google Video, etc.) and uses an uniform key for all services. Therefore, the browser can
reuse existing TCP connections to Google servers to issue Google search queries, im-
age or video queries, as well as Google Maps queries. Separating out Google Maps
traffic from other Google services such requires some effort. Moreover to capture the
user’s interaction with Google Maps, we are not pre se interested in individual HTTP
requests but rather in the complete set of HTTP requests within a Google Maps “ses-
sion”. Meaning all requests that are issued when a user connects to maps.google.com
and then interacts with the application, e.g., by entering some location, by moving the
map, or switching the zoom level. Accordingly, we need to group these requests to a
Google Maps “session”.
To identify Google Maps related requests among the very large number of HTTP
requests within our traces we check if the hostname contains the string maps.google.
To find the other requests by the same user we take advantage of Google’s own session
book-keeping mechanisms. Google uses cookies to mark all requests of a session by
embedding a unique hash of its session ID3 . We use this ID as our session ID as well
and gather all other requests of this Google Maps session using the session ID. Unfor-
tunately, there maybe additional requests to other Google services among the identified
requests. We exclude these from further consideration if they do not contain a Google
Maps specific URL prefix. Our experience with Google Maps shows that these are easy
to identify, see Table 2. A similar methodology can be used for the other applications.
For comparison purposes, we also group all HTTP requests, including the Google
Maps requests, into Web sessions. In this case we cannot take advantage of the Google
cookie. Therefore we group those requests that come from the same client IP, go the the
same server on the same server port. This aggregates connections from different client
side ports. For both Google Maps sessions, and all HTTP sessions we use a timeout4 of
10 minutes.
Now we compute per connection and per session statistics including number of
transferred HTTP payload bytes, number of requests, durations, and inter-request times
for all four applications as well as all HTTP traffic.
3 Characteristics of AJAX traffic
In this section, we present the results of a statistical analysis of the characteristics of
both All-HTTP and Selected-4 traffic. Almost all connections and sessions are usually
comprised of multiple requests. However, we find significant differences in their session
characteristics including: session life times, transferred bytes per session, number of
requests within sessions, and inter-arrival times of HTTP requests within sessions.
3 The hash is located after the string PREF=ID= in the cookie.
4 If the time between the end of a reply and the start of the next request is larger than 10 minutes
a new session is started.7
0.25
log10(P[ HTTP payload data [bytes] > u])
0
MWN−07 All−HTTP
MWN−07 Google Maps
0.20
−1 MWN−07 Google Mail
LBNL−07 Google Maps
0.15
probability
−2
0.10
−3
MWN−07 All−HTTP
0.05
MWN−07 Google Maps
−4
MWN−07 Google Mail
MWN−07 GMX
10kB
0.0
MWN−07 lokalisten
−5
1 10 100 1000 100000 10000000 10^0 10^2 10^4 10^6 10^8
u [bytes] HTTP payload data [bytes]
(a) CCDF (b) PDF
Fig. 3. HTTP payload data in bytes per connection.
0.25
MWN−07 All−HTTP
0.20
MWN−07 Google Maps MWN−07 All−HTTP
0.20
MWN−07 Google Mail MWN−07 Google Maps
LBNL−07 Google Maps MWN−07 Remaining 3
0.15
0.15
probability
probability
0.10
0.10
0.05
0.05
10kB
0.0
0.0
10^−4 10^−2 10^0 10^2 10^4 10^0 10^2 10^4 10^6 10^8
Connection duration [sec] HTTP payload data [bytes]
(a) Durations per Connection (b) HTTP payload bytes per Session
Fig. 4. PDF of durations per connections and bytes per session
Most of the data is presented as probability density functions (PDF) although cumu-
lative distribution functions (CCDFs) are also shown. In order to capture the multiple
orders of magnitude in the data we plot all CCDFs on a log-log scale and compute the
probability density functions of the logarithm of the data to be able to use a logarithmic
X-axis. In addition, Table 3 presents selected mean and median values. We concentrate
our analysis on the MWN-07 data set and use the MWN-05 and LBNL-07 data sets to
highlight some of the differences, the 2005 data set was collected during Google Maps
beta phase, and similarities.
Figure 3(a) shows the CCDF of the number of bytes transferred in a single HTTP
connection for All-HTTP and all Select-4 applications for the MWN-07 data set. All-
HTTP connections are clearly consistent with a heavy-tailed distribution over several
orders of magnitude with a median of 332 B and a mean of 58 KB. Some connections
are clearly used to transfer a huge number of bytes, e.g, due to downloading some large
image or video file embedded within a HTTP page, or a big software package, or when
HTTP is used as transport protocol for P2P protocols, such as XXXX.
The tails of the AJAX based Selected-4 applications are not as heavy. Yet, except for
Google Mail the curves lie on top of the ALL-HTTP traffic for most of the plot which8
Connection
Connection
Connection
IRT’s in a
IRT’s in a
Bytes per
Bytes per
#Req per
#Req per
Session
Session
Session
Application
All-HTTP 57890 278K 4 13 2.34 17.23
Google Maps 204476 1396K 18 120 1.39 1.54
mean
Lokalisten.de 31856 112K 8 29 0.38 4.52
Google Mail 9742 105K 4 39 23.02 31.84
GMX 14163 59K 7 29 0.53 4.29
All-HTTP 332 688 1 2 0.0987 0.2035
Google Maps 25199 152727 4 7 0.0288 0.0076
median
Lokalisten.de 1678 6893 3 5 0.0347 0.0406
Google Mail 3 1904 1 5 4.3735 9.2202
GMX 428 3028 3 14 0.0400 0.0489
Table 3. Mean / Median Table for All-HTTP and Select-4 applications in the MWN-07 data set.
is reflected in the statistics as well, e.g., the median/mean for Google Maps is larger,
i.e., 25 KB/204 KB. To further explore the differences in the body of the distribution we
show the PDF for Google Maps and Mail as well as ALL-HTTP traffic in Figure 3(b). In
general we note that the Selected-4 applications, see Google Maps, transfer more bytes
than All-HTTP connections. This probably stems from multiple larger image/Javascript
library transfers, when for example, Google Maps users pan and zoom their map. In
particular, only 39.6% of the MWN-07 Google Maps connections comprise of connec-
tions that transfer less than 10 KB, whereas 81.8% of the All-HTTP connections from
MWN-07 transfer less than 10 KB. Similar observations hold for the LBNL-07 data set.
Moreover, we note that the shape of the All-HTTP connection has not changed sub-
stantially over the years if compared with results from 1997 [13]. Google Mail differs
and shows a clear spike for 3 bytes requests. This is due to periodic server polling by
the client-side AJAX engine of Google Mail. Once we move from HTTP connections
to HTTP session, see Figure 4(b), this artifact is removed and the probability mass of
all Selected-4 applications clearly lies to the right of that for ALL-HTTP traffic. This is
reflected in the median but not in all means. But recall that the mean is dominated by
the very large transfers within the ALL-HTTP traffic.
We next move to the number of HTTP request within a session. Figures 5(a) and 5(b)
show the CCDF for All-HTTP and Selected-4 sessions in the MWN-07 data set. These
figures highlight the “chatty” nature of the Selected-4 Web 2.0 applications - on average
they issue many more requests than All-HTTP traffic whose first fifty percent of the
sessions are limited to 2 requests. Part of these additional requests are due to the Web 2.0
characteristics of the Selected-4 applications while the others are likely due to longer
session duration. Interestingly, a look at the PDF reveals that Google Maps issues more
requests than the email or social networking applications. A likely explanation is that
Google Maps is the application that benefits most from pre-fetching.
The typical duration of an ALL-HTTP connections is shorter than for AJAX enabled
applications. More than 50% of ALL-HTTP connections are between XXXX and XXX
seconds (5% – 55% quantile) while it is between XXX and XXX seconds (25% – 75%9
0
0.6
MWN−07 All−HTTP
log10(P[ #HTTP requests > u]) MWN−07 Google Maps
−1 MWN−07 Remaining 3
0.4
−2
probability
−3
0.2
MWN−07 All−HTTP
−4
MWN−07 Google Maps
MWN−07 Google Mail
MWN−07 GMX
0.0
−5
MWN−07 lokalisten.de
1 10 100 1000 10000 1 10 100 1000 10000
u [#requests] #HTTP requests
(a) CCDF (b) PDF
Fig. 5. Number of requests per session.
MWN−07 All−HTTP MWN−07 All−HTTP
0.20
0.20
MWN−05 All−HTTP MWN−07 Google Mail
MWN−07 Google Maps MWN−07 GMX
LBNL−07 Google Maps MWN−07 lokalisten
0.15
0.15
probability
probability
0.10
0.10
0.05
0.05
1sec
1sec
0.0
0.0
10^−6 10^−4 10^−2 10^0 10^2 10^−6 10^−4 10^−2 10^0 10^2
inter request times [s] inter request times [s]
(a) All-HTTP and Google Maps (b) Google Mail, GMX and lokalisten
Fig. 6. PDF of inter-request times within each session.
quantile) for Google Maps in the MWN-07 data set. On the other hand the first period
only accounts for XXXX% of the Google Maps session while the second only accounts
for XXX% of the ALL-HTTP traffic. One reason for the longer session duration may
be that these specific applications are able to keep the users attention longer than a
typical Web site. Overall these characteristics indicate that AJAX enabled applications
last longer and are more active than All-HTTP sessions.
Finally, Figure 6 shows the inter-request times between requests within a session.
The most interesting feature of this density graph is that Google Maps’ inter-request
times are very similar and significantly shorter, i.e., more frequent, than for ALL-HTTP
for both MWN-07 and LBNL-07. Moreover there has not been a major change for ALL-
HTTP from 2005 to 2007. The majority of requests are clearly automatically generated,
as they are executed within 1 second (see support line; > 1 second corresponds roughly
to human-issued browser request) in all sessions. Google Maps is again the most ex-
treme application, most likely due its ability to pre-fetching for supporting the dynamic
features of Google Maps.
Moreover we note that different service provider can use the AJAX capabilities
in different manners. GMX and Google Mail are both Web based email applications.10
Yet, the interrequest times differ dramatically. The reason for this is that Google Mail
uses a roughly 120 second polling interval (those 3 Bytes requests from Figure 3(b)).
Once these are removed the densities are quite similar again. Also the GMX and the
Lokalisten.de distributions are rather similar.
4 Conclusions
The overall transition of the Web from a hyperlinked document repository into a real-
time application platform has ramifications for the underlying Internet over which Web
traffic is transfered. In this paper we highlight characteristics of some popular Web 2.0
applications, in particular - Google Maps, Google Mail, Lokalisten.de, and GMX Mail.
We report that these applications are heavy (bytes transferred), chatty (many more re-
quests), and greedy (actively pre-fetching data). Our analysis of their traffic patterns
suggests that their characteristics translate into more aggressive and bursty network us-
age as compared to the overall HTTP traffic.
Moreover, as compared to media streaming this new HTTP traffic cannot be treated
as relatively deterministic flows. At the same time, end users have come to expect con-
temporary Web applications to be as responsive as locally installed software applica-
tions and this makes the QoS requirement very high.
Web application developers have embraced data pre-fetching, HTTP connection
persistence, HTTP pipelining, and other advanced features to mask network latency
from end users. The results in this paper may help Web application developers in un-
derstanding how their applications affect Internet traffic, and how their applications can
be designed for more efficient operation.
References
1. Krishnamurthy, B., Rexford, J.: Web protocols and practice: HTTP/1.1, Networking proto-
cols, caching, and traffic measurement. Addison-Wesley (2001)
2. Fielding, R., Gettys, J., Mogul, J., Frystyk, H., Masinter, L., Leach, P., Berners-Lee, T.: Rfc
2616, hypertext transfer protocol – http/1.1 (1999)
3. Zakas, N., McPeak, J., Fawcett, J.: Professional AJAX. Wiley (2006)
4. M. Crovella, P.B.: The network effects of prefetching. In: INFOCOM. (1998)
5. Abrams, M., Standridge, C.R., Abdulla, G., Williams, S., Fox, E.A.: Caching proxies: limi-
tations and potentials. In: WWW Conference. (1995)
6. Barford, P., Bestavros, A., Bradley, A., Crovella, M.E.: Changes in Web client access pat-
terns: Characteristics and caching implications. World Wide Web (1999)
7. Challenger, J., Iyengar, A., Danzig, P.: A scalable system for consistently caching dynamic
Web data. In: INFOCOM. (1999)
8. The impact of AJAX on web operations (2005) http://www.bitcurrent.com/?p=105.
9. Document Object Model (DOM) (2007) http://www.w3.org/DOM.
10. Paxson, V.: Bro intrusion detection system (2007) http://www.bro-ids.org.
11. Leibniz Rechenzentrum LRZ: Münchner Wissenschaftsnetz MWN (2007) http://www.
lrz-muenchen.de/wir/intro/en/#mwn.
12. Lawrence Berkeley National Lab (LBNL) (2007) http://www.lbl.gov.
13. Feldmann, A., Rexford, J., Caceres, R.: Efficient policies for carrying Web traffic over flow-
switched networks. IEEE/ACM Trans. Networking 6(6) (1998)You can also read