Using Google Maps to collect spatial responses in a survey environment
←
→
Page content transcription
If your browser does not render page correctly, please read the page content below
Using Google Maps to collect spatial responses in a survey environment

                                      Nick Bearman1, Katy Appleton1
              1
               School of Environmental Sciences, University of East Anglia, Norwich, NR4 7TJ
                             Tel. +44 (0)1603 591346 Fax. +44(0)1603 591327
               Email. n.bearman@uea.ac.uk, k.appleton@uea.ac.uk, www.nickbearman.me.uk

    ABSTRACT: This paper examines the use of Google Maps-based tools to collect spatial responses
      from participants during academic research surveys conducted via the Internet. Using two recent
    examples from the University of East Anglia it discusses the online survey context and how Google
    Maps was used, issues surrounding the technical implementation of these tools, processing and use of
     the collected data, and concludes with considerations for future research that might employ similar
                                                  methods.

            KEYWORDS: surveys, spatial data collection, Internet mapping, Google Maps API

1. Introduction

Internet surveys are now a common way of gathering data for academic research and although there
are caveats about their use in terms of representativeness (Peng, 2001), this paper specifically
considers the collection of spatial data responses within a survey, as opposed to the general use of
online surveys themselves. In standard HTML forms and third-party (e.g. SurveyMonkey) surveys,
responses are usually limited to the selection or ranking of one or more pre-set options and the input of
free text. Spatial information, if elicited, is commonly in the form of postcodes or named locations
such as towns. Some research applications, however, require more precise spatial information for later
GIS analysis. This is generally not catered for within third-party tools, but can be achieved within
bespoke surveys by using an Application Programming Interface (API) for an online mapping service
such as Google Maps (Google, 2010a). An API is a set of 'building blocks' - tools, data structures and
functions - allowing relatively easy programmatic access to and customisation of a web service.
This paper outlines two examples from recent research at the University of East Anglia where the
Google Maps API (GMAPI) has been used to provide an interface for spatial data input within a
survey. It discusses issues related to these two specific implementations, followed by more general
considerations about the use of such tools and their implications for academic research.

2. Case studies

2.1 Sonification of uncertainty in spatial data

This case study compared visual and sonic methods of representing uncertainty in spatial data,
specifically UK Climate Projections 2009 (UKCP09) data (Jenkins et al., 2009). One way of showing
uncertainty information more effectively is to use sound in combination with vision, and this has been
addressed from a theoretical and practical point of view (Krygier, 1994; Fisher, 1994). Sonification
can be particularly useful to show an extra layer of data, if no more could be added visually without
obscuring the underlying data (for more details, see Bearman & Lovett, 2010). Respondents were
shown maps overlaid with datasets from the UKCP09 series and asked to highlight areas meeting
certain criteria (e.g. exceeding a stated value) using a ‘paintbrush type’ tool over the Google Maps
interface displaying a KML (Keyhole Markup Language (OGC, 2010)) file of the UKCP09 data
(Figure 1). The evaluation1 also had a number of multiple choice questions. All responses were written
to a MySQL database.

1
    Available at: http://sonicsurv.uea.ac.uk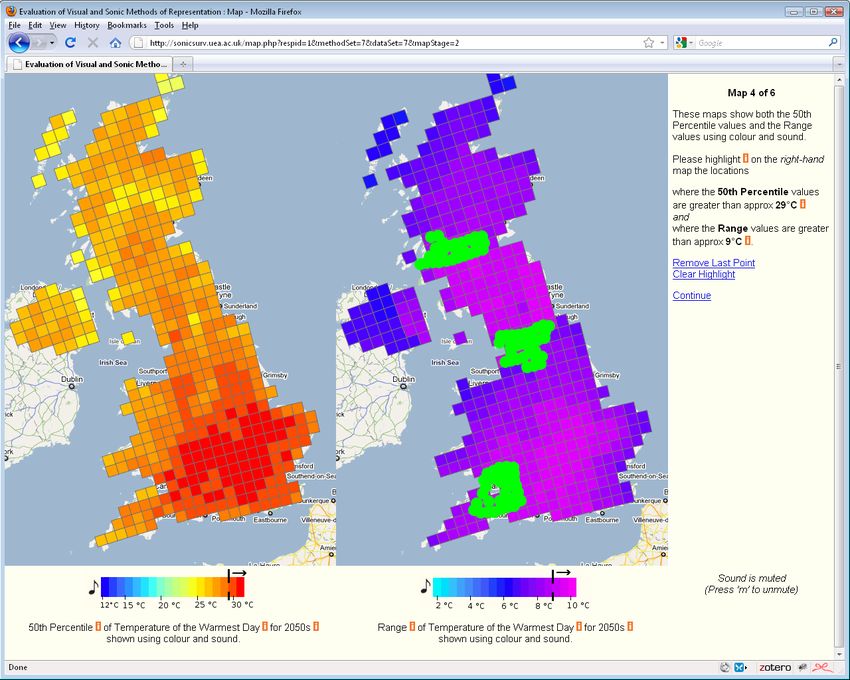
Figure 1. Screenshot of Google Maps interface with UKCP09 overlay and an area highlighted. The
respondents were not allowed to pan or zoom the map.
An Internet-based approach was chosen due to its simpler software requirements (previous work used
ArcGIS 9.2 (Bearman and Lovett, 2010)). Evaluations were mostly run in small groups (6-8 people)
and were followed by a discussion session where qualitative data on participants views of the
sonification and interface were gathered. Additionally, the survey could be completed remotely, which
was particularly useful for users of the UKCP09 data (such as local authority policy-makers), who are
geographically dispersed.
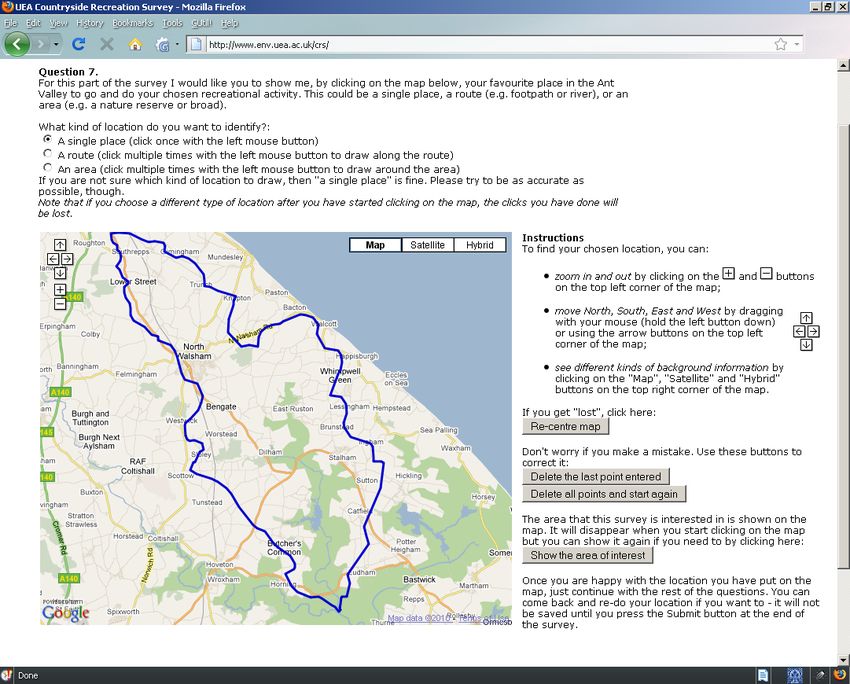
2.2 Countryside recreation in the Norfolk Broads
This case study investigated locations for countryside recreation in the River Ant catchment of the
Norfolk Broads. Participation was invited via email contacts and relevant online forums; 71 responses
were received online, plus 66 offline (which are not considered further in this paper). It used a simple
form-based questionnaire2 (employing HTML, PHP and JavaScript) featuring multiple-choice and
free-text responses in addition to a map-based question; user responses were written directly to a
MySQL database. The map-based question (Figure 2) used GMAPI to request a single point, line or
area feature to show the preferred location for a chosen activity. The spatial response was requested in
order to allow locations to be identified in detail and analysed alongside existing datasets to
investigate the importance of landscape and other factors for user preference. GMAPI was also used
on the introductory page, providing a navigable map to illustrate the area of interest. The survey only
examined recreation preferences and did not ask respondents to comment on the map interface.
2
Available at: http://www.env.uea.ac.uk/crsFigure 2. Screenshot of Google Maps interface requesting input. The respondents were allowed to pan
and zoom the map, and choose the base layer.
3. Why use an online survey?
An online survey was used for reasons similar to those discussed by Wherrett (1999). Primarily it was
to access a wider population than would be possible from fieldwork alone, particularly in terms of
including recreation away from obvious facilities such as visitor centres. Web links are easily
distributed via contacts, online forums and social media, and an online survey can also be completed at
a convenient time. Finally, the ability to write survey responses directly to a database both saves time
and prevents data entry errors.
3.1 Why Google Maps API?
GMAPI was chosen for these case studies largely due to the dominance of Google Maps in online
mapping (Ellul et al., 2009; Hitwise, 2010a, 2010b), with the conclusion that this would give the
greatest chance of existing user familiarity with the interface and base mapping style. The cartography
of the base maps is clearer in many ways than alternatives Bing Maps and Yahoo! Maps (O'Beirne,
2010), both of which also offer an API (Microsoft, 2010; Yahoo!, 2010). The existence of resources to
assist with development was the other main motivation for choosing GMAPI; online documentation,
tutorials and user forums are more developed than for the alternatives, and experience within the
department was also a consideration.
4. Related research examples
Google Maps and Google Earth are well-used for presenting spatial information to varied audiences,
both in an official capacity (e.g Brent Council, 2010; Westminster City Council, 2010) and via more
informal "mashups" (e.g. MapTube 2010; Google Maps Mania 2010). They are also used to collect
spatial information for re-presentation on the same online mapping base, i.e. Volunteered Geographic
Information (see Goodchild 2007; Heipke, 2010). However, a literature search has not revealed otherwork that has, as part of a questionnaire, specifically requested (and used in later GIS analysis) the sort of precise spatial information gathered in the two case studies. Ellul et al. (2009) report on a community mapping website requesting and sharing user-entered spatial data; storage methods do allow future GIS analysis of that data, but such work is not the project's focus. Rosser (2010) used GMAPI within a Facebook application to gather data on vernacular areas, extending earlier work on capturing fuzzy areas (Evans & Waters, 2008) using raster data. This paper, contrastingly, focuses on the input of more definite (vector) location data. 5. Discussion - use of Google Maps API within the case studies 5.1 Setting up the survey - design/coding Neither of the authors had a great deal of coding experience and extensive use was made of online resources to make the maps look and behave as desired. The recreation survey’s spatial question was implemented based upon two tutorials covering the creation of a digitiser function using GMAPI v2, and interfacing GM with a MySQL database (Google, 2010b, 2010c respectively), with additional assistance from the Google Groups help forum. The sonification survey used the same examples as a starting point, moving to v3 of the GMAPI and utilising Flash to handle the sound (Ribeiro Amigo, 2006). In general, learning to use the API for these applications was not significantly complicated, but did require additional time. Some problems were encountered, such as combining code from different versions of the API and ensuring browser compatibility (see below), but these were largely resolved through online resources. On the whole, coding a robust and user-friendly survey took longer than anticipated in both case studies; while this was not solely due to GMAPI, the additional consideration of creating a clear, map interface that would elicit the required information did add to the time taken. 5.2 Compatibility and reliability Both case studies were developed in Firefox 3.5/3.6. Wider compatibility with other browsers was important for the recreation case study, and Internet Explorer had to be forced to work in compatibility mode. The more complex coding for sonification would have required significantly more work, and since the survey design meant that Firefox was sufficient, further compatibility was not pursued. For larger surveys it would be necessary to test GMAPI implementation using alternative browsers and hardware, to ensure accessibility. Both case studies were reliant on Google Maps performing as expected when the survey was taken. For example, map tiles may be received slowly or not at all, leaving gaps in the base map or potentially causing the survey to be abandoned – feedback on this issue was not solicited. The use of any third-party map service is vulnerable to data updates. Visual content may be updated, but perhaps more important is spatial registration, particularly imagery (Goodchild, 2009) – low accuracy could be significant for surveys involving digitising. The GMAPI interface used to customise the interaction with the map may also change. The sonification study suddenly began to display additional, unwanted controls. As many other API users were affected, solutions were available through relevant forums, but this does highlight the issue of relying on a service that may change without notice. In general, both of the surveys worked well and there were no known major problems with browser compatibility or Google reliability. The most significant impact was when the network connection was disrupted during some of the sonification evaluation sessions causing them to be rescheduled. However this problem can be considered a potential drawback of any online survey methodology. 5.3 The maps in use
In both case studies, information was overlaid on the base map using a KML file. The KML Layer
class of GMAPI is perhaps less well developed than other classes, and there were some interaction
problems. In the countryside survey clicking on the map to digitise also cleared the study area
boundary from the map. This may have been beneficial in removing map clutter while digitising, but
for the sonification study the KML needed to remain and so the click had to be handled differently.
The documentation was unclear as to whether this behaviour was intended. The sonification data
occasionally required a browser refresh to load all KML tiles, but this was less problematic in a
supervised survey.

The countryside survey also revealed problems digitising concave polygons: Google Maps interprets
mouse clicks within the presumed area of an unfinished polygon as a click on the polygon feature
itself, rather than a click on the underlying map, and is unable to retrieve latitude and longitude values.
. This is believed to be solvable with more complex coding, but time limitations meant that instead an
explanatory message and request to click beyond the feature being drawn was implemented, possibly
frustrating users.

5.4 Data obtained

The spatial data obtained from the recreation survey was written to a database table, subsequently
imported to ArcGIS as a collection of points, and reconstructed as lines or polygons where necessary.
This type of simple output is able to be processed using any of the increasingly available tools for GPS
data.

Analysis continued by buffering the point and line features and combining them with the polygons to
create a “heat map” showing how many times each area had been digitised. It is clear that there are
issues with the accuracy of digitising, which will have implications for the ongoing analysis.
Examination of the line data, for example, revealed examples for waterborne activities that were 400m
from the river. A useful refinement for any future use of this GMAPI code would be to record which
zoom level and base map settings the user chose while digitising. Asking for additional text
information (e.g. "riverside walk from X to Y") could provide further support.

The sonification case study stored users' input as individual points in the MySQL database, to be
processed later into a surface layer and compared with the ‘correct’ answer. Data collection is ongoing
for this case study, and a full analysis will be included in the presentation. Initial analysis showed that
using sound to reinforce data shown visually increased participants ability to select the correct area.

5.5 Methodological issues for academic research

Academic research should be reproducible, and in addition to a standard methodology report, it is
natural to include a demonstration of any online surveys used. With any work based on computer
technology it is inevitable that at some point the code or files created will no longer work; for
example, each major version of GMAPI will only be supported by Google for 3 years after
deprecation (Google, 2010d), and browser standards and compatibilities will also develop.

Therefore, as well as a copy of the source code (fully commented), a conceptual representation of the
processes involved, such as a flow chart, should be kept, to allow the data collection methods to be
replicated with tools that are available in the future. A further possible solution would be to have a
video of the working application to show the user experience, including sound in the case of the
sonification study.

6. Conclusions
Google Maps API offers a useful, reasonably accessible (to authors) and familiar (to respondents) way
to elicit spatially-referenced responses within research surveys. There are some limitations to the
information that can be obtained, and considerations to be made when designing a survey using
GMAPI, that require careful thought about the intended use.

Any survey that is to be completed unsupervised needs to be carefully designed. There must be clear
instructions and robust error trapping for both the non-spatial and spatial parts of the survey but this
may well be more important for map-based input because respondents are likely to be less familiar
with providing this type of information. Related to this, there is a need for research into the question of
digitising accuracy, and whether this can be improved through on-screen instructions or map interface
settings.

Technically, there are unknowns related to the persistence and consistency of the API over time that
increase the importance of conceptual documentation of any use of the API within a survey, as well as
a reference copy of the final code. However, if use of GMAPI for survey purposes continues to be
developed and progress shared, it has the potential to become an accessible and extremely useful tool
for research data collection.

7. Acknowledgements

Nick Bearman’s research has been conducted as part of ESRC/NERC PhD Studentship No.
ES/F012454/1 with additional financial support from Ordnance Survey. Financial support towards the
cost of presenting at the GISRUK 2011 conference in Portsmouth was provided by the QMRG
(Quantitative Methods Research Group) of RGS-IBG. Katy Appleton's research is funded by the
ESRC under an Interdisciplinary Early Career Fellowship, reference RES-229-27-0006.

8. References

Bearman N and Lovett A (2010). Using Sound to Represent Positional Accuracy of Address
Locations. The Cartographic Journal, 47(4), 308-314.
Brent Council (2010). Interactive Maps. Available from http://www.brent.gov.uk/maps (accessed 17th
December 2010).
Ellul C, Haklay M, Francis L and Rahemtulla H (2009). A Mechanism to Create Community Maps for
Non-Technical Users. Proceedings of the International Conference on Advanced Geographic
Information Systems and Web Services, GEOWS 2009, Article number 4782704, p. 129-134.
Evans A and Waters T (2008). Mapping vernacular geography: web-based GIS tools for capturing
“fuzzy” or “vague” entities. International Journal of Technology, Policy and Management, 7(2), 134-
150.
Fisher P F (1994). Hearing the Reliability in Classified Remotely Sensed Images. Cartography and
Geographic Information Systems, 21(1), 31-36.
Goodchild M (2007). Citizens as sensors: the world of volunteered geography. GeoJournal, 69(4),
211-221, DOI: 10.1007/s10708-007-9111-y.
Goodchild M (2009). Virtual Geographic Environments as Collective Constructions. In: Li H and
Batty M (eds) Virtual Geographic Environments. Science Press: Beijing, 15-24.
Google (2010a). Google Maps API Family. Available from: http://code.google.com/apis/maps/
(accessed 17th December 2010).
Google (2010b). Creating a Simple Digitizer Using the Google Maps API. Available from:
http://code.google.com/apis/maps/articles/ezdigitizer.html (accessed 17th December 2010).
Google (2010c). From Info Windows to a Database: Saving User-Added Form Data. Available from:
http://code.google.com/apis/maps/articles/phpsqlinfo.html (accessed 17th December 2010).
Google (2010d). Google Maps/Google Earth APIs Terms Of Service, Section 4.4: Termination of the
Service. Available from: http://code.google.com/apis/maps/terms.html#section_4_4 (accessed 17th
December 2010).
Google Maps Mania (2010). Available from: http://googlemapsmania.blogspot.com/ (accessed 17th
December 2010).
Heipke C (2010). Crowdsourcing geospatial data. ISPRS Journal of Photogrammetry and Remote
Sensing, 65(6), 550-557.
Hitwise (2010a). Hitwise United Kingdom Data Centre. Available from:
http://www.hitwise.com/uk/datacentre/main/dashboard-7323.htm (accessed 17th December 2010).
Hitwise (2010b). Hitwise US/Worldwide and Travel Data Centre. Available from:
http://www.hitwise.com/us/datacenter/main/ (accessed 17th December 2010).
Jenkins G, Murphy J, Sexton D, Lowe J, Jones P and Kilsby C (2009). UK Climate Projections:
Briefing report. Met Office Hadley Centre, Exeter, UK. Available from:
http://ukclimateprojections.defra.gov.uk/ content/view/644/500/ (accessed 17th December 2010).
Krygier J B (1994). Sound and Geographic Visualization. In: Visualization in Modern Cartography.
Elsevier Science: Oxford, UK, 149-166.
MapTube (2010). Available from: http://www.maptube.org (accessed 17th December 2010).
Microsoft (2010). Bing Maps Developer Resources. Available from:
http://www.microsoft.com/maps/developers/web.aspx (accessed 17th December 2010).
O'Beirne J (2010). A Brief Comparison of Google Maps, Bing Maps, & Yahoo! Maps. Available
from: http://www.41latitude.com/post/557224600/map-comparison (accessed 17th December 2010).
OGC - Open Geospatial Consortium (2010). KML Standard. Available from:
http://www.opengeospatial.org/ standards/kml (accessed 17th December 2010).
Peng Z (2001). Internet GIS for public participation. Environment and Planning B: Planning and
Design 28(6), 889-905.
Ribeiro Amigo G (2006). Javascript Sound Kit. Available from: http://jssoundkit.sourceforge.net/
(accessed 17th December 2010).
Rosser J and Morley J (2010). Rate-my-place: a social network application for
crowd-sourcing vernacular geographic areas. Proceedings of GISRUK 2010, London, UK, Available
from: http://discovery.ucl.ac.uk/19284/1/19284.pdf (accessed 17th December 2010), p.155-160.
Westminster City Council (2010). Find it in Westminster. Available from:
http://www.westminster.gov.uk/ (accessed 17th December 2010).
Wherrett J (1999). Issues in using the internet as a medium for landscape preference research.
Landscape and Urban Planning, 45(4) 209-217.
Yahoo! (2010) Yahoo! Maps Web Services. Available from: http://developer.yahoo.com/maps/
(accessed 17th December 2010).

9. Biography

Nick Bearman is studying for a PhD at UEA in Environmental Science, researching different
methods of representing uncertainty using sound in a variety of spatial data environments. As
well as UKCP09 data, these include Ordnance Survey Address Layer 2 and representation of
varying uncertainty of future landscape visualisation in a Virtual Reality setting.

Katy Appleton is Research Officer for the SSEVREL (Social Science for the Environment -
Virtual Reality Laboratory) facility in the School of Environmental Sciences at UEA. Her
research interests include GIS-based landscape visualisation for environmental
communication and decision-making, and multifunctional landscape management.
You can also read