INVESTIGATING THE PERFORMANCE OF RANDOM FOREST AND SUPPORT VECTOR REGRESSION FOR ESTIMATION OF CLOUD-FREE NDVI USING SENTINEL-1 SAR DATA
←
→
Page content transcription
If your browser does not render page correctly, please read the page content below
The International Archives of the Photogrammetry, Remote Sensing and Spatial Information Sciences, Volume XLIII-B3-2020, 2020
                                               XXIV ISPRS Congress (2020 edition)

      INVESTIGATING THE PERFORMANCE OF RANDOM FOREST AND SUPPORT
        VECTOR REGRESSION FOR ESTIMATION OF CLOUD-FREE NDVI USING
                           SENTINEL-1 SAR DATA

                                             J.D.Mohite1∗, S.A.Sawant1 , A.Pandit1 , S. Pappula2

                                  1
                                   TCS Research and Innovation, Tata Consultancy Services, Mumbai, India
                              2
                                  TCS Research and Innovation, Tata Consultancy Services, Hyderabad, India
                                    (jayant.mohite, suryakant.sawant, ankur.pandit, srinivasu.p)@tcs.com

                                                       Commission TCIII, WG IVb

KEY WORDS: Cloud-Free NDVI, SAR, Random Forest Regression, Sentinel 1, Sentinel 2

ABSTRACT:

The current study focuses on the estimation of cloud-free Normalized Difference Vegetation Index (NDVI) using the Synthetic Aperture
Radar (SAR) observations obtained from Sentinel-1 (A and B) sensor. South-West Summer Monsoon over the Indian sub-continent
lasts for four months (mid-June to mid-October). During this time, optical remote sensing observations are affected by dense cloud
cover. Therefore, there is a need for methodology to estimate state of vegetation during the cloud cover. The crops considered in
this study are Paddy (Rice) from Punjab and Haryana, whereas Cotton, Turmeric, and Banana from Andhra Pradesh, India. We have
considered, observations of Sentinel-1 and Sentinel-2 sensors with the same overpass day and non-cloudy pixels for each crop. We used
Google Earth Engine to extract surface reflectance for the Sentinel-2 and Ground Range Detected (GRD) backscatter for Sentinel-1.
The Red and NIR bands of Sentinel 2 were used to estimate NDVI. Sentinel-1 based VV, and VH backscatter was used for estimation of
Normalized Ratio Procedure between Bands (NRPB). Regression analysis was performed by using NDVI as an independent variable,
and VV, VH, NRPB, and radar incidence angle as dependant variables. We evaluated the performance of Linear regression with tuned
Support Vector Regression (SVR) as well as tuned Random Forest Regression (RFR) using the independent data. Results showed that
the RFR produced the lowest RMSE for all the crops in the study. The average RMSE using the RFR was 0.08, 0.09, 0.11, and 0.10
for Rice, Cotton, Banana, and Turmeric, respectively. Similarly, we have obtained R2 values of 0.79, 0.76, 0.69, and 0.71 for the same
crops using the RFR. A model with 80 trees produced the best results for Rice and Cotton, whereas the model with 90 trees produced
the best results for Banana and Turmeric. Analysis with NDVI threshold of 0.25 showed improved R2 and RMSE. We found that for
grown crop canopy, SAR based NDVI estimates are reasonably matching with the optical NDVI. A good agreement was observed
between the actual and estimated NDVI using the tuned RFR model.

     1. INTRODUCTION AND STATE OF THE ART                               (2019)), yield estimation (Mohite et al. (2019)), etc. Various
                                                                        methods based on the vegetation indices have been proposed in
Continuous regional crop mapping and monitoring is essential es-        the past for agricultural applications. The Normalized Difference
pecially in countries like India to keep a track on spatio-temporal     Vegetation Index (NDVI) is one of the widely used vegetation in-
coverage of various crops. This information can be consumed             dex (Rouse et al. (1974)). NDVI is derived using the Red and
by various stakeholders like the government for the planning of         Near Infrared (NIR) bands of optical satellites such as Sentinel-
various import-export activities, agri-input companies for facili-      2, Landsat-8, MODIS Terra and Aqua, etc. However, loss of
tation of various fertilizers/chemicals, farmers to get the status of   information due to the presence of clouds in the optical dataset
their crop in real-time (Mohite et al. (2018)). Satellite based re-     restricts its utilization to its maximum extent. In India, Kharif
mote sensing sensors are being effectively used over the years for      season is the main cropping season which starts in mid-June with
continuous crop mapping and monitoring. Such methods are al-            the onset of the Indian Summer Monsoon (ISM) and extends up-
ways preferred over manual surveys due to efficiency in terms of        to November. During this season Indian sub-continent is mostly
time, accuracy, spatial coverage, etc. Space exploration agencies       covered with the dense clouds.
such as the Indian Space Research Organization and international
agencies such as the National Aeronautics and Space Adminis-            Numerous attempts have been made for the cloud removal and
tration (NASA), European Space Agency (ESA) have launched               cloud induced gap filling in the optical data using the time-series
multiple Optical (IRS, Landsat 5,7,8, MODIS Terra, Aqua, Sen-           information and information available in the neighborhood pix-
tinel 2) as well as Synthetic Aperture Radar (RISAT-1, Sentinel         els (Roerink et al. (2000); Padhee and Dutta (2019); Adam et
1) satellites. These satellites are extensively being used for crop     al. (2018)). Nonetheless, the cloud removal process is useful in
mapping and monitoring.                                                 the presence of thin clouds and can be performed effectively but
                                                                        such process can not be considered successful in the case of thick
Optical satellites provide rich spectral information in multiple        clouds. Also, these methods can not be very useful in India dur-
wavelength bands which offer advantages for various agricul-            ing the Kharif season (June-October) when there is thick cloud
ture applications such as crop type identification (Mohite et al.       cover over most of the season. Alternatively, the Synthetic Aper-
(2018)), crop monitoring, crop loss assessment (Sawant et al.           ture Radar (SAR) sensor can collect continuous data in cloudy
  ∗ Corresponding   author                                              conditions as well as during day/night. Hence, synergistic use

                                                 This contribution has been peer-reviewed.
                  https://doi.org/10.5194/isprs-archives-XLIII-B3-2020-1379-2020 | © Authors 2020. CC BY 4.0 License.                1379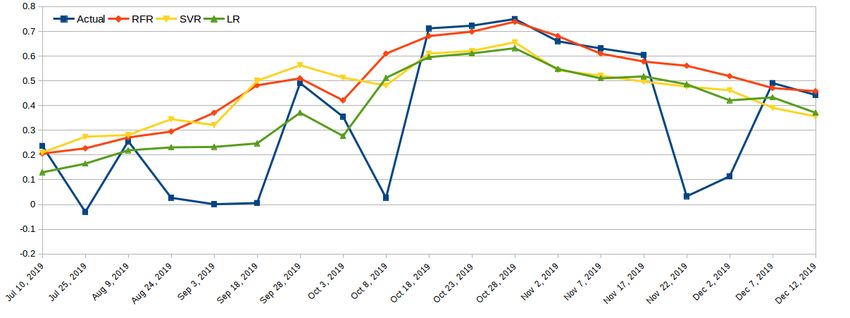
The International Archives of the Photogrammetry, Remote Sensing and Spatial Information Sciences, Volume XLIII-B3-2020, 2020
XXIV ISPRS Congress (2020 edition)
of optical and SAR sensor observations can generate the con- 2.2.1 Sentinel-2 Data and Preprocessing ESA launched the
tinuous stream of NDVI time-series for vegetation monitoring. constellation of optical satellite Sentinel-2 A and B which pro-
Studies have attempted to estimate the NDVI using SAR obser- vides the earth observation in 10, 20 and 60 meter spatial res-
vations (Capodici et al. (2013); Davidse (2015); Filgueiras et al. olution at five days repeat period (ESA (2020b)). Observations
(2019); Mazza et al. (2018); Navarro et al. (2016); Vreugdenhil provided by Sentinel 2 are available in the 13 spectral bands
et al. (2018)). Capodici et al. (2013) have shown that temporal mainly visible and NIR at 10 meters, red edge and SWIR at
changes of HV backscatter acquired with off-nadir angle greater 20 meters, and atmospheric bands at 60 meters spatial resolu-
than 40 degree best correlates with variations in the vegetation tion, respectively. For research purposes, Google Earth Engine
index from optical data. The study has a dependency on histor- cloud platform (Gorelick et al. (2017)) provides the collection
ical optical and SAR observations. Frison et al. (2018) showed of time-series Sentinel 2 Level-2A orthorectified atmospherically
a strong relationship between Sentinel-1 backscatter and vege- corrected surface reflectance data. In the present study, the data
tation phenology derived from Landsat-8. Mazza et al. (2018) in Red and NIR bands was accessed from GEE to estimate the
have developed a CNN based model to derive NDVI from SAR NDVI. Table 1 shows the location specific availability of Sentinel-
data. Filgueiras et al. (2019) established the regression-based re- 2 data overlapping (or 1 day difference) with the Sentinel-1 over-
lationship between Sentinel-1 SAR and NDVI from Sentinel-2 pass date. First number in the pair (1) shows the Sentinel-1 over-
to derive the continuous cloudless NDVI for Soybean and Maize pass date, however second number represents Sentinel-2 overpass
(Corn). The study was focused on adjacent fields from a small date. Pixels with no cloud cover were considered for model de-
area. Limitations of the research studies are a) the dependency velopment. NDVI threshold is used for obtaining the cloud-free
on data from optical sensors for model development, b) methods pixels.
are limited to certain incidence angles, c) heterogeneity in the
spatial and temporal resolution of the SAR and Optical observa- 2.2.2 Sentinel-1 Data and Pre-processing Sentinel-1 satel-
tions and d) geographical coverage for the model development. lite mission launched by ESA also has a constellation of two
The current study focuses on the estimation of cloud-free NDVI satellites 1-A and 1-B (ESA (2020a)). Data has been captured
using the SAR observations obtained from Sentinel-1 sensor. The in dual-polarization by C-band Synthetic Aperture Radar. Satel-
proposed method explores the Linear Regression (LR), Support lite provides the observations at 5 meter in range and 20 me-
Vector Regression (SVR) and Random Forest Regression (RFR) ter in azimuth direction with 6 days repeat period. GEE (Gore-
for estimation of NDVI using SAR observations. The study was lick et al. (2017)) has a collection of S1 Ground Range Detected
conducted during the Kharif season of the year 2019 for two re- (GRD) scenes, processed using the Sentinel-1 Toolbox to gener-
gions of India. ate a calibrated, ortho-corrected product. The GRD product has
been generated by pre-processing the scenes for thermal noise re-
moval, radiometric calibration and terrain correction (Filipponi
2. MATERIALS AND METHODS
(2019)). Sentinel-1 C-band SAR has all weather, day-night ca-
2.1 Study Area pability hence all the observations available during the growing
season are useful for the analysis. We have accessed backscatter
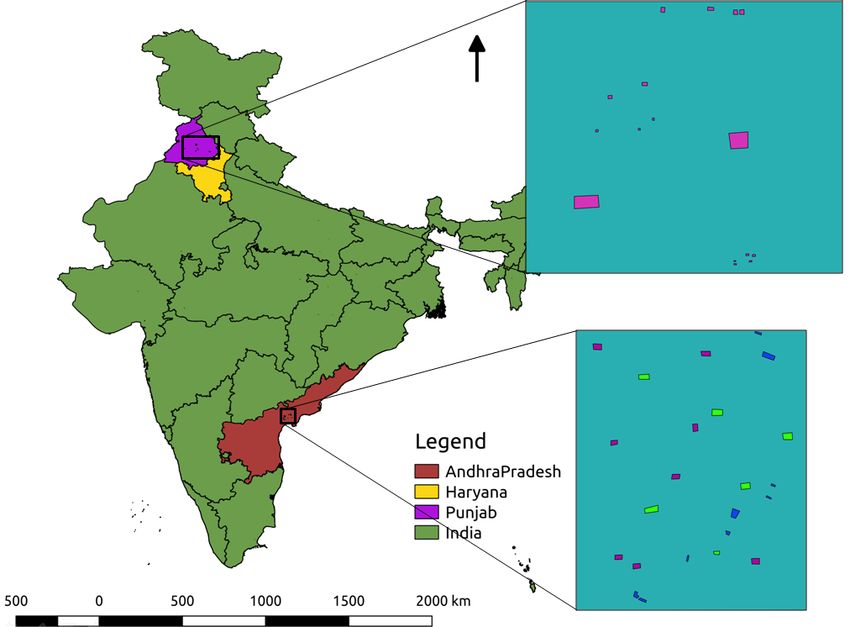
The analysis was performed over two Indian regions namely, Andhra information in VV, VH polarization along with local incidence
Pradesh and Punjab-Haryana. The study regions are situated in angle. Normalized Ratio Procedure between Bands (NRPB) was
India’s southern and northern parts respectively. The crops con- estimated using VV and VH backscatter using equation 1 and
sidered in this study are Paddy from Punjab and Haryana state. used in the analysis as one of the variables.
Punjab and Haryana are one of the major paddy producing belt
in India. Cotton, Turmeric and Banana crops considered from
σV H − σV V
Andhra Pradesh, India. Figure 1 shows the two locations where N RP B = (1)
σV H + σV V
the geotagged field data has been collected.
2.2.3 Ground truth data from field visits We have devel-
oped an android mobile application RuPS (Mohite et al. (2015))
for collection of field geo-coordinates and reporting various agri-
cultural activities and events. For the current research, geo-tagged
locations of the fields, crop cultivated on the field, its sowing or
planting date and estimated harvest date were collected using the
RuPS. Table 2 shows the number of plot boundaries collected for
each crop and the total number of pixels associated with those
crops.
2.3 Overall Approach
Each crop has a different crop season length therefore based on
crop sowing and estimated harvest date concerning the region, we
have considered NDVI and SAR data. For each crop and plot, we
have identified the same satellite overpass dates and data with 1
Figure 1. Study Area day difference for Sentinel-1 and 2 and only that data was consid-
ered in the analysis. Data on all other dates were ignored to avoid
2.2 Datasets Used noise and have the same reference. Plots were scattered all over
the region to account for the regional variations of crop growth.
In this study we have used Sentinel-1 and Sentinel-2 satellite im- The problem was devised as a regression analysis to establish
agery, ground truth data collected from the field visits. the relationship between NDVI as an independent variable using
This contribution has been peer-reviewed.
https://doi.org/10.5194/isprs-archives-XLIII-B3-2020-1379-2020 | © Authors 2020. CC BY 4.0 License. 1380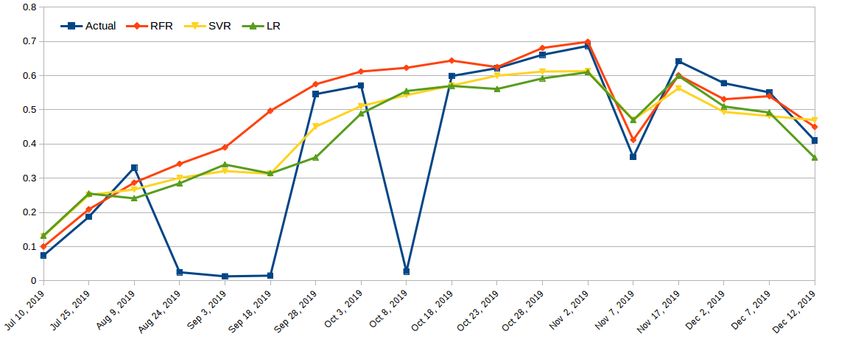
The International Archives of the Photogrammetry, Remote Sensing and Spatial Information Sciences, Volume XLIII-B3-2020, 2020
                                               XXIV ISPRS Congress (2020 edition)

                        SN    Month           Cotton/Banana/Turmeric            Rice
                        1     June            17-18, 29-30                      -
                        2     July            -                                 12, 16-17, 23-22, 28-27
                        3     Aug             4, 28-29                          5-6, 12-11, 16, 21, 28
                        4     Sept            9-8                               5, 10, 14-15, 21-20, 26-25
                        1     Oct             3, 27-28                          -

                              Table 1. Month and crop-wise availability of Sentinel-1 and 2 observations

          SN   Crop            No.of          Total Pixels
                               Fields
          1    Cotton          56             14988
          2    Banana          58             16438
          3    Turmeric        37             11352
          4    Rice            78             24544

       Table 2. Summary of crop-wise field observations

the dependant variables from SAR data. VV, VH backscatter, lo-
cal incidence angle and NRPB were considered as the dependant
variables. We tested the two scenarios (Table 3) using the Linear,
Support Vector and Random Forest regression. Support vector
and Random Forest regression models were tuned to get the best
performance on validation data.

    Scenario       Features Used               NDVI
    Sc1            VV, VH, Incidence An-       All NDVI
                   gle, NRPB
    Sc2            VV, VH, Incidence An-       NDVI greater
                   gle, NRPB                   than 0.25                            Figure 2. Overall Analysis Approach

Table 3. Various Scenarios Considered for Regression Analysis
                                                                      to find out the model with optimum trees. In the case of LR, we
                                                                      simply train the model on a random 80% dataset and tested of
                                                                      remaining 20% dataset. To avoid the bias in the random selection
               3. RESULTS AND DISCUSSION
                                                                      of dataset and noise, we ran the LR model 10 times and averaged
                                                                      the RMSE. Table 4 shows the performance of various models for
To carry out the regression analysis, we have extracted the data of   all crops. The LR model shows the average RMSE and RSQ,
NDVI, VV, VH, incidence angle and NRPB for all the pixels as-         however the performance of best models was shown for RFR and
sociated with individual crops. Crop-wise models are developed        SVR. The obtained results shows that the RFR produced the low-
for NDVI estimation. For each crop, data was divided into 80%         est RMSE for all the crops in the study. The RMSE using the
data for model training and 20% data for independent validation       RFR was about 0.08, 0.09, 0.11, 0.12 for Rice, Cotton, Banana
of the developed model. We evaluate the performance of Linear         and Turmeric respectively. Similarly, we have obtained R2 val-
Regression (LR), Support Vector Regression (SVR) and Random           ues of about 0.79, 0.76, 0.69 and 0.71 for the same crops using
Forest Regression (RFR). For models such as SVR, RFR there            the RFR. The model with 80 trees produced best results for Rice
are hyperparameters which could be tuned to obtain the optimum        and Cotton whereas, it is observed that the model with 90 trees
performance. Hence we carried out 3 fold cross-validation on the      produced best results for Banana and Turmeric. Also, we have
training data to obtain the best parameters for SVR and RFR.          observed that, SVR with RBF kernel was good for all crops when
                                                                      comparing the Linear vs RBF kernel of SVM. The performance
SVR is tuned for C at 0.1,1,10,100, Sigma at 1, 0.1, 0.01, 0.001      of linear regression was poor among all models. Non-linear mod-
and type of kernel tried were Linear and Radial Basis Function.       els such as SVR with RBF kernel and RFR performed well.
The model with best parameters (out of 32 models) was deter-
mined using 3 fold cross validation. Performance of the best          Overall modeling was repeated considering NDVI values greater
model was evaluated using a 20% validation dataset. RMSE was          than 0.25. This is to verify whether there is any influence of soil
used as a performance measure to decide the best model. Model         background on the overall model performance. Table 5 shows the
with the lowest RMSE was considered as the best model. The            performance of various models for the data with NDVI greater
same strategy was applied for RFR by tuning the parameters such       0.25.
as number of Trees. The number of trees were varied from 10 to
100 with an interval of 10. A total of 10 models were evaluated       We can clearly see the improvements across all the models (both

                                                This contribution has been peer-reviewed.
                 https://doi.org/10.5194/isprs-archives-XLIII-B3-2020-1379-2020 | © Authors 2020. CC BY 4.0 License.               1381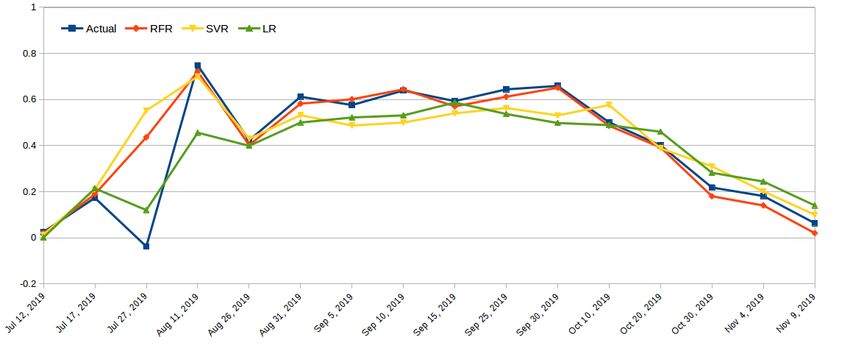
The International Archives of the Photogrammetry, Remote Sensing and Spatial Information Sciences, Volume XLIII-B3-2020, 2020
                                               XXIV ISPRS Congress (2020 edition)

             SN     Crop           LR rmse         LR rsq             SVM rmse         SVM rsq         RF rmse        RF rsq
             1      Rice           0.11            0.59               0.08             0.69            0.08           0.79
             2      Cotton         0.17            0.51               0.14             0.64            0.09           0.76
             3      Banana         0.24            0.37               0.15             0.58            0.11           0.69
             4      Turmeric       0.16            0.5                0.11             0.67            0.10           0.71

                                     Table 4. Performance of Various Models for Scenario 1 (Sc1)

             SN     Crop           LR rmse         LR rsq             SVM rmse         SVM rsq         RF rmse        RF rsq
             1      Rice           0.12            0.66               0.09             0.8             0.05           0.83
             2      Cotton         0.17            0.49               0.12             0.67            0.06           0.78
             3      Banana         0.21            0.54               0.15             0.62            0.10           0.71
             4      Turmeric       0.18            0.52               0.1              0.72            0.09           0.77

                                     Table 5. Performance of Various Models for Scenario 2 (Sc2)

linear as well non-linear) when considering the NDVI greater
than 0.25. We observed decrease in the RMSE and improvement
in R2 values for all the crops using the RFR models. Such re-
sults show that, the soil background available during initial crop
growth period was responsible for poor relationship between NDVI
and SAR data.

3.1   Temporal analysis of few pixels

For continuous monitoring of vegetation, it is important to get the
temporal and continuous data of NDVI. To check the temporal                     Figure 3. Actual vs Temporal NDVI predicted by Various
feasibility of the developed models, we applied the best models                                    Models for Cotton
(Linear, SVR, RFR) on unknown fields for each crop. We did
not consider this field for model development as well as for val-
idation. For each crop, we have chosen one field and plotted the
time-series of NDVI estimated using the best model and actual
time-series of median NDVI for that field.

Figure 3 shows the time-series pattern for cotton where we can
see the RFR model predicts the NDVI which closely matches the
actual NDVI for almost all the dates. Also, there was a cloud
during the month of July, August and September so there was a
drop in the actual NDVI but RFR model predicted NDVI which
closely follows the actual temporal NDVI pattern. In the case of                Figure 4. Actual vs Temporal NDVI predicted by Various
Banana crop time-series (Figure 4), although the crop is present                                   Models for Banana
throughout the year, we have plotted the time-series between July
to Dec 2019. The banana field was mostly affected by clouds
during July- September. RFR model predicted NDVI which is
closely following the pattern of actual NDVI wherever the ac-
tual cloud-free NDVI values are available. Figure 5 shows the
time-series pattern for Turmeric. The field is covered by clouds
towards the end of August and September. However, RFR pre-
dicted NDVI was in good agreement with actual NDVI and pre-
dicted the values at cloudy dates which followed the pattern of
actual NDVI. Figure 6 shows the time-series of actual and pre-
dicted NDVI for rice. All the models were good to follow the ac-
tual NDVI however, RFR followed the actual NDVI pattern more                    Figure 5. Actual vs Temporal NDVI predicted by Various
accurately among all.                                                                             Models for Turmeric

           4. SUMMARY AND CONCLUSIONS                                        Local Incidence Angle and NRPB. The study has been carried out
                                                                             at two different locations considering the variety of crops during
We have attempted to establish a relationship between NDVI de-               Kharif 2019. The crops considered in this study are Paddy from
rived from Sentinel-2 and Sentinel-1 based VV, VH backscatter,               Punjab and Haryana whereas Cotton, Turmeric and Banana from

                                                 This contribution has been peer-reviewed.
                  https://doi.org/10.5194/isprs-archives-XLIII-B3-2020-1379-2020 | © Authors 2020. CC BY 4.0 License.                    1382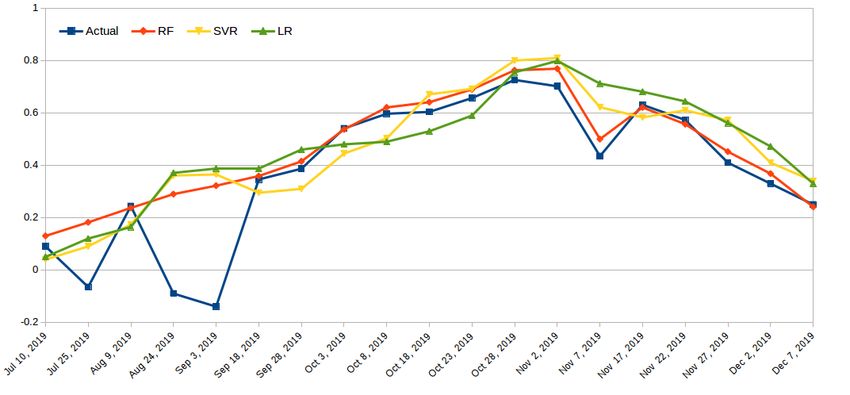
The International Archives of the Photogrammetry, Remote Sensing and Spatial Information Sciences, Volume XLIII-B3-2020, 2020
                                               XXIV ISPRS Congress (2020 edition)

                                                                         Capodici, F., D’Urso, G. and Maltese, A., 2013. Investigating the re-
                                                                           lationship between x-band sar data from cosmo-skymed satellite and
                                                                           ndvi for lai detection. Remote Sensing 5(3), pp. 1389–1404.

                                                                         Davidse, J., 2015. The relation between the ndvi and backscatter of
                                                                           sentinel-1 for sugarcane monitoring. Technical report, Internship Re-
                                                                           port GRS-70424, Wageningen University.

                                                                         ESA, 2020a. Sentinel-1. https://sentinel.esa.int/web/sentinel/missions/sentinel-
                                                                           1.

                                                                         ESA, 2020b. Sentinel-2. https://sentinel.esa.int/web/sentinel/missions/sentinel-
   Figure 6. Actual vs Temporal NDVI predicted by Various                  2.
                        Models for Rice
                                                                         Filgueiras, R., Mantovani, E. C., Althoff, D., Fernandes Filho, E. I. and
                                                                            Cunha, F. F. d., 2019. Crop ndvi monitoring based on sentinel 1. Re-
                                                                            mote Sensing 11(12), pp. 1441.
Andhra Pradesh, India. Regression analysis was carried out for
NDVI estimation using SAR derived variables. We evaluated the            Filipponi, F., 2019. Sentinel-1 grd preprocessing workflow. In: Multidis-
performance of various linear (Linear Regression and SVR with               ciplinary Digital Publishing Institute Proceedings, Vol. 18number 1,
                                                                            p. 11.
Linear Kernel) as well as Non-Linear (SVR with RBF Kernel and
RFR) models. Parameter tuning was done for SVR and RFR to                Frison, P.-L., Fruneau, B., Kmiha, S., Soudani, K., Dufrêne, E., Le Toan,
get the best results. The Root Mean Square Error (RMSE) and                 T., Koleck, T., Villard, L., Mougin, E. and Rudant, J.-P., 2018. Poten-
                                                                            tial of sentinel-1 data for monitoring temperate mixed forest phenol-
R-Square (R2) were used as the performance indicators. The ob-              ogy. Remote Sensing 10(12), pp. 2049.
tained results shows that the RFR produced the lowest RMSE for
all the crops in the study. The average RMSE using the RFR was           Gorelick, N., Hancher, M., Dixon, M., Ilyushchenko, S., Thau, D. and
about 0.08 0.09, 0.11, 0.10 for Rice, Cotton, Banana, Turmeric,            Moore, R., 2017. Google earth engine: Planetary-scale geospatial
                                                                           analysis for everyone. Remote Sensing of Environment.
respectively. Similarly, we have obtained R2 values of about 0.79,
0.76, 0.69 and 0.71 for the same crops using the RFR. The model          Mazza, A., Gargiulo, M., Scarpa, G. and Gaetano, R., 2018. Estimating
with 80 trees produced best results for Rice and Cotton whereas,           the ndvi from sar by convolutional neural networks. IGARSS IEEE
                                                                           International Geoscience and Remote Sensing Symposium.
it is observed that the model with 90 trees produced best results
for Banana and Turmeric. Further, we have considered data with           Mohite, J., Karale, Y., Gupta, P., Kulkarni, S., Jagyasi, B. and Zape, A.,
NDVI greater than 0.25 and carried out a similar analysis. We ob-          2015. Rups: Rural participatory sensing with rewarding mechanisms
                                                                           for crop monitoring. Pervasive Computing and Communication Work-
served a decrease in the RMSE and improvement in R2 values for             shops (PerCom Workshops), 2015 IEEE International Conference on.
all the crops using the RFR models. We found that, RMSE was
decreased to 0.05, 0.06, 0.10 and 0.09 for Rice, Cotton, Banana          Mohite, J., Sawant, S., Kumar, A., Prajapati, M., Pusapati, S., Singh,
and Turmeric respectively. Moreover, R2 was increased to 0.83,             D. and Pappula, S., 2018. Operational near real time rice area map-
                                                                           ping using multi-temporal sentinel-1 sar observations. International
0.78, 0.71 and 0.77 respectively for these crops. We found that            Archives of the Photogrammetry, Remote Sensing & Spatial Informa-
the estimation of NDVI was good for high canopy density com-               tion Sciences.
pared to crop in the early stages with soil background. Further,
                                                                         Mohite, J., Sawant, S., Sakkan, M., Shivalli, P., Kodimela, K. and Pap-
we have also plotted the time-series of actual vs estimated NDVI           pula, S., 2019. Spatialization of rice crop yield using sentinel-1 sar
using all the models for various crops. NDVI predictions made              and oryza crop growth simulation model. 2019 8th International Con-
by the RFR model were closely matching with actual NDVI for                ference on Agro-Geoinformatics (Agro-Geoinformatics).
almost all temporal instances. This was followed by SVR and              Navarro, A., Rolim, J., Miguel, I., Catalão, J., Silva, J., Painho, M.
LR.                                                                        and Vekerdy, Z., 2016. Crop monitoring based on spot-5 take-5 and
                                                                           sentinel-1a data for the estimation of crop water requirements. Remote
                                                                           Sensing 8(6), pp. 525.
                      5. FUTURE WORK
                                                                         Padhee, S. K. and Dutta, S., 2019. Spatio-temporal reconstruction of
As a part of future work, we plan to implement the method on               modis ndvi by regional land surface phenology and harmonic analysis
every cloudy pixel with respective crop and generate the cloud-            of time-series. GIScience & Remote Sensing.
less NDVI images. This will basically help us to carry out the           Roerink, G., Menenti, M. and Verhoef, W., 2000. Reconstructing cloud-
comparison between the actual and generated NDVI images on a               free ndvi composites using fourier analysis of time series. Interna-
spatial level. In addition to this, we plan to collect more data on        tional journal of remote sensing 21(9), pp. 1911–1917.
other crops cultivated during Kharif season and develop models           Rouse, J., Haas, R., Schell, J. and Deering, D., 1974. Monitoring vege-
for those crops.                                                           tation systems in the great plains with erts. NASA Special Publication
                                                                           351.

                   ACKNOWLEDGEMENTS                                      Sawant, S., Mohite, J., Sakkan, M. and Pappula, S., 2019. Near real time
                                                                           crop loss estimation using remote sensing observations. 2019 8th Inter-
We are very thankful to team members of Digital Farming Initia-            national Conference on Agro-Geoinformatics (Agro-Geoinformatics).
tives (DFI), Tata Consultancy Services Ltd. (TCS) for helping us         Vreugdenhil, M., Wagner, W., Bauer-Marschallinger, B., Pfeil, I., Teub-
with field observations. Also, we thank our organization, TCS for          ner, I., Rüdiger, C. and Strauss, P., 2018. Sensitivity of sentinel-1
funding our research.                                                      backscatter to vegetation dynamics: An austrian case study. Remote
                                                                           Sensing 10(9), pp. 1396.

                            References
Adam, F., Mönks, M., Esch, T. and Datcu, M., 2018. Cloud removal in
  high resolution multispectral satellite imagery: Comparing three ap-
  proaches. Proceedings of The 2nd International Electronic Conference
  on Remote Sensing.

                                                 This contribution has been peer-reviewed.
                  https://doi.org/10.5194/isprs-archives-XLIII-B3-2020-1379-2020 | © Authors 2020. CC BY 4.0 License.                        1383
You can also read